› Forums › General Discussion › Doing stats with pixel values
- This topic has 6 replies, 4 voices, and was last updated 6 months, 2 weeks ago by
 Dawson.
-
AuthorPosts
-
3 January 2026 at 8:44 am #632914
 DawsonParticipant
Rather than reinventing the wheel I thought I’d ask here…
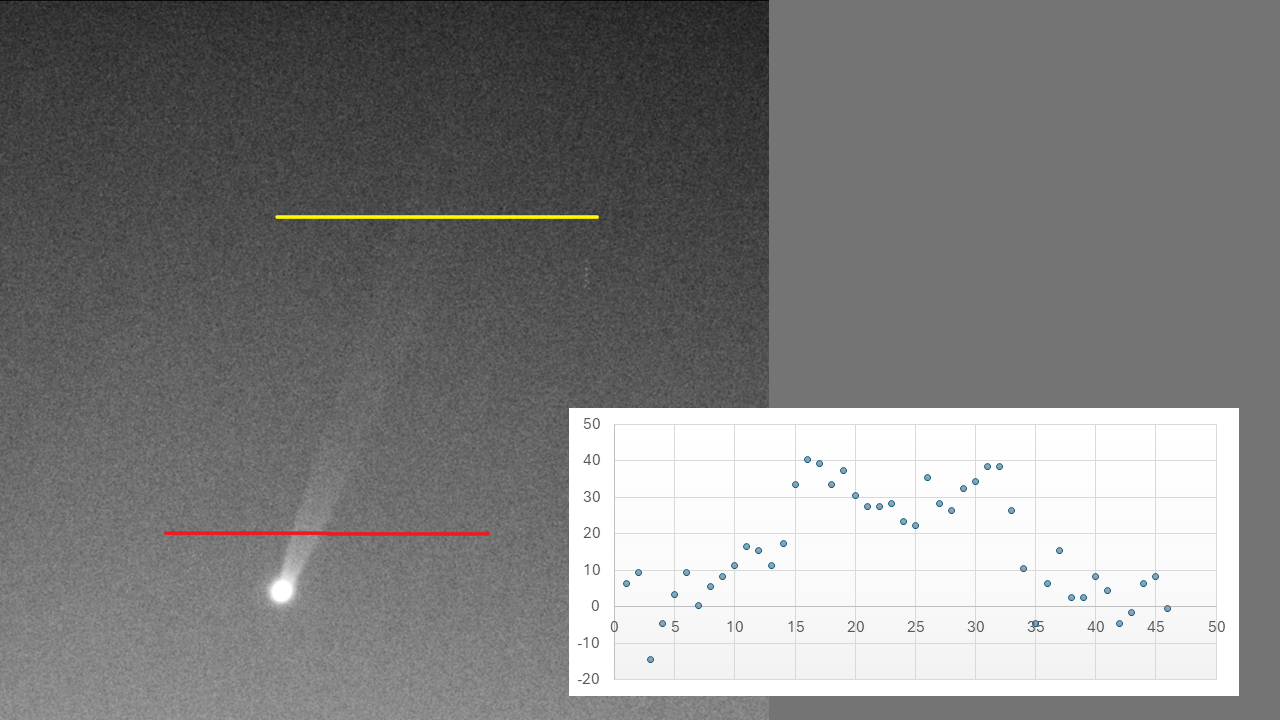
With regards Mercury’s tail, I’d like to take transects across the tail, extract the average pixel value for the background, and then look for the ‘contours’ of the tail at different points along the tail, and also do some stats to work out where my detection of the tail ends, in probability.
I’ve found a tool called ImageJ which can extract the pixel values for a limited region of interest (it is quite laborious and there is probably a better way), and I’ve done a very unscientific sample of the background sky to get a mean pixel value, and then subtracted this from the transect of the tail along the same row of pixels, and plotted these as can be seen; this was along the red transect line. This was with a compressed version of the image so not full range of pixel values.
My questions are:
1. is there a Windows-based tool I can easily extract pixel values from a row of pixels from a TIF image?
2. From a maths/stats view, should my average value for the background be calculated from all pixel values along that transect line, or just those bits of sky away from the tail?
3. What analytical process should I apply to the data when looking for my detection threshold of the tail, to suggest a probability that my pixel values are above the background level or not?Thanks.
James
Attachments:
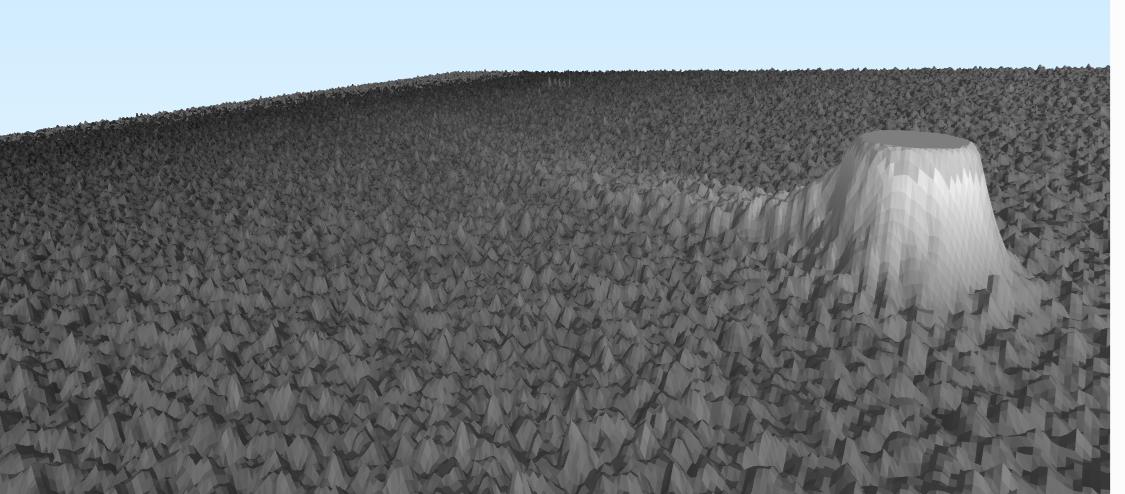
3 January 2026 at 8:55 am #632916DawsonParticipantThe other thing I stumbled on, free online, is a website called ImagetoSTL: https://imagetostl.com/
It uses pixel intensity to create a 3D projection which the user can rotate, zoomin etc, really impresive. Does anyone do this kind of stuff with astro data?
Attachments:
3 January 2026 at 12:56 pm #632921 Dominic FordKeymaster
Hi James,
I fear this isn’t the answer you’re looking for, but this is the kind of task that is very easy in Python:
from PIL import Image
im = Image.open("my_image.tif")
pixels = list(im.getdata())
width, height = im.size
pixels = [pixels for i in xrange(height)]
You can then do whatever you like with your giant array of pixel values. The
numpymodule already has lots of statistical tools available for immediate use, so your final Python script might be fewer than ten lines of code.The BAA forum has removed a set of brackets from the last line of the code snippet above and I can’t work out how to fix it, but you should get the idea nonetheless…
Best wishes,
Dominic
-
This reply was modified 6 months, 2 weeks ago by
 Dominic Ford.
3 January 2026 at 7:52 pm #632927 Nick JamesParticipant
James,
Nice to see Mercury being treated as a comet!
Indeed, as Dominic says, Python is a great way of doing this. Once you’ve understood the basics of the language you can do almost anything and there is a huge amount of existing code in libraries that make even complex tasks very simple. It is definitely worth the time spent learning it and it will open up many interesting areas of study on digital images.
With regard to your questions, it depends a bit on how flat your sky background is (or how flat you can make it). I generally estimate the sky background using an initial median to reject outliers and then a mean but this only works when (a) the sky is reasonably flat and (b) you have a lot more sky pixels than non-sky ones. That is usually the case with 2D images containing stars but may not be for a 1D slice depending on how you do things. For one thing I would make your slice quite wide and integrate up all of the pixels in the PA of the tail. This will improve the SNR significantly. This is a bit like the way that spectroscopists integrate pixels normal to the slit direction.
Regarding thresholds I compute the RMS offset of “sky” pixels relative to the calculated mean sky value and then set the detection threshold at something reasonable like 1 or 2 sigma.
My comphot software does this for comet magnitudes as described on page 23 of Comet’s Tale 40:
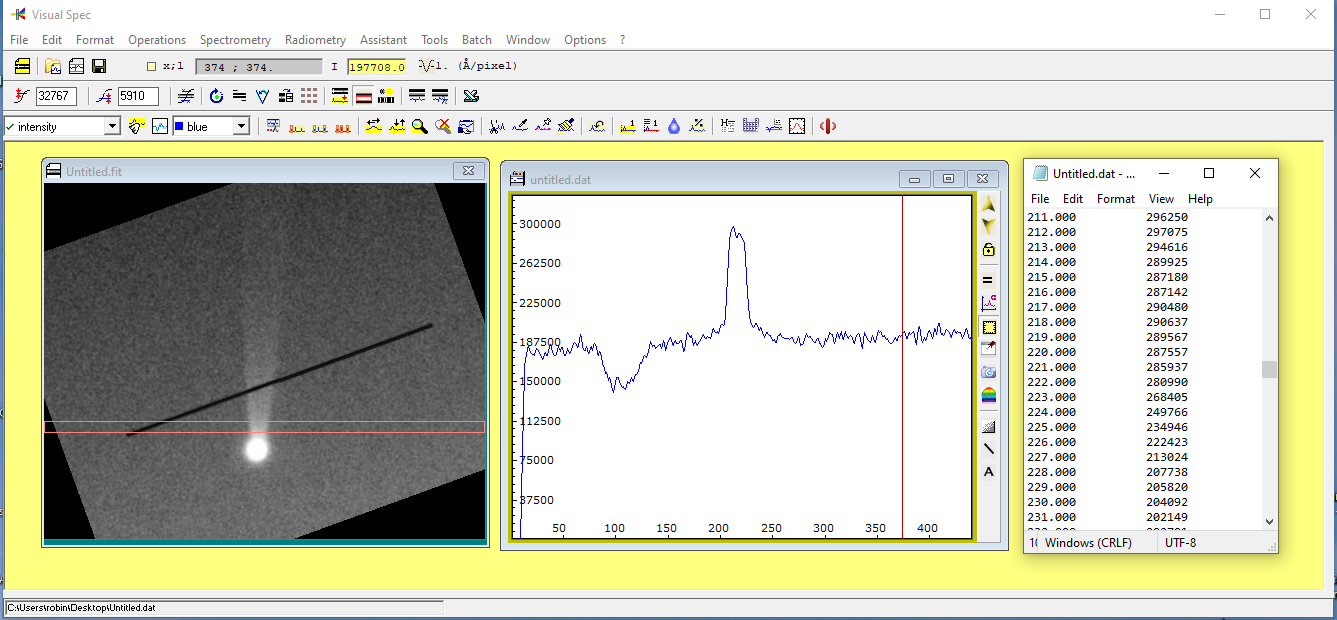
3 January 2026 at 8:35 pm #632928 Robin LeadbeaterParticipant
This is a bit like the way that spectroscopists integrate pixels normal to the slit direction.
A quick and dirty measurement from the image using VisualSpec
Attachments:
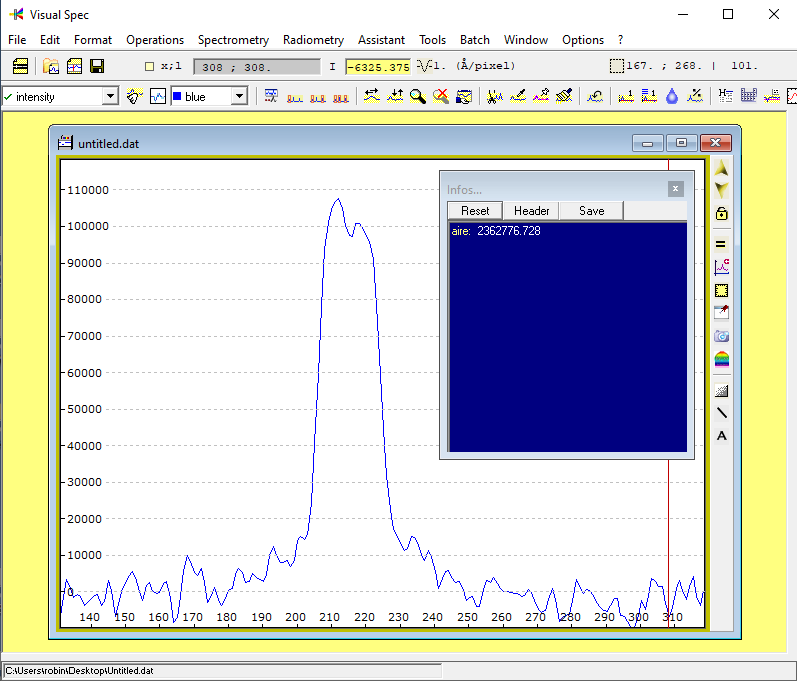
3 January 2026 at 8:44 pm #632930Robin LeadbeaterParticipantProfile with the background subtracted using a spline fit and the integrated count
Attachments:
4 January 2026 at 5:25 am #632932DawsonParticipantThank you all.
Robin’s solution looks like a good solution, and after a bit of playing with the software I will spend some time playing with that. I wish I had spent more time programming as a teenager as I can see the power of Python etc, but it’s not something I would currently use often enough to retain new learning.
-
AuthorPosts
- You must be logged in to reply to this topic.