- This topic has 5 replies, 5 voices, and was last updated 3 years, 8 months ago by
Steve Holmes.
-
AuthorPosts
-
3 November 2022 at 2:05 pm #613459
 Dominic FordKeymaster
Back in September, various news outlets reported that this year’s opposition of Jupiter was the closest since 1963 – including EarthSky [1], Scientific American [2], Sky & Telescope, CNN, etc. Last week, John Rogers asked my thoughts on this – specifically whether this was purely down to chance or due to periodic oscillations in Jupiter’s orbit. This piqued my interest to do some calculations, and I hope John won’t mind if I post my conclusions here for all to see.
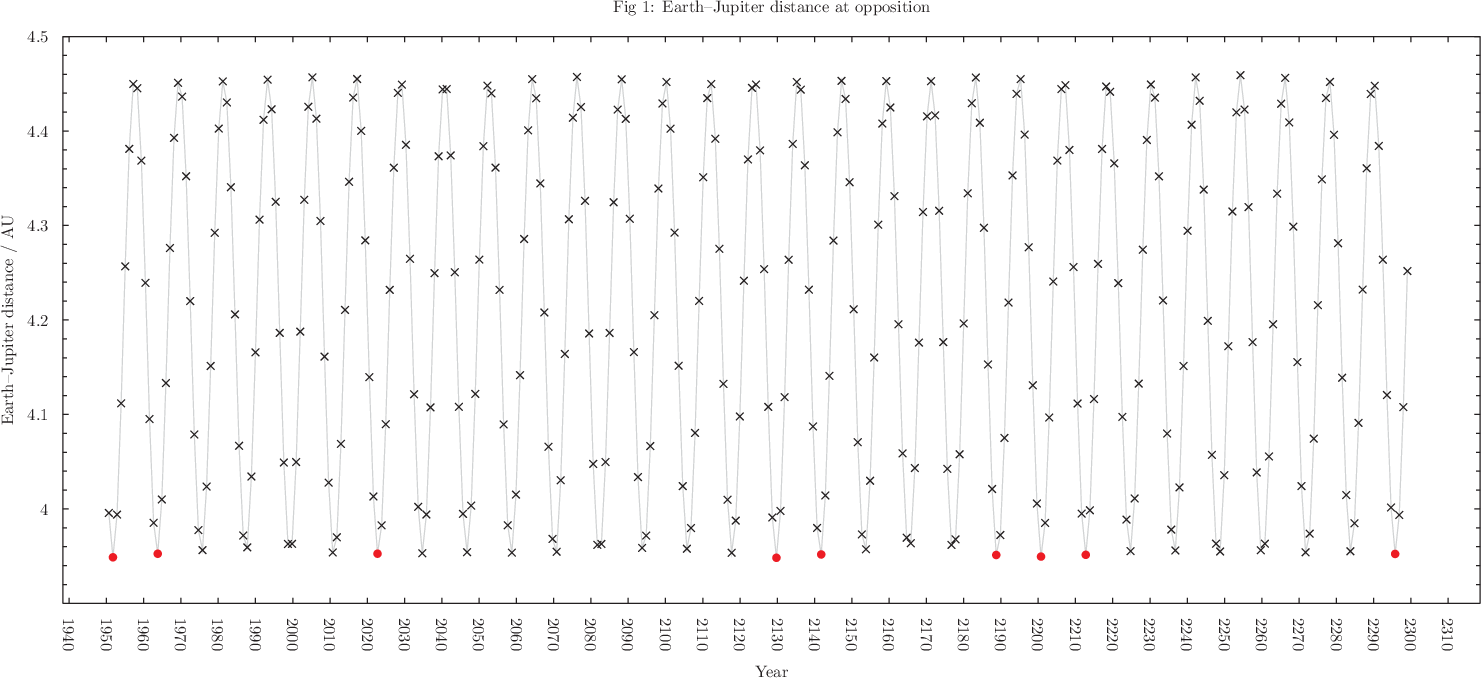
In Figure 1 (attached below), I’ve plotted the Earth-Jupiter distance at every opposition between 1950 and 2300. The red points are oppositions that are closer than the 2022 opposition. By far the dominant effect is a 12-year oscillation, brought about by Jupiter’s orbit carrying it between perihelion (4.95 AU) and aphelion (5.46 AU). As you’ll see, the reports of the “closest opposition for 70 years”, whilst mathematically true, were somewhat over-hyped. There have been five other oppositions in those 70 years which were only fractionally less close.
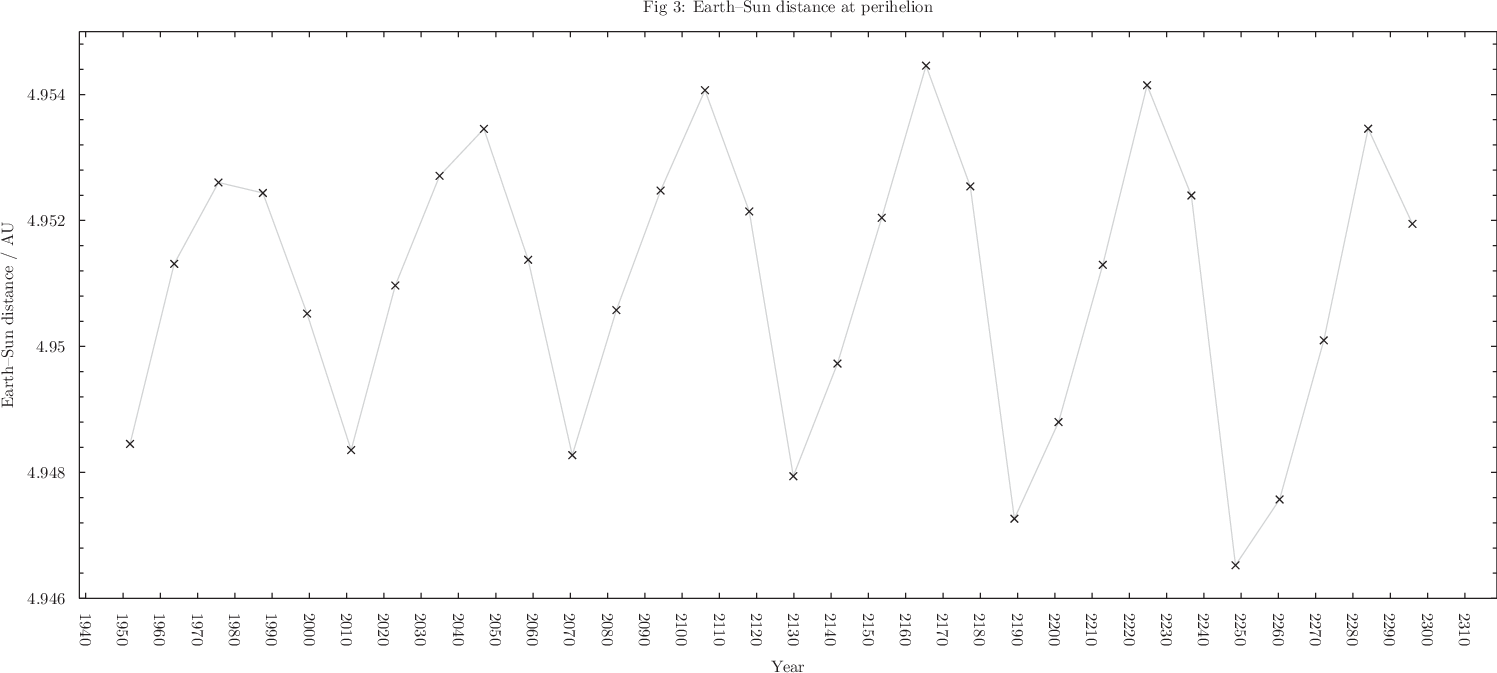
John was curious about the impact of periodic oscillations in Jupiter’s orbit – for example, the 60-year cyclic perturbations induced by Saturn. In Figure 3, I’ve plotted Jupiter’s distance from the Sun at each perihelion between 1950 and 2300. The 60-year oscillation induced by Saturn is very apparent here, but it’s an absolutely tiny effect compared to difference between Jupiter’s perihelion and aphelion distances (0.5 AU).
So, in short, I think the closeness of the 2022 opposition is simply down to the close alignment between Jupiter’s opposition (26 Sept 2022) and perihelion (22 Jan 2023). Of course, the four-month separation is hardly a particularly close alignment. But since Jovian perihelions only come around once every 12 years, it’s quite possible to go for 70 years without getting a closer alignment than that.
The EarthSky article (link below) included this curious paragraph… “Jupiter isn’t always exactly closest to Earth on the day of its opposition. But in 2022, Jupiter’s opposition to the sun and closest approach to Earth fell on the same day. That’s because opposition took place so near in time to Jupiter’s perihelion – on January 21, 2023 – its closest point to the sun in its 12-year orbit. If it’s nearly closest to the sun, and we go between it and the sun … voilà, it’s a close opposition for us!”.
This claim was also repeated by other news outlets, and I think it’s broadly wrong.
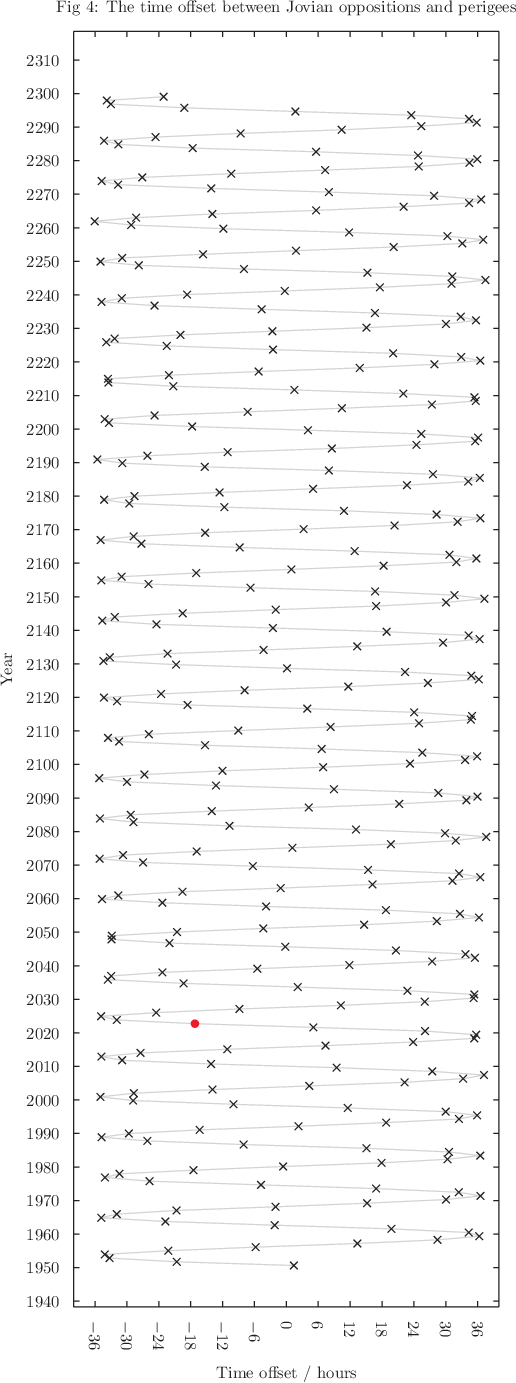
To demonstrate this, in Figure 4 I have plotted the time interval between Jupiter reaching perigee and the moment of opposition. As you’ll see, the maximum offset is +/- 36 hours. So, Jupiter is always closest to the Earth on (or very nearly) the day of its opposition. Moreover, the offset in 2022 (shown by the red dot) – around 18 hours – is actually rather large.
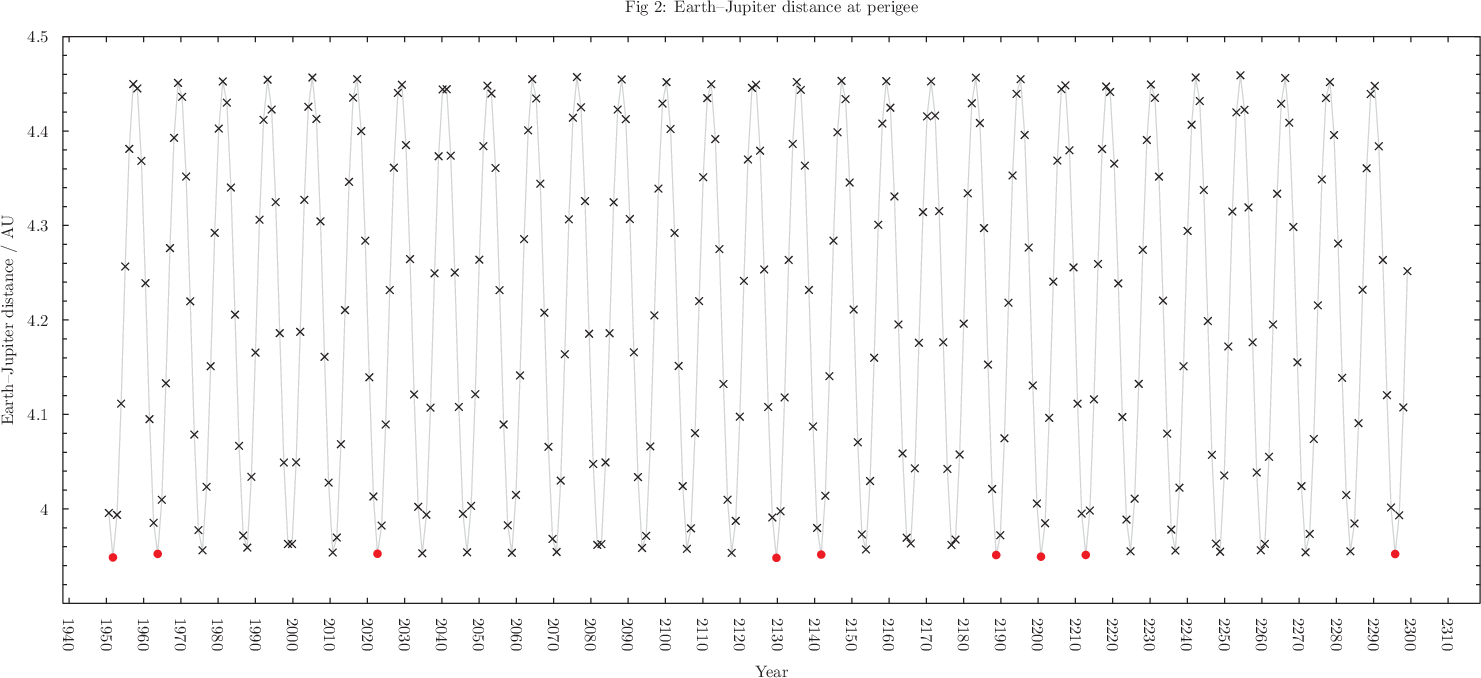
To reinforce this point, in Figure 2, I’ve plotted the Earth-Jupiter distance at every *perigee* between 1950 and 2300 (equivalent to Figure 1, but for perigees rather than oppositions). If you think it looks very similar to Figure 1, you’re right. The two plots are basically identical.
So, what were EarthSky thinking? Well… if you don’t do the calculations, I think you might expect Jupiter’s perigee to be displaced some time before opposition when it is receding from the Sun, and displaced after opposition when Jupiter is moving closer to the Sun. In practice, though, the Earth’s orbital velocity is much higher than Jupiter’s, and this is rather significant in determining the displacement of perigee vs opposition. Even though, in terms of the absolute Jupiter-Earth distance, the non-circular shape of the Earth’s orbit is totally negligible, since the difference between the Earth being at perihelion vs aphelion is only 0.03 AU.
—–
[1] – https://earthsky.org/astronomy-essentials/jupiter-at-opposition-closest-brightest-best/
[2] – https://www.scientificamerican.com/article/see-jupiter-shine-during-its-closest-approach-to-earth-since-1963/-
This topic was modified 3 years, 8 months ago by
 Dominic Ford.
5 November 2022 at 4:27 pm #613486 David ArdittiParticipant
Very interesting and well-researched.
I’d say this is worth being a short article in the Journal.
6 November 2022 at 10:03 am #613487John Rogers
ParticipantThanks for researching and posting this analysis. So from your charts (and exact dates that you have sent me), it appears that the recent opposition was the closest for 70 years due to a combination of the 60-year cycle in perihelion distance, and an ~86-year cycle in the time of Jupiter’s apparition in which perihelion occurs. The smallest perihelion distance in the present 60-year cycle was actually in 2010, but this occurred far from opposition (and similarly in 2070). In 2022/23, perihelion distance is about average, but it occurs closer to opposition than average. In 2129, a close perihelion will occur close to opposition, so the distance from Earth will be even less.
7 November 2022 at 2:58 pm #613503Steve Holmes
ParticipantI also analysed this situation in some detail, having seen many reports on the Internet about “nearest for 59 years”, with some claimimng 70 years. I came to the same general conclusions as Dominic and John – that this year’s opposition was closer than those dating back to 1963 / 1951 because although the perihelion to opposition interval was slightly greater than average (when the average is taken over the most recent cycle) and perihelion itself was very close to average, the combination of the two parameters was the most favourable overall during this period. This is because of the phase difference between the ~83yr cycle of perihelion-opposition intervals and the 59-yr cycle of closer perihelions.
During the period prior to the present, perihelion distances were smaller than average for the 2010 and 1999 oppositions but the perihelion-opposition intervals were greater, and then although the p-o interval in 1987 and 1975 was less than average the perihelion distance was greater. It was not until 1963 that near optimum conditions were reached again, with a minimum p-o interval and just above average perihelion distance. The situation in 1951 was then even better, with a much less than average p-o interval but a minimum perihelion distance. Things got steadily worse before that, with both the p-o interval and the perihelion distance steadily increasing.
However, it should be noted that the variation in Sun-Earth distance has a greater effect on the results over this period than might have been assumed from Dominic’s final paragraph. While it is of course true that the variation in Jupiter’s orbit is greater than that in the Earth’s, it is important to consider distances at opposition rather than at Jupiter’s perihelion, and because of the large changes in perihelion-opposition interval the opposition distances have a different “variation profile” from the perihelion distances alone. In fact, the Sun-Earth distance at opposition in 2022 was from 0.0077 to 0.0021AU greater than in all the oppositions from 1999 to 1951 while the Sun-Jupiter opposition distance varied from 0.0027AU greater to 0.0058AU smaller than 2022 over the same period. It can thus be seen that the two variations in distance actually had the same degree of influence on the final result.
A very interesting analysis to undertake, however!
7 November 2022 at 6:26 pm #613515James Lancashire
ParticipantVery interesting. Though hasn’t Jean Meeus already done calculations like this? Or the BAA Computing Section?
8 November 2022 at 11:40 pm #613529ParticipantIt is certainly true that Jean has done many calculations of this type but not, as far as I am aware, about this specific topic.
-
This topic was modified 3 years, 8 months ago by
-
AuthorPosts
- You must be logged in to reply to this topic.