- This topic has 51 replies, 6 voices, and was last updated 9 years, 5 months ago by
 Bill Ward.
-
AuthorPosts
-
16 August 2015 at 2:55 pm #576974
 Robin LeadbeaterParticipant
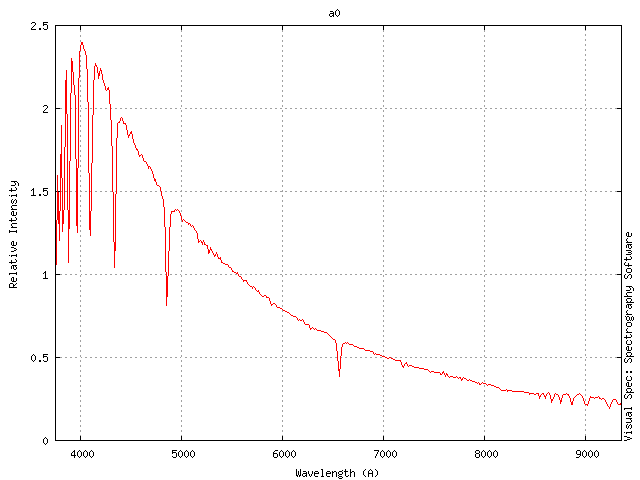
This document showing how a range of slitless (Star Analyser) spectra were corrected for instrument response using a MILES standard A0v star might also be of interest
http://www.threehillsobservatory.co.uk/astro/SA100_miles_instrument_response.pdf
from this page
http://www.threehillsobservatory.co.uk/astro/spectroscopy_21.htm
The results are pretty good, though some small errors can be seen at the blue end due to atmospheric extinction which was only partially corrected for. Using matched reference stars at the same elevation as each target star rather than a common reference would have improved this.
Robin
21 August 2015 at 10:44 am #576981 Bill WardParticipant
Hi Gents,
Thanks for the comments. It’s great to hear alternative perspectives and different experiences!
Robin, do you mean this….
Perhaps not worded too cleverly on my part. The “oscillations” being the converging H lines. However using this method on meteors is not quite the same as using it on stars. For example when you divide a meteor spectrum through by a stellar spectrum there is still the issue of where exactly to select points to derive a continuum to act as the response.
I tended to end up with curves that were rather wavy. Below is an a quick plot I’ve made using an actual repsonse from an early test. Maybe its the methodology (as you describe in the examples on your web site) but for meteor spectrum correction I just don’t think it’s quite right.
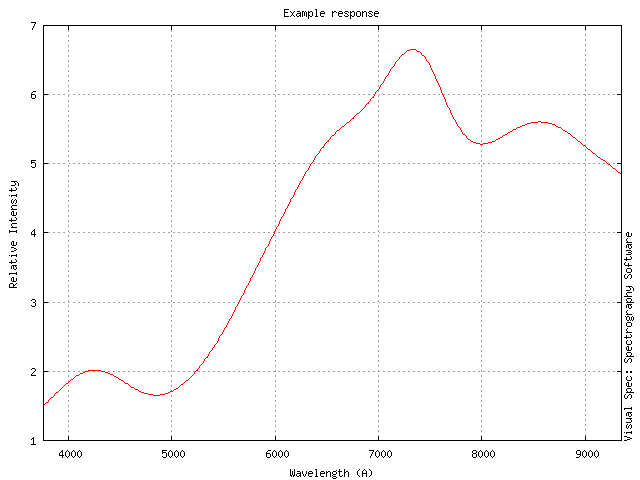
If one uses ones imagination it approximates the nominal silicon photodiode curve as it surely must. (Unless there is evidence that a silicon based detector was not used in the visible of course). Thats what put it into my mind to invesitgate further.
Here is a nominal silicon photodiode response curve I produced from date taken from a large photodiode manufacturers website.
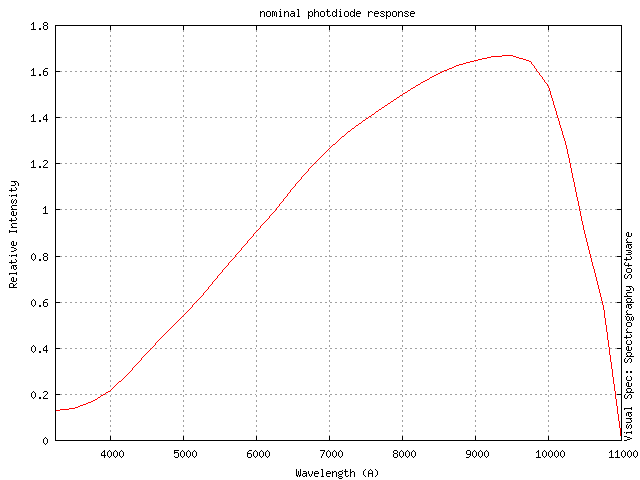
Dividing thorugh by this will give a form to the meteor spectrum then the other calibrations and corrections can be done as you discuss. However the problem with this approach is that although the form of the curve remains the same the peak moves slightly depending on how each photodiode site is biased by the electronics. THAT is a dark secret known only to the manufacturer!
From my experience at work I’d say the peak was closer to 820-850nm in real photodoides but I think that can be corrected itself by the appropriate normalisation point before division.
But then again maybe we’re right back to where we started…. It’s great fun!
There are a couple of papers by the various experts such as Borovicka and Jenniskens deriving absolute fluxes which is what we’d like. They seem to rely on various measurements made on the ratio of particular groups of lines (such iron lines in the blue) to derive an effective temperature. I’m not sure I understand the maths behind it but in some cases, but as promoted by Borovicka, there are different temperature regimes that complicate the matter further. These temperatures are generated by the particular properties of the meteoroid and its encounter with Earth, size, composition, velocity angle of entry etc. So getting what would be in effect an inverse black body curve for the appropriate physical temperature to do further calibration with is very difficult because we don’t know this in advance!
It is rather ironic that the very atmosphere that generates the meteor itself scatters efficiently in the blue. Right where the interesting lines are that we need to measure in the first place. Who’s say Pacha Mama doesn’t have a sense of humour….
I’m beginning to think “tricky” just doesn’t cover it ;-).
cheers,
Bill.
21 August 2015 at 10:40 pm #576982Bill WardParticipantHi,
Sorry Andy, I forgot to add the response to your question, which is I’m not sure. This is at the hub of the “temperature problem”.
The curve should be the emission spectrum superimposed on a black body curve dependant on the physical temperature in the atmosphere. However in physics speak it is a “far from equlibrium process” This I believe is what leads to the catch 22 with the analysis based of line ratios. The get the correct line intensities you need to know the temperaure but to get the temperature you need to use the corrected line ratios. Somewhere an assumption has to be used to break the log jam. That’s how I read it anyhow. I can’t put my hand on the copy I have right now but there is a good book from the 60’s that give a good outline of whats going on in reasonably understandable terms. I’ll put the details on here shortly in case you want to get into it a bit more.
cheers,
Bill.
23 August 2015 at 9:42 am #576983 Andy WilsonKeymaster
Hi Bill,
Reading your post I notice that you say:
“when you divide a meteor spectrum through by a stellar spectrum”
I’m not sure if this is what you really meant, as this is not how corrections are applied.
When creating a response correction you divide a stellar spectrum by a professional corrected spectrum for the same star, or at least by a standard spectrum for the spectral class of the star. This gives you your instrument and atmospheric correction. This is an imperfect process since the resolutions will be different resulting different line widths, the alignment may not be perfect, and you have atmospheric telluric lines in your spectrum. However, a smooth curve can usually be obtained by tweaking parameters and applying some smoothing to get rid of sharp bumps due to anomalies near absorption lines.
This is then your response correction. Robin’s links show this process with illustrations of actual spectra. You can the apply this response correction curve to a meteor spectrum.
The problem is this is best done with the star at the same altitude as the target. Otherwise the effect of increasing airmass has a big impact on the spectrum with decreasing altitude and the response correction will be wrong. So ideally you’d have an image with the same setup, but perhaps a longer exposure, that would include an A type star at the same altitude as the meteor. Of course the meteor is not at a single altitude so even this is not straight forward. A star at around the mid-altitude of the meteor might suffice as an approximation.
I also find it difficult to get a good correction at the extreme blue or red. When producing a corrected spectrum I just accept that I may have to crop off the extreme wavelengths.
Apologies if this is just going over what you already know.
Best wishes,
Andy
23 August 2015 at 7:22 pm #576986Andy WilsonKeymasterHi Bill,
I might give meteor spectroscopy a go sometime, but probably not just yet. I’m in the final stages of getting a new telescope and observatory setup for spectroscopy, so that is taking up all my astronomy time at the moment. I’m guessing you use a grating in front of the camera lens? Apologies if you posted above in the thread. I’d be interested to see a picture of your meteor setup.
I’ve been using a mix of BASS and ISIS. I’m gradually moving more to ISIS now as it is highly automated but a steeper learning curve.
If I’m trying to get an accurate corrected spectrum then I’ll crop off the areas I can’t properly correct. However, if I’m just looking and measuring the lines which are in the spectrum then I’ll usually keep the whole spectrum.
Cheers,
Andy
24 August 2015 at 9:20 am #576985Bill WardParticipantHi Andy,
No worries, an assumption on my part that the meaning was understood. This is the start if the process, Then the supressing lines etc etc etc.
It is interesting you say you crop the dodgy stuff, that’s part of the problem with meteors. If you want to get a real feel for what’s going on you can’t! I suppose thats the premise of much of the discussion here.
Maybe I missed it but what software do you use? One of my fellow meteor spectroscopists from Switzerland has been doing some really interetsing stuff with the ISIS package, also by Christian Buil, and orthographic corrections to properly linearise (is that a word?) meteor spectra. I am hoping, if nothing else, that a few people will set up a camera with a grating and stick it out for a year.
If half a dozen people do that then at one fell swoop we’ll have more spectra that at any time in the past. I got 105 meteor spectra in 714 hours of observing and I live in probably the cloudiest and wettest part of the UK. That was two cameras and occasionally a third during showers.
The EDMOND database which I believe both Nemetode and UKMON contribute to, now has 3 MILLION light curves (not orbits as I intially thought). The number of spectra from all the amatuers (Basically me so far in the uk on an ongoing basis as far as I can tell!) and several professional projects across Europe might have produced a few hundred or a thousand spectra. To do any decent statistical work, of course, more would be nice!
I hope you’ll maybe have a go. Any prior experience with spectroscopy makes it even easier and there are programs like RSpec which are quite user friendly. Some of the basic geometric transformations needed are available as little slider bars.
Its easy(ish) 😉 all one needs is a little patience.
Cheers,
Bill.
24 August 2015 at 10:03 am #576987Bill WardParticipantHi Andy,
I hope you have a go sometime. The arrangement for meteor spectroscopy couldn’t really be any simpler. I use an empty filter holder of the appropriate size (so the square transmission gratings fits into the circular aperture) secure it with the mounting ring (sometimes a piece of black card and some tape are needed to make up a holder to ensure a secure fit) then screw the the thing onto the lens.
There are some schools of thought about tilting the grating, since we’re using transmission gratings, to optimise performance in a given order. I don’t think its really worth the extra mechanical akwardness. Mind you I’ve yet to see any spectra from a tilted grating system to do a comparison with, so maybe it is…. Achieving good focus across as wide a range of wavelengths as possible is difficult (this is where tilting the grating might make a difference as well) It’s definitely a trade off between utility and absolute performance. Optical aberations, quality of lens design and the way it’s been corrected come into play as well. Is it worth tilting the grating and all that entails to do it only to have the quality dimished by lens limitations? Defocus in the near UV/Blue is rapid and dramatic in most CCTV lenses as they’re not really designed for astronomical spectroscopy! If they were they’d be made of fused silica/quartz and cost a LOT! (however such lenses are available if you REALLY want to get into it….)
Yes, I’ve been looking at ISIS as well. Some of the results Christian gets are simply remarkable. I had a look at his page recently and theres stuff about detecting startspots. Who’d have thought that amateurs would ever have the tools to do that!
You’re right about the learning curve but I think that’s a consequence of whats he’s trying to do, process a lot of stellar spectra in as automated and efficient a manner as possible. Like most things once you figure it out, it all seems quite straighforward 😉
Personally I think it’s rather wonderful he makes his software available for free!
Anyway, I’m preparing to set off to the International Meteor Conference in Austria and looking forward to it immensely….
cheers,
Bill.
24 August 2015 at 7:43 pm #576988Andy WilsonKeymasterHi Bill,
Yes, it is wonderful that Christian makes his software available for free. Spectroscopy is particularly well catered for in having a number of free good software packages out there. I’m also just learning to use PHD2 for guiding. Another free software package, really easy to use and even allows you to place a rectangle on the screen for spectroscopy so you know where the slit is.
I hope you enjoy the International Meteor Conference.
Andy
9 January 2016 at 4:58 pm #577225Bill WardParticipantStep by step we progress…
I caught a nice bright meteor on the morning of the 8th Jan 2016. However this time it was on one of the medium resolution set ups with the 830g/mm grating. Whilst this gives sub nm/pix dispersion it’s not quite down to my target of 1nm resolution but I’m getting closer and closer! Below is the graph and a colourised version.
The lines are nicely resovled, with the usual suspects present.
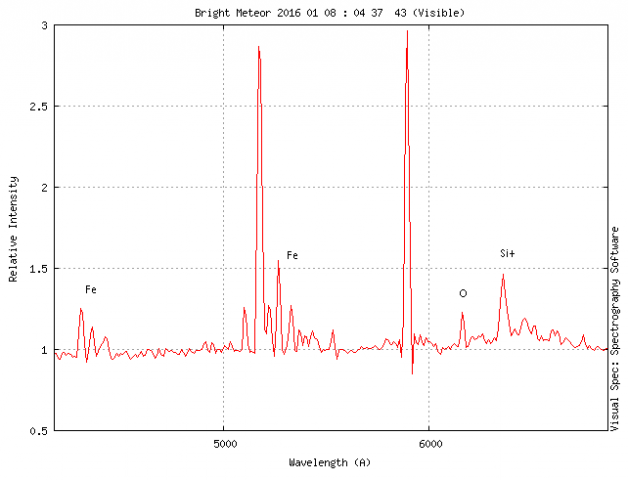

The spectrum did extend up to the near IR but due to it passing through the text at the bottom of the video fov I had to split it to eliminate the artifacts caused by the text. Here’s the IR part. This graphs looks a little more “chunky” than the visible due to the focus. The spectrum is focussed on the visible part and the IR is a little defocused as a consequence.
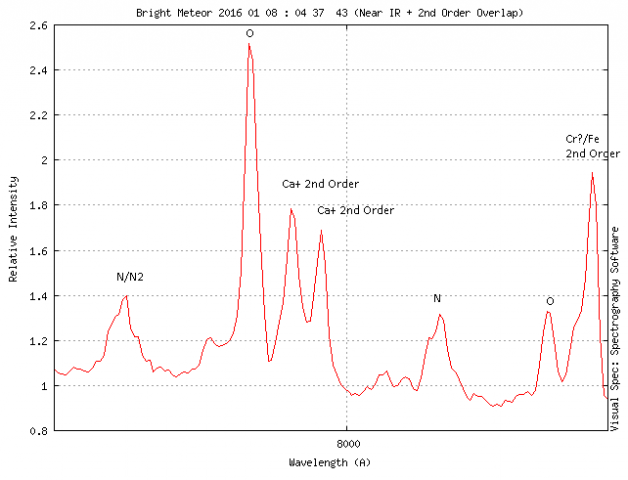
At first it was a bit confusing as to what the “extra” lines were. (The lines have been colourised deep red as they would of course be invisible other wise!) These turned out to be bright lines from the 2nd order overlapping the 1st order. This is a problem with gratings and it only gets worse as ones goes to higher line counts and higher orders. (One benefit from the 2nd order is that the dispersion is twice that of the 1st though.)
By measuring the wavelengths and comparing the differences in these wavelengths its possible to approximate the first order value and hence what the lines are. From the graph it can be seen what I’ve tentatively identified these to be. If one could actually “see” both the near IR and the near UV lines it might look something like this instead…
Cheers,
Bill.
11 January 2016 at 5:54 pm #577227Andy WilsonKeymasterHi Bill,
That is an excellent presentation of your results. You certainly had to do some detective work to find out where the lines came from, but I find that is part of the fun.
I’m not sure if you have any opinion on my post about the possibility of creating a BAA database of spectroscopic observations? Would you be interested in submitting meteor spectra to such a database? I should also run it by John Mason, and other section directors.
Best wishes,
Andy
11 January 2016 at 8:11 pm #577228Bill WardParticipantHi Andy,
Thanks for the comments and yes I read your spectroscopy thoughts. From my persepctive the answer is yes! In fact I’ve already had some communication with William Stewart of the nemetode group about this. Although this was specifically about meteors.
I’m really pleased that several other observers have now set up meteor spectroscopy systems.
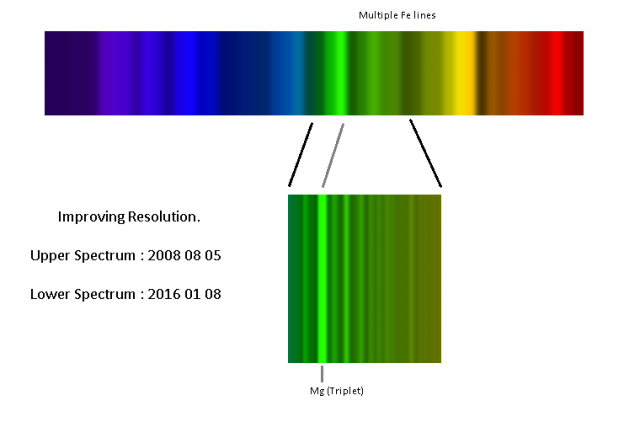
In 7+ years I’m getting close to my target of ~1nm resolution but this has taken continuous upgrades of lenses and gratings as they have become available.
The issue of resolution is important as it dictates what can be done with spectrum. With our low/med resolutions we can look at statistical methods of extracting info but that needs quite a large sample. Hence many more spectrum are needed. This is where a database would be useful but this is also where the various standards of data and reduction processes needs to be addressed. As you say it is also a BIG undertaking and getting the right people might not be easy. It’s quite a commitment to do this sort of thing.
As what I’ve christened “Survey Video Meteor Spectroscopy” is a brand new field it will take a bit more time for the various observers (and I still include myself here as there is lots to do) to find their feet then determine what and where is best to go. I’ve no doubt it’s do-able though!
Cheers,
Bill.
14 January 2016 at 9:14 pm #577229Andy WilsonKeymasterHi Bill,
Thanks for your feedback, which is useful to know. This does sound like it would be a worthwhile endeavour to create a database that covers as wide a range of objects as possible.
It is very interesting to see the improvement in resolution you have made over the years. The detail in your latest spectra are astounding when compared to the early ones.
Cheers,
Andy
16 February 2016 at 3:49 pm #577256Bill WardParticipantHi,
The sky has a never ending supply of surprises! Got two spectra over the night of 14/15 Feb. The first didn’t produce anything useful but the second was quite intriguing…
Took quite a bit of time to get the lines to fit what I think is the correct configuration but part of the problem was that it just didn’t look right. Not very scientific but it is surprising how quickly the brain starts to recognise patterns and this one looked odd.
After doing further geometric corrections to flatten the spectrum as best I could (it had rather a poor dispersion angle at the edge of the fov, never a good combination 😉 ) it twigged what I was seeing.
This particular meteor is VERY sodium deficient. There is much in the literature about sodium deficient meteors but this is only the second time I’s seen no sodium. Unlike the first, further back up the postings, this has other rocky minerals like Si and Mg though. There is a weak line at the Na emission, ~589nm, but this may not be sodium. Many of the small little peaks over the spectrum are processing artifacts from the re-orientation and de-slanting of the spectrum image prior to binning. This is what I term a “noisy spectrum”. However there is definitely no prominent Na line like most of the other spectra I’ve posted here.
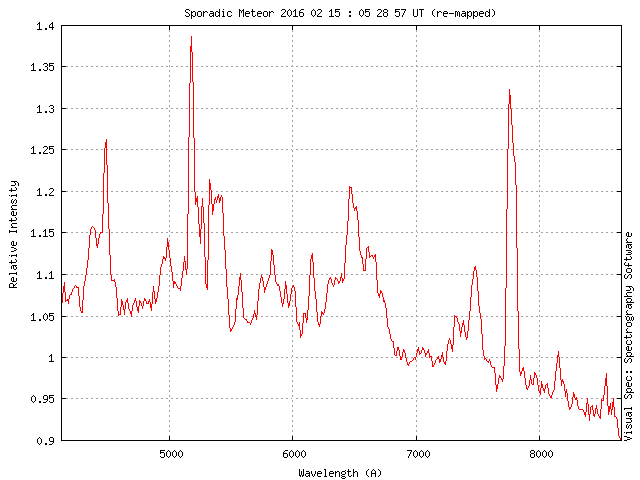
Another interesting result from the meteor spectroscopy survey world…
Thanks to the Nemetode guys there are other observations of this meteor so I’m hoping I’ll be able to get an orbit. William S. did get a Q1 orbit for the other spectrum as there were a couple of other stations that picked it up sadly nothing viable from my end. However if an orbit can be derived for the sodium deficient meteor then that will be an even better result. 🙂
Cheers,
Bill.
17 February 2016 at 7:36 pm #577260Bill WardParticipant…and the orbit is equally interesting…
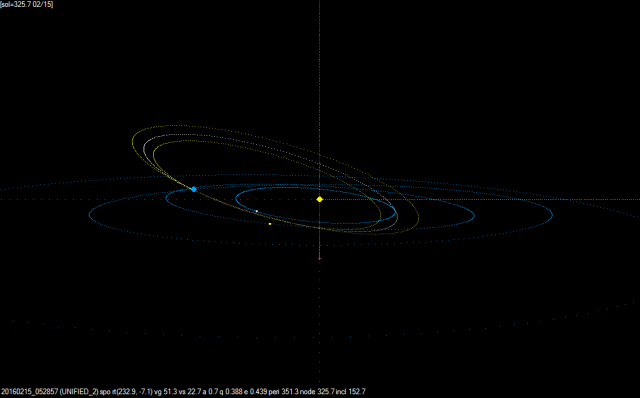
A high inclination making the orbit retrograde. So, the meteoroid hit the Earth in a head on direction resulting in a speedy sporadic.
Thanks to Alex Pratt (of Nemetode) for checking my initial plot and giving it a tweak.
cheers,
Bill.
22 February 2016 at 10:29 am #577261Bill WardParticipantAnother increment in dispersion ~.4nm/pix BUT this is a purely speculative version. That is, I’ve just assumed a couple of lines and knocked up this colourised version for illustration purposes only. I can’t get any lines to fit this no matter what I do!

I’ve circulated the original image to the Nemetode group to see if fresh eyes can help however this is a beautifully dispersed spectrum and at the moment it’s completely unknown.
The wavelengths could also be running in the opposite direction. I’ve tried that too and still no joy. It is VERY frustrating. If any one wants a challenge contact me and I’ll be happy supply the orginal .bmp image produced by UFO capture. It’ll save me tearing any more hair out 😉 !
cheers,
Bill.
PS. Just for the record. I’ve edited this post and reversed the colourisation. IF the meteor ran as thought the wavelengths would run as the new graphic shows. Short wavelength on the left to longer wavelength on the right.
13 April 2016 at 10:41 pm #577314Bill WardParticipantHi,
To try and increase the number of spectra captured I’ve been doing some tests with a zoom lens (3.5mm – 8mm f1) set at around 7mm. The lenses of this type I have are designed for 1/3 inch chips. When operated towards the longer focal length setting, offer full coverage of the Watec 1/2 inch chips. By viewing the screen whilst adjusting the focal length and focus I checked when the image looked just about fully illuminated.
The weather has been lousy of late but I did catch one good spectrum to at least check the system and make some comparisons. This was using a 830g/mm fused silica uv grating. The other longer lines are the spectrum of the compact fluorescent tube light in my kitchen 😉
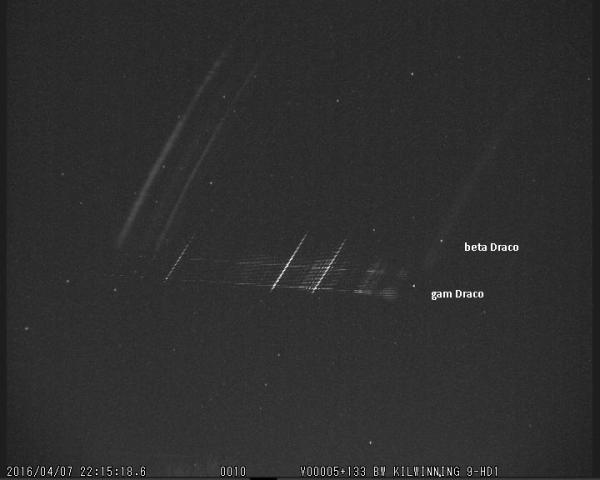
This is the spectrum image with a few stars id’d for magnitude comparisons with a 12mm image.
Looks not too bad. The dispersion is ~1.45nm/pix. Here’e the spectrum…
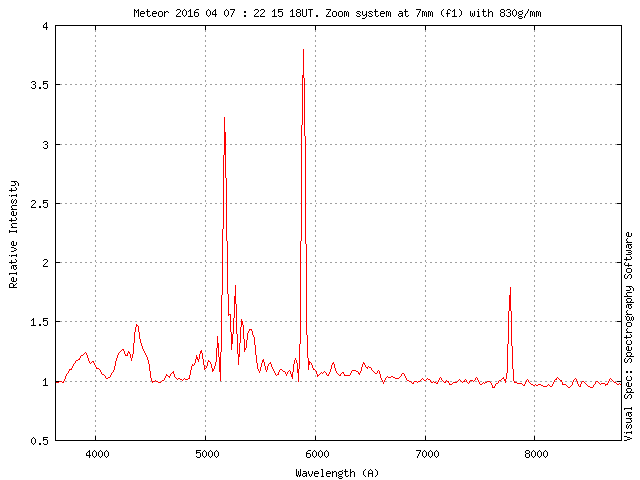
…and the a synthetic colourised version…
Examining the graph, it can be seen that the blue focus is quite poor, that might be tweakable but I’ll need to experiment. However there are a couple of distinct (if broadened) features in the blue. Probably ionised calcium and a sequence of strong Fe lines.
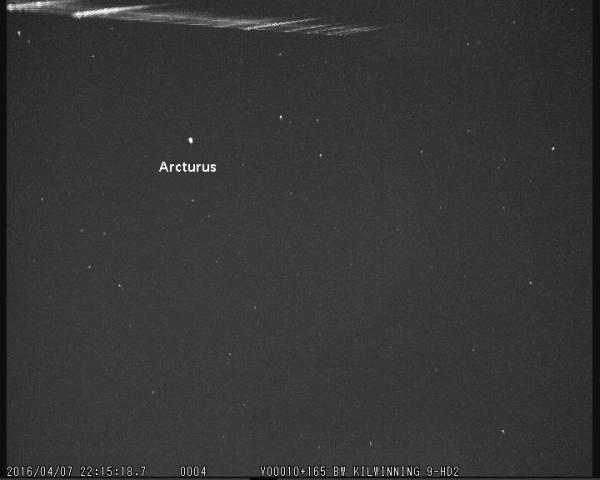
By coincidence I caught the very same meteor with a 12mm f0.8 system. It is strongly foreshortened and there are definite optical disortions right at the edge of the fov but I’ve marked Arcturus for another magnitude reference. My 12mm systems give about 1.2nm/pix dispersion by comparison.
Roughly speaking the wider fov “see’s” about three times the area of sky but still has sufficient aperture to allow a good limiting magnitude for astrometry. I’m quite pleased with this. However the 7mm system is definitley missing the longer IR lines. The cameras are very sensitive to these wavelengths so there might be some vignetting going on. Need some more results to verify this.
I wasn’t sure how a low cost zoom lens would stack up but on the whole I think it’s pretty good. Time will tell…
cheers,
Bill.
4 May 2016 at 11:22 pm #577335Bill WardParticipantHi,
The weather’s been pretty poor here but there were a few breaks over the Lyrid period. I caught a nice spectrum that had, once again, some unusal characteritics. (It’s beginning to look like they’re ALL unusual … 😉 )
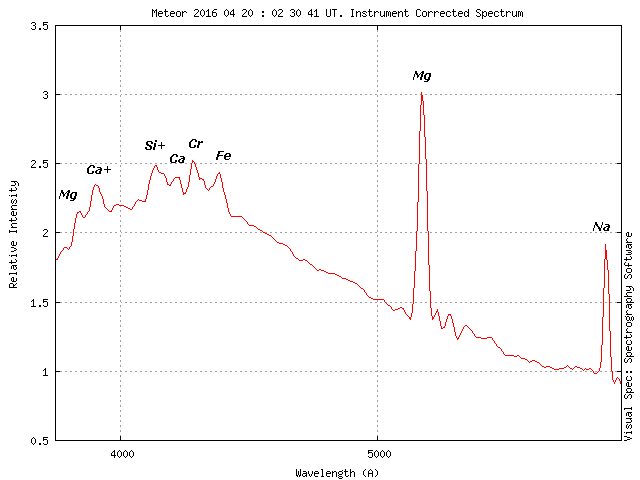
This is an instrument corrected spectrum so the blue end is raised to address the loss of sensitivity at the blue of the silicon sensors. It’s not particularly detailed but it shows relatively “weaker” Fe lines than many of the other spectra captured over the past year. However the Mg line(s) at 517nm is seen to be very strong.
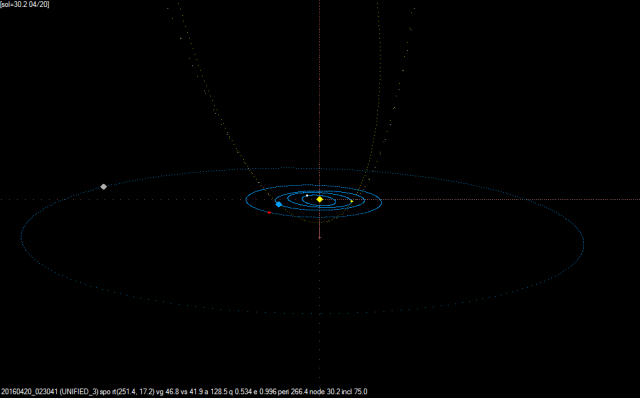
Again, luck was on our side and several of the Nemetoders caputured the same meteor. Alex Pratt ran the observations thorugh the UFO Anaylser and UFO Orbit and this yielded a most unusual orbit. This is by far the most “cometary” sporadic meteor I’ve caught that there’s also an orbit for.
Another outstanding result!.
Cheers,
Bill.
4 May 2016 at 11:54 pm #577337Andy WilsonKeymasterThat’s a great investigation Bill. Fascinating to see the orbit of the meteor to go with the spectrum.
The instrument response correction cannot be easy over a wide field. At high resolution on a star, it is surprisingly straight forward once you’ve done it a few times as it is for a narrow part of the spectrum on a tiny field of view. (Though somehow I’ve managed to get a dodgy response curve tonight, but it is still clear so I can redo it.) It must be quite a challenge for meteor spectroscopy through a wide angle lens across a wide spectral range,
Cheers,
Andy
5 May 2016 at 10:14 pm #577342Bill WardParticipantHi,
Normally I don’t do the correction as theres not that much to be gained data wise at these resolutuions. However this time the size of the Mg line was immense.
I wanted to see if it would still be “higher” than the other metal lines in the blue after correction. Mostly this isn’t the case as a lot of the emissions from the meteors are in the blue but look faint due to the sensitivty issues discussed further back. I just divided the whole spectrum by a Vega spectrum and lo and behold the big Mg line was still the highest peaking line. This meteor may have looked pretty green if it had been seen visually.
cheers,
Bill.
8 June 2016 at 11:08 pm #577413Bill WardParticipantHi,
The remarkable spectrum of post #35 has become even more remarkable after attending a presentation by the meteor spectroscopy expert Jiri Borovicka at the International Meteor Conference in the Netherlands a few days ago. (A wonderful event I can recommend!)
The reason that I couldn’t identify many of the lines is that they are not atomic lines. Atomic lines are the only ones I have in the software databases I use but the lines visible are actually compounds! They are probably mostly emissions from oxides such as aluminum oxide. This makes it an even more unusal meteor.
Good stuff!
cheers,
Bill.
-
AuthorPosts
- You must be logged in to reply to this topic.