› Forums › Variable Stars › Preparing for the next eruption of T CrB
Tagged: T CrB recurrent nova CV
- This topic has 146 replies, 30 voices, and was last updated 1 month, 2 weeks ago by
 Jeremy Shears.
-
AuthorPosts
-
11 May 2026 at 1:23 pm #639332
 Robin LeadbeaterParticipant
Here is the latest “prediction”
https://www.astronomerstelegram.org/?read=17784
Though given it appears to be based on the same premise as Brad Schaefer’s original (failed) prediction, I don’t think will be rushing down to the bookies !Cheers
Robin11 May 2026 at 2:59 pm #639333 Dr Paul LeylandParticipant
They note: “While T CrB clearly appears to be in the final stages before its next nova eruption, our analysis of its historical recurrence pattern suggests a significant scatter of at least 10 years around the mean ∼80-year period. Therefore, while an eruption is anticipated, the existing data do not allow for a precise prediction of its timing”.
Another NR which shows a scatter of about 10% of its mean period is M31N-2008-12a. The period is about one year with variability of about a month. The period so short that several eruptions have been observed.
The sample size is so small, IMO, that it is impossible to say whether this is typical behaviour.
Paul
12 May 2026 at 7:35 am #639335 Mike HarlowParticipant
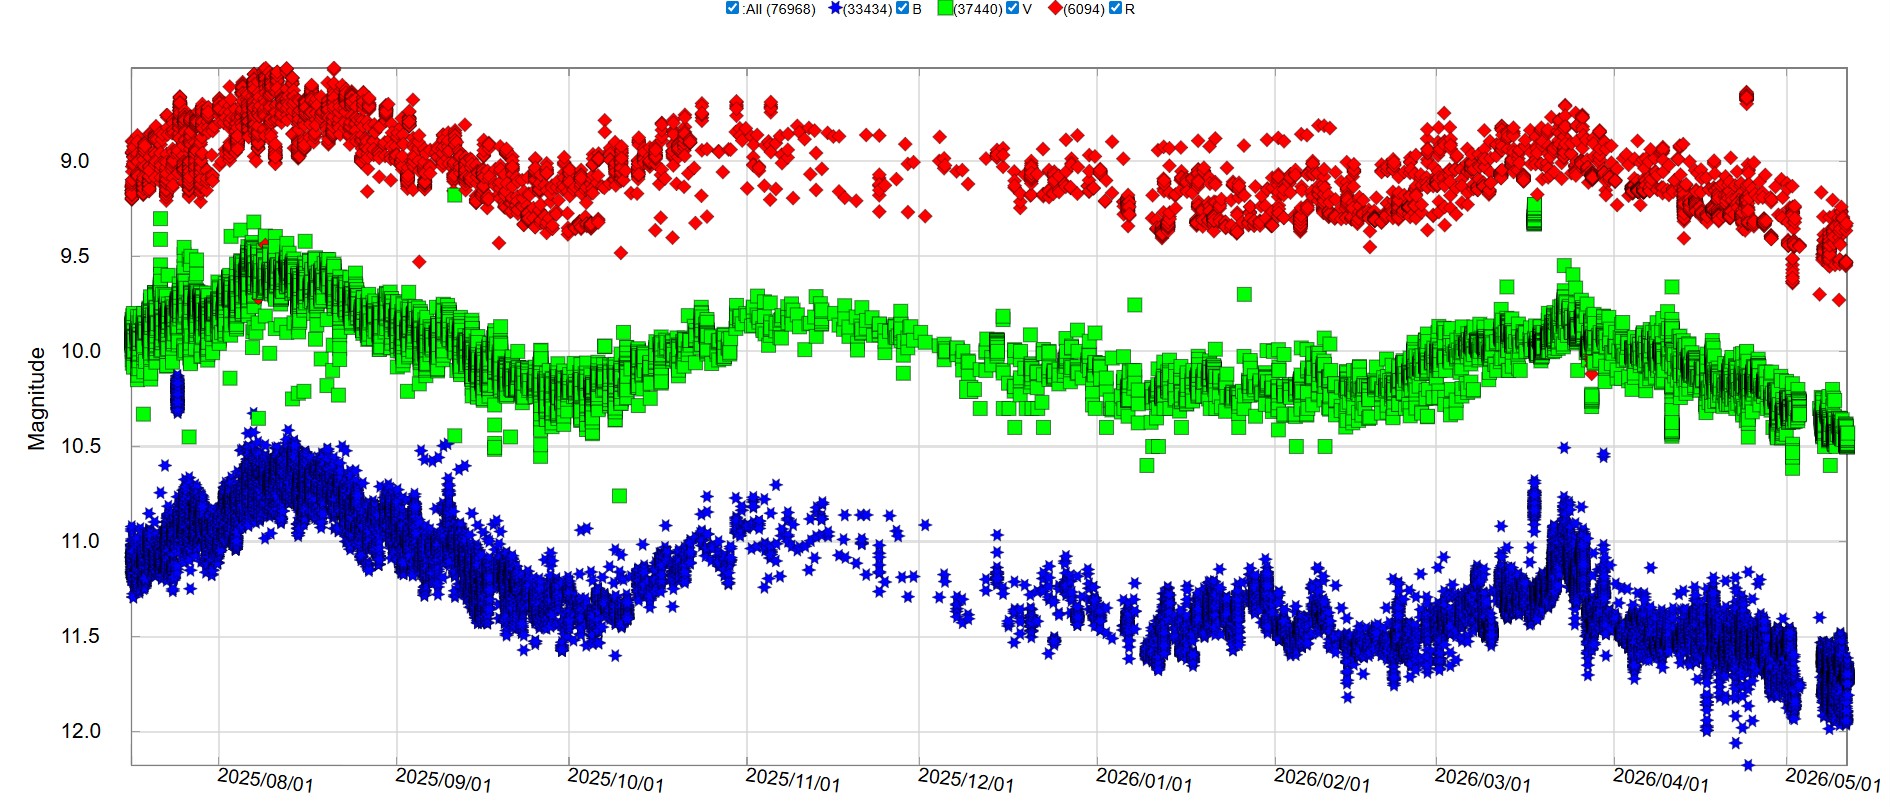
Don’t know if this helps but this is the light curve for the last 300 days taken from the AAVSO ‘Light Curve Generator’: https://www.aavso.org/LCGv2/ .
Any thoughts???
MikeAttachments:
12 May 2026 at 12:00 pm #639337Robin LeadbeaterParticipantIt does shows that predictions based on the kind of spot measurements taken a year apart quoted in the latest aATel are likely to be misleading. The latest minimum in the orbital cycle is deep though. Here is Chris Peterson’s plot on Cloudy Nights which shows it very clearly
https://www.cloudynights.com/forums/topic/932002-blaze-star-t-coronae-borealis-starting-to-blow/page/15/#findComment-14658109Cheers
Robin12 May 2026 at 12:03 pm #639338 Hugh AllenParticipant
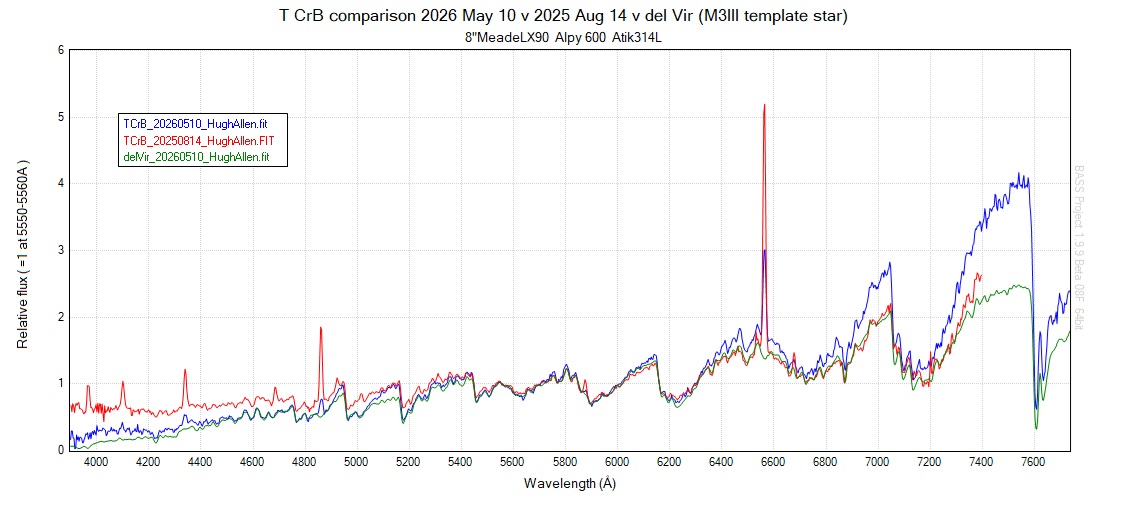
Thanks Mike for preparing this light curve comparison. The spectrum has shown interesting changes too over this date range (see attached comparison 2025 Aug 14 v 2026 May 10). The emission line changes have been much discussed. But in agreement with the light curves you have compiled from AAVSO data, the spectrum seems to have reddened significantly. It now diverges signifcantly from the shape of the spectrum of del Vir which I think is considered a template M3III type star, the spectral type of the red giant in the T CrB system. I wonder too what is occurring?
12 May 2026 at 12:37 pm #639340Robin LeadbeaterParticipantHi Hugh,
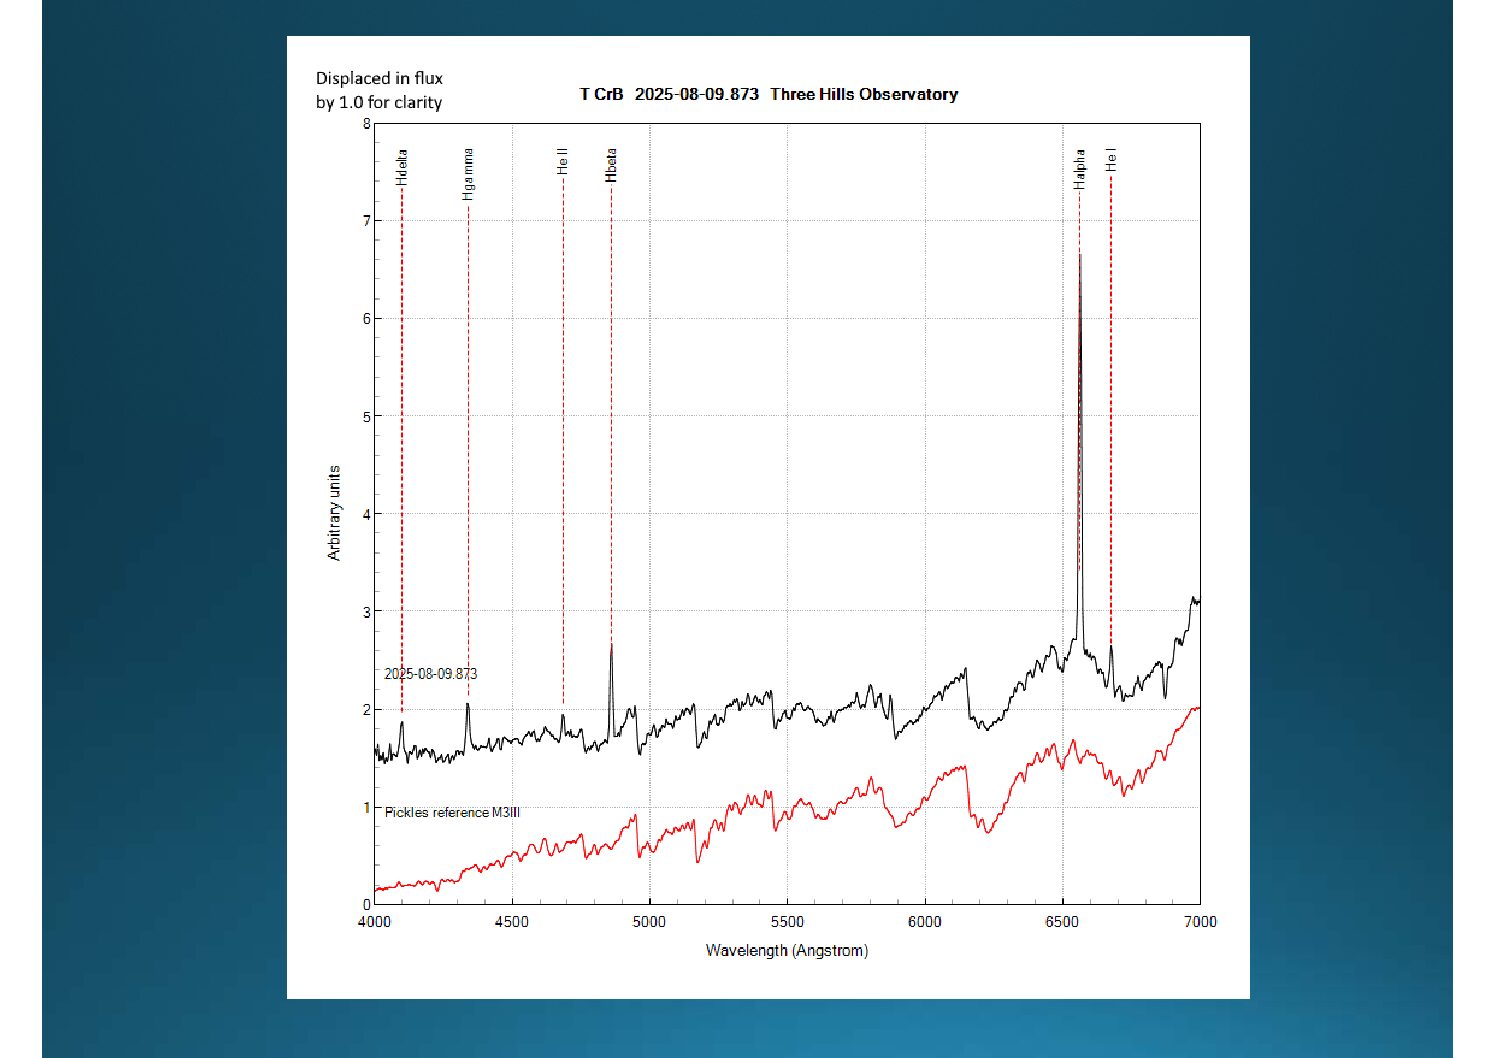
It is complicated by the fact that the hot continuum spectrum of the accreting material is superimposed on the cool star spectrum but I have seen signs that the best fit cool star spectral type once the hot component continuum is removed may vary from M3III in high activity to M4III in low activity based on TiO band depths. See attached slides. (Here I was removing the cool star component to try to see the underlying spectrum of the accreting material)
Cheers
Robin-
This reply was modified 2 months, 2 weeks ago by
 Robin Leadbeater.
Attachments:
17 June 2026 at 3:27 pm #640759 Jeremy ShearsParticipant
An ApJL paper on ArXiv today, ‘Pre-nova Observations of T CrB: A view from the CHARA Array’, reports measurement of the red giant’s pre-eruption diameter as 0.64–0.74 mas.
https://arxiv.org/abs/2606.17272 -
AuthorPosts
- You must be logged in to reply to this topic.