› Forums › Spectroscopy › Request for data
Tagged: Sodium Relative Abundance
- This topic has 13 replies, 4 voices, and was last updated 1 year, 4 months ago by
 Robin Leadbeater.
-
AuthorPosts
-
28 November 2024 at 12:07 pm #626764
 Ken WhightParticipant
Could anyone with a Shelyak LhiresIII or similar please supply me with a 2400 lines/mm fits file of the Solar spectrum in the region of the Sodium D lines collected by reflection off of Jupiter’s moon Europa? No wavelength calibration data is needed provided both lines are present in the same data set. I’m requesting data as unfortunately my data collection days are over.
I have the complete solar spectrum kindly supplied to me at high resolution by Johannes D Clausen, via the RSPEC user group, but collected using a different method i.e. scattered daylight. Whilst this data is practically identical to that which I collected at Halpha there is a difference at Hbeta so I would like Sodium D line data collected via reflection off of Europa as a check on my methodology. If I could also be supplied with Europa Hbeta data (fits file plus calibration) I might be able to chase down the reason for the difference between my data and that supplied by Johannes.
I’m hoping to use the D line data to estimate the relative abundance of Sodium in the solar photosphere.
Ken Whight-
This topic was modified 1 year, 7 months ago by
 Ken Whight.
14 February 2025 at 5:38 pm #628078Ken WhightParticipantI guess the answer is no. No matter, I have been inspired by attending Astrofest and will be modernising my setup which will involve de-forking my Meade 12″ LX200 ACF and swapping it over to a WarpAstron WD-20 harmonic mount. If anyone has de-forked an LX200 I would be interested in any advice/tips.
Ken Whight14 February 2025 at 6:42 pm #628079 Jeremy ShearsParticipant
You might want to start a new thread with your de-forking question, Ken.
There is an old thread here which includes a reference to Martin Mobberley’s JBAA paper (though the link is corrupted):
https://britastro.org/forums/topic/meade-lx200-classic-telscope-
This reply was modified 1 year, 5 months ago by
 Jeremy Shears.
-
This reply was modified 1 year, 5 months ago by Jeremy Shears.
15 February 2025 at 11:49 am #628097 Andy WilsonKeymaster
I suspect part of the issue is this is a very specific request, so there will be at best a handful of BAA members in a position to make the observation. A required spectral resolution rather than a specific spectrograph could open it up to a few more observers. Also, when I was doing spectroscopy with an LHIRES III, I would leave it set at H-alpha, so I could be as efficient as possible at acquiring data by requiring only one setup and calibration set.
We do have a spectrum of Europa in the BAA database, but it is low resolution with an R value of 564.
https://britastro.org/specdb/data_graph.php?obs_id=12734&obs_validated=&obs_observer_id=HAL&r_c=1&f_c=0&o_comment=&plot=PlotA minor point, but it can be helpful to be more specific in the forum post title. So people visiting the website know a bit more about what you are after without opening the post. Hence, Jeremy’s suggestion to make your enquiry about de-forking your Meade 12″ on a new thread.
Best wishes,
Andy-
This reply was modified 1 year, 5 months ago by
 Andy Wilson.
15 February 2025 at 12:46 pm #628100 Robin LeadbeaterParticipant
We do have a spectrum of Europa in the BAA database, but it is low resolution with an R value of 564.
That link actually points to a high resolution solar spectrum by me (taken through a solar filter, not of the sky) though unfortunately although it covers H beta it does not cover Na D
Cheers
Robin15 February 2025 at 1:10 pm #628106Andy WilsonKeymasterThat link actually points to a high resolution solar spectrum by me (taken through a solar filter, not of the sky) though unfortunately although it covers H beta it does not cover Na D
Cheers
RobinThank you for pointing out my mistake Robin, now corrected.
I had been checking what solar spectra we had in the BAA database, as well as Europa, and I copied the wrong link.
Cheers,
Andy-
This reply was modified 1 year, 5 months ago by Andy Wilson.
-
This reply was modified 1 year, 5 months ago by Andy Wilson.
-
This reply was modified 1 year, 5 months ago by Andy Wilson.
15 February 2025 at 3:15 pm #628113Ken WhightParticipantJeremy, Andy, Robin, Thanks for your comments. I will go ahead and revive my setup but I’m not the best of experimentalists so if anybody could provide me with a high res Hbeta spectrum (raw fits file + calibration fits file) it would be a good check on my abilities! As I said in my original post, I have some data supplied to me (scattered daylight) which is practically identical to my data at Halpha but there is a discrepency at Hbeta (min intensity ~ 0.2 compared to my value of ~ 0.35) which I would like to resolve. In my analysis method I need an accurate zero which I obtain by subtracting, from my raw europa spectrum, a neighbouring strip off the fits file. I’ve no idea how a zero level is determined in the scattered daylight method, is the intensity so great that it just overwhelms any zero error?
My ultimate aim is to test my expression for thermal equilibrium photon capture cross-sections (equation 6.32 in my theory document on my website http://www.thewhightstuff.co.uk) which applies generally to any element (hence the interest in Na D lines). I still do not know if this a previously known equation or even correct.
Regards
Ken15 February 2025 at 3:44 pm #628123Andy WilsonKeymasterHi Ken,
I expect you have already done this, but I thought I would mention it just in case. Where there is an unexpected difference in the intensity between two lines, my first thought is to check the response correction. Not just whether you have good confidence in your own spectrum, but also the one you were supplied with. I imagine the response correction would have to be obtained at night by a observing a star, with the spectrograph in the same configuration as the daytime solar spectrum.
Sorry I am not able to provide a spectrum.
Best wishes,
Andy24 February 2025 at 3:59 pm #628376Ken WhightParticipantHi Andy,
Sorry for the delay in replying but we’ve been on grandparent half-term duties and four 3 to 7 years old’s don’t leave you with much spare time or energy!
I (think I) only have to compare the depth of absorption to the local continuum level and so don’t need to worry about response correction. I do however need to have a good i.e. not too noisy, continuum level and an accurate dark level the latter of which I obtain by subtracting the signal from a neighbouring stripe of sky. At Hbeta my normalised continuum level noise is about 0.05 so not too bad.
While I work on restoring my data gathering abiltiy I plan to predict the depth of absorption expected for the Sodium D lines over a range of (hydrogen) relative concentrations.
Regards
Ken24 February 2025 at 5:17 pm #628380Robin LeadbeaterParticipantthere is a discrepency at Hbeta (min intensity ~ 0.2 compared to my value of ~ 0.35) which I would like to resolve.
Ken,
My measurement originally posted by Andy confirms your value of ~0.35 minimum for H beta as measured at R~18000
https://britastro.org/specdb/data_graph.php?obs_id=9871Cheers
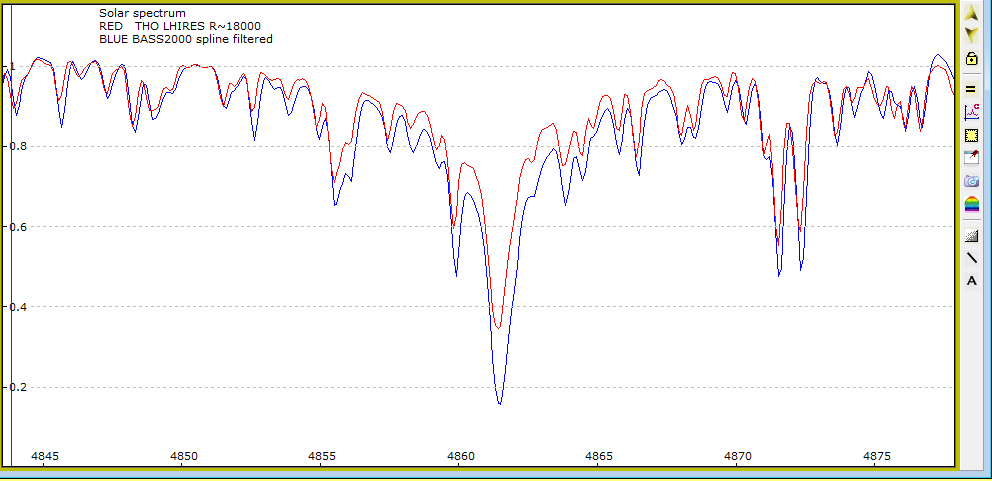
Robin24 February 2025 at 5:28 pm #628381Robin LeadbeaterParticipantThe very high resolution BASS2000 solar spectrum however has a minimum of ~0.15 at H beta
https://bass2000.obspm.fr/solar_spect.php
Not sure where the discrepancy arises but the minimum will be somewhat resolution dependent if the line is not fully resolved. EW would be a better measure of intensityCheers
Robin24 February 2025 at 6:10 pm #628382Robin LeadbeaterParticipantNot sure where the discrepancy arises but the minimum will be somewhat resolution dependent if the line is not fully resolved.
OK so the difference between my measurement and the BASS2000 spectrum is not just due to a difference in resolution. See attached comparison where the BASS2000 spectrum has been spline filtered to ~ match the resolution in my spectrum. The discrepancy is still there and looks to be due to a zero offset so I need to check back on how I did the background subtraction.
Attachments:
24 February 2025 at 8:33 pm #628389Ken WhightParticipantHi Robin,
Thanks for your supporting data, I’ve attached my Ha & Hb spectra for comparison. My data looks to have a bit more noise but I think my background subtraction could be improved. As I remember I just subtracted the raw background stripe, it would possibly have been better if I had smoothed the background first.
Regards
Ken24 February 2025 at 9:06 pm #628393Robin LeadbeaterParticipantKen,
Dark, bias flat and sky background subtraction (based on an interpolation using regions above and below the spectrum) is normally all handled by the spectrum reduction program
Cheers
Robin -
This topic was modified 1 year, 7 months ago by
-
AuthorPosts
- You must be logged in to reply to this topic.