Forum Replies Created
-
AuthorPosts
-
 John CoffinParticipant
Last night’s specrum of Pi Andromeda (HD 00369) was still about 3 A out at H alpha but very accurate from H beta to epsilon.
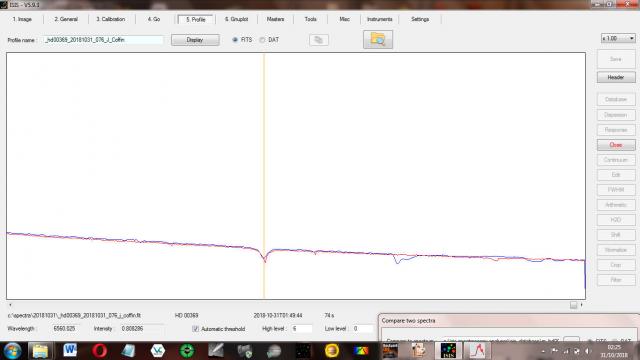
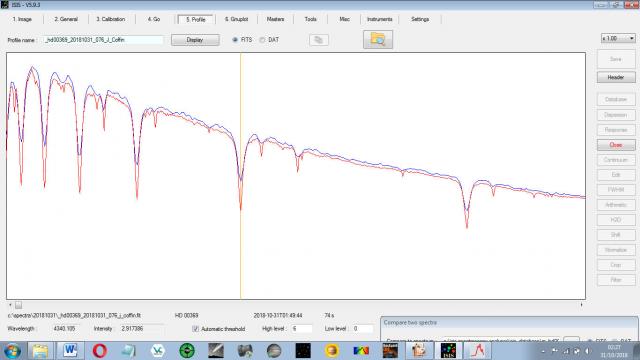
If this is an error due to undersampling why would it only affect H alpha?
If undersampling is the issue, can I calibrate the dispersion of a spectrum collected binned x 2 using a reference star that was not binned?
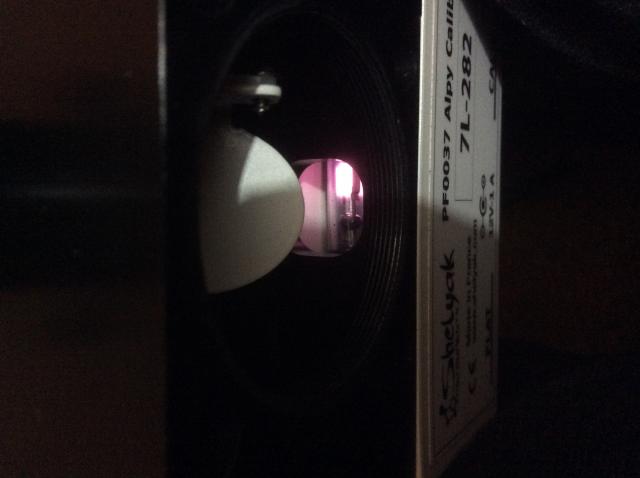
John CoffinParticipantThe reflector isn’t perfectly straight and the bulb emits light from one side of itself.
 John CoffinParticipant
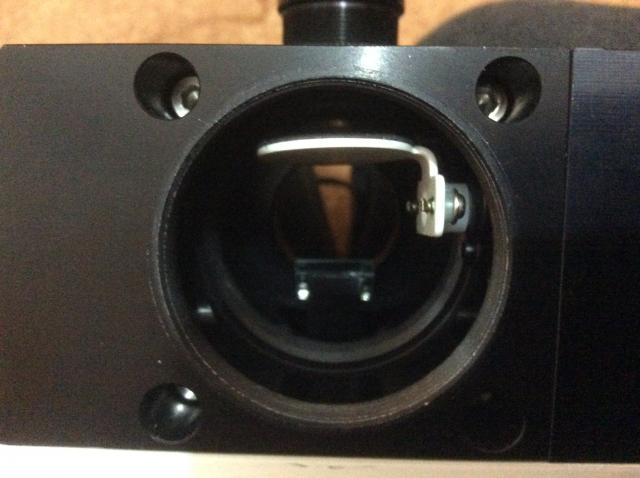
I took these lamp lines indoors. The one I took last night was saturated towards the red end of the spectrum and gave me a similar result and were taken at the end of the evening after the calibration star. The ambient temperature was 2 C last night. Next time I will take some in the middle of the target exposures, and again with the reference star and see if that makes any difference.
John CoffinParticipantDear Robin, all the Balmer lines were blue shifted by about 2 A, though H zeta and H epsilon were shifted by 3 and 2.5 A respectively.
I’ll check all the connectors, though I thought they were tight really.
Here’s the report
Load the image : c:spectra20181028zeta_draconis-1.fit
Load the image : c:spectra20181028zeta_draconis-2.fit
Load the image : c:spectra20181028zeta_draconis-3.fit
Load the image : c:spectra20181028zeta_draconis-4.fit
Load the image : c:spectra20181028zeta_draconis-5.fit
Load the image : c:spectra20181028zeta_draconis-6.fit
Substract the offset : c:spectra20181028caliboffset.fit
Substract the dark : c:spectra20181028calibdark600_b2_minus10-.fit
Dark coefficient (1) : 0.0333
Dark coefficient (2) : 0.0333
Dark coefficient (3) : 0.0333
Dark coefficient (4) : 0.0333
Dark coefficient (5) : 0.0333
Dark coefficient (6) : 0.0333
Divide by the flat-field : c:spectra20181028flat.fit
Flat-field level : 38096
Cosmetic correction : c:spectra20181028calibcosme.lst
Smile correction – Y0 = 658 Radius = 11056
Transverse registration at intermediate Y coordinate = 533.00
Spectrum Y coordinate Y 1 = 533.31
Spectrum Y coordinate Y 2 = 533.47
Spectrum Y coordinate Y 3 = 533.53
Spectrum Y coordinate Y 4 = 533.73
Spectrum Y coordinate Y 5 = 533.76
Spectrum Y coordinate Y 6 = 533.58
Remove sky background
Save image : c:spectra20181028@s.fit (sky not removed)
Save 0b product : c:spectra20181028_Zeta Dra.fit (2D image)
Adopted Y coordinate : 532.51
Tilt correction (second pass)
Remove sky background (second pass)
Write 2D image : c:spectra20181028@1.fit
Write 2D image : c:spectra20181028@2.fit
Write 2D image : c:spectra20181028@3.fit
Write 2D image : c:spectra20181028@4.fit
Write 2D image : c:spectra20181028@5.fit
Write 2D image : c:spectra20181028@6.fit
Optimal binning
Write raw profile : c:spectra20181028@raw1.dat
Write raw profile : c:spectra20181028@raw2.dat
Write raw profile : c:spectra20181028@raw3.dat
Write raw profile : c:spectra20181028@raw4.dat
Write raw profile : c:spectra20181028@raw5.dat
Write raw profile : c:spectra20181028@raw6.dat
Intensity of individual profiles (ADU)…
Mean (median) for profile #1 : 278613 (48845)
Mean (median) for profile #2 : 267945 (46851)
Mean (median) for profile #3 : 274931 (46238)
Mean (median) for profile #4 : 283742 (47380)
Mean (median) for profile #5 : 261979 (48189)
Mean (median) for profile #6 : 248222 (44512)
Standard summation of individual profiles
Save uncalibrated spectral profile : c:spectra20181028@star.dat
Processing of calibration image : c:spectra20181028neon5.fit
Dark coefficient (calibration) : 0.0083
Save image : c:spectra20181028@calib.fit (2D image)
Save spectral profile : c:spectra20181028@calib.dat
Spectral calibration
————————————————————————–
Primary dispersion :
Coefficient a4 : -1.941613E-13
Coefficient a3 : 5.199794E-09
Coefficient a2 : -4.783460E-05
Coefficient a1 : 0.39175
Coefficient a0 : -710.014
————————————————————————–
RMS : 0.091500 (en pixels)
————————————————————————–
Primary wavelength fit deviation
point #1 Lambda = 3770.630 px = 326.562 dx = -0.067
point #2 Lambda = 3797.300 px = 332.190 dx = 0.154
point #3 Lambda = 3835.390 px = 340.215 dx = -0.078
point #4 Lambda = 3889.050 px = 351.495 dx = -0.013
point #5 Lambda = 3970.080 px = 368.476 dx = 0.043
point #6 Lambda = 4101.750 px = 395.954 dx = -0.049
point #7 Lambda = 4340.480 px = 445.487 dx = -0.017
point #8 Lambda = 4861.340 px = 552.926 dx = 0.039
point #9 Lambda = 6562.850 px = 910.356 dx = -0.070
point #10 Lambda = 6869.000 px = 976.968 dx = 0.067
point #11 Lambda = 7605.000 px = 1140.339 dx = -0.009
————————————————————————–
Inverse dispersion equation
Coefficient a4 : 2.999117E-10
Coefficient a3 : -1.336891E-06
Coefficient a2 : 1.632851E-03
Coefficient a1 : 4.09469
Coefficient a0 : 2135.790
————————————————————————–
RMS : 0.311249 (in angstroms)
————————————————————————–
Wavelength fit deviation
point #1 x = 397.713 lambda = 3945.982 dlambda = 0.118
point #2 x = 441.652 lambda = 4158.959 dlambda = -0.369
point #3 x = 513.877 lambda = 4510.640 dlambda = 0.090
point #4 x = 520.824 lambda = 4544.520 dlambda = 0.530
point #5 x = 544.099 lambda = 4658.045 dlambda = -0.145
point #6 x = 565.974 lambda = 4764.726 dlambda = 0.144
point #7 x = 607.204 lambda = 4965.603 dlambda = -0.523
point #8 x = 696.858 lambda = 5400.458 dlambda = 0.102
point #9 x = 791.067 lambda = 5852.415 dlambda = 0.075
point #10 x = 878.731 lambda = 6266.457 dlambda = 0.033
point #11 x = 930.316 lambda = 6506.578 dlambda = -0.048
point #12 x = 1071.150 lambda = 7147.069 dlambda = -0.029
point #13 x = 1124.583 lambda = 7383.958 dlambda = 0.022
————————————————————————–
Coefficient a4 : 2.999117E-10
Coefficient a3 : -1.336891E-06
Coefficient a2 : 1.632851E-03
Coefficient a1 : 4.09469
Coefficient a0 : 2135.790
————————————————————————–
RMS : 0.311249
————————————————————————–
—————————————————————————-
Normalization spectral range : [6650 – 6750]
Normalization value (final profile) : 42355639.7
Normalization value (individulal profile #1) : 7359979.4
Normalization value (individulal profile #2) : 7024372.2
Normalization value (individulal profile #3) : 7031455.9
Normalization value (individulal profile #4) : 7078341.5
Normalization value (individulal profile #5) : 7177964.8
Normalization value (individulal profile #6) : 6683525.9
—————————————————————————-
Spectrum #1 ( b ) – ( v ) intensity = ( 0.836 ) – ( 0.996 )
Spectrum #2 ( b ) – ( v ) intensity = ( 0.860 ) – ( 0.994 )
Spectrum #3 ( b ) – ( v ) intensity = ( 0.910 ) – ( 0.997 )
Spectrum #4 ( b ) – ( v ) intensity = ( 0.948 ) – ( 0.998 )
Spectrum #5 ( b ) – ( v ) intensity = ( 0.784 ) – ( 0.996 )
Spectrum #6 ( b ) – ( v ) intensity = ( 0.796 ) – ( 0.997 )
( b ) – ( v ) mean intensity = ( 0.856 ) – ( 0.996 )
( b ) – ( v ) median intensity = ( 0.860 ) – ( 0.997 )
—————————————————————————-
Write individual DAT processed profile : c:spectra20181028@pro1.dat
Write individual DAT processed profile : c:spectra20181028@pro2.dat
Write individual DAT processed profile : c:spectra20181028@pro3.dat
Write individual DAT processed profile : c:spectra20181028@pro4.dat
Write individual DAT processed profile : c:spectra20181028@pro5.dat
Write individual DAT processed profile : c:spectra20181028@pro6.dat
Write individual FITS processed profile : c:spectra20181028@pro1.fit
Write individual FITS processed profile : c:spectra20181028@pro2.fit
Write individual FITS processed profile : c:spectra20181028@pro3.fit
Write individual FITS processed profile : c:spectra20181028@pro4.fit
Write individual FITS processed profile : c:spectra20181028@pro5.fit
Write individual FITS processed profile : c:spectra20181028@pro6.fit
—————————————————————————-
Write final profile : c:spectra20181028_zetadra_20181028_970_J_Coffin.fit
Write final profile : c:spectra20181028_zetadra_20181028_970_J_Coffin.dat
Intermediate files removed
—————————————————————————-
Acquisition starting date : 28/10/2018 23:16:27
Duration : 42.0 secondes
Mid-exposure date : 28.970/10/2018
Mid-exposure Julian day : 2458420.4700
Resolution power : 507.6
Ok.
John CoffinParticipantHere is the text of the ISIS report after pressing the Go button on the calibration assistant.
Extract spectral profile…
Input image : c:spectra20181028mean.fit
Y-coordinate of binning zone : 532
Binning zone width : 27
Sauve the rectified image : c:spectra20181028@.fit
Save the profile : c:spectra20181028@.dat (uncalibrated spectra)
Ok.
——————————————
Extract spectral profile…
Input image : c:spectra20181028neon5.fit
Y-coordinate of binning zone : 532
Binning zone width : 27
Sauve the rectified image : c:spectra20181028@@.fit
Save the profile : c:spectra20181028@@@@.dat (uncalibrated spectra)
Ok.
————————————————————————–
Lines search zone
| -5 | 373 | 3 |
| -5 | 384 | 3 |
| -5 | 401 | 3 |
| -4 | 428 | 4 |
| -5 | 478 | 3 |
| -3 | 584 | 5 |
| -5 | 790 | 7 |
| -5 | 809 | 7 |
| -6 | 878 | 6 |
| -5 | 929 | 7 |
| -6 | 1070 | 6 |
| -8 | 1124 | 6 |
| -10 | 1202 | 4 |
Gaussian fit on : +/-5 pixels
————————————————————————–
Reciprocical inverse dispersion equation
Coefficient a4 : 2.039047E-10
Coefficient a3 : -1.032328E-06
Coefficient a2 : 1.289598E-03
Coefficient a1 : 4.25183
Coefficient a0 : 2113.351
————————————————————————–
Fitting deviation (wavelength)
point #1 x = 373.309 lambda = 3835.394 dlambda = -0.004
point #2 x = 384.441 lambda = 3889.156 dlambda = -0.106
point #3 x = 401.092 lambda = 3969.698 dlambda = 0.382
point #4 x = 428.333 lambda = 4101.743 dlambda = 0.007
point #5 x = 477.589 lambda = 4341.144 dlambda = -0.664
point #6 x = 584.329 lambda = 4860.809 dlambda = 0.531
point #7 x = 790.079 lambda = 5852.713 dlambda = -0.223
point #8 x = 809.454 lambda = 5944.744 dlambda = 0.086
point #9 x = 877.733 lambda = 6266.474 dlambda = 0.016
point #10 x = 929.332 lambda = 6506.631 dlambda = -0.101
point #11 x = 1070.153 lambda = 7147.050 dlambda = -0.010
point #12 x = 1123.593 lambda = 7383.774 dlambda = 0.176
point #13 x = 1201.871 lambda = 7723.850 dlambda = -0.090
————————————————————————–
RMS : 0.351305 (in angstroms)
————————————————————————–
Ok.
Here is the report from the Go page.
Load the image : c:spectra20181028zeta_draconis-1.fit
Load the image : c:spectra20181028zeta_draconis-2.fit
Load the image : c:spectra20181028zeta_draconis-3.fit
Load the image : c:spectra20181028zeta_draconis-4.fit
Load the image : c:spectra20181028zeta_draconis-5.fit
Load the image : c:spectra20181028zeta_draconis-6.fit
Substract the offset : c:spectra20181028caliboffset.fit
Substract the dark : c:spectra20181028calibdark600_b2_minus10-.fit
Dark coefficient (1) : 0.0333
Dark coefficient (2) : 0.0333
Dark coefficient (3) : 0.0333
Dark coefficient (4) : 0.0333
Dark coefficient (5) : 0.0333
Dark coefficient (6) : 0.0333
Divide by the flat-field : c:spectra20181028flat.fit
Flat-field level : 38002
Cosmetic correction : c:spectra20181028calibcosme.lst
Smile correction – Y0 = 658 Radius = 11056
Transverse registration at intermediate Y coordinate = 532.00
Spectrum Y coordinate Y 1 = 533.31
Spectrum Y coordinate Y 2 = 533.47
Spectrum Y coordinate Y 3 = 533.53
Spectrum Y coordinate Y 4 = 533.73
Spectrum Y coordinate Y 5 = 533.76
Spectrum Y coordinate Y 6 = 533.58
Remove sky background
Save image : c:spectra20181028@s.fit (sky not removed)
Save 0b product : c:spectra20181028_Zeta Dra.fit (2D image)
Adopted Y coordinate : 531.51
Tilt correction (second pass)
Remove sky background (second pass)
Write 2D image : c:spectra20181028@1.fit
Write 2D image : c:spectra20181028@2.fit
Write 2D image : c:spectra20181028@3.fit
Write 2D image : c:spectra20181028@4.fit
Write 2D image : c:spectra20181028@5.fit
Write 2D image : c:spectra20181028@6.fit
Optimal binning
Write raw profile : c:spectra20181028@raw1.dat
Write raw profile : c:spectra20181028@raw2.dat
Write raw profile : c:spectra20181028@raw3.dat
Write raw profile : c:spectra20181028@raw4.dat
Write raw profile : c:spectra20181028@raw5.dat
Write raw profile : c:spectra20181028@raw6.dat
Intensity of individual profiles (ADU)…
Mean (median) for profile #1 : 277922 (48733)
Mean (median) for profile #2 : 267284 (46730)
Mean (median) for profile #3 : 274253 (46119)
Mean (median) for profile #4 : 283042 (47260)
Mean (median) for profile #5 : 261331 (48022)
Mean (median) for profile #6 : 247607 (44406)
Standard summation of individual profiles
Save uncalibrated spectral profile : c:spectra20181028@star.dat
Processing of calibration image : c:spectra20181028neon5.fit
Dark coefficient (calibration) : 0.0083
Save image : c:spectra20181028@calib.fit (2D image)
Save spectral profile : c:spectra20181028@calib.dat
Spectral calibration
Computed A0 parameter : 2113.160 (actual polynom A0 = 2113.351)
Predefined dispersion polynom :
Coefficient a4 : 2.039047E-10
Coefficient a3 : -1.032328E-06
Coefficient a2 : 1.289598E-03
Coefficient a1 : 4.25183
Coefficient a0 : 2113.351
—————————————————————————-
Normalization spectral range : [6650 – 6750]
Normalization value (final profile) : 42238320.9
Normalization value (individulal profile #1) : 7339427.7
Normalization value (individulal profile #2) : 7005366.1
Normalization value (individulal profile #3) : 7012000.4
Normalization value (individulal profile #4) : 7058567.1
Normalization value (individulal profile #5) : 7157459.9
Normalization value (individulal profile #6) : 6665499.8
—————————————————————————-
Spectrum #1 ( b ) – ( v ) intensity = ( 0.839 ) – ( 0.996 )
Spectrum #2 ( b ) – ( v ) intensity = ( 0.862 ) – ( 0.994 )
Spectrum #3 ( b ) – ( v ) intensity = ( 0.913 ) – ( 0.997 )
Spectrum #4 ( b ) – ( v ) intensity = ( 0.951 ) – ( 0.998 )
Spectrum #5 ( b ) – ( v ) intensity = ( 0.786 ) – ( 0.996 )
Spectrum #6 ( b ) – ( v ) intensity = ( 0.798 ) – ( 0.997 )
( b ) – ( v ) mean intensity = ( 0.858 ) – ( 0.996 )
( b ) – ( v ) median intensity = ( 0.862 ) – ( 0.997 )
—————————————————————————-
Write individual DAT processed profile : c:spectra20181028@pro1.dat
Write individual DAT processed profile : c:spectra20181028@pro2.dat
Write individual DAT processed profile : c:spectra20181028@pro3.dat
Write individual DAT processed profile : c:spectra20181028@pro4.dat
Write individual DAT processed profile : c:spectra20181028@pro5.dat
Write individual DAT processed profile : c:spectra20181028@pro6.dat
Write individual FITS processed profile : c:spectra20181028@pro1.fit
Write individual FITS processed profile : c:spectra20181028@pro2.fit
Write individual FITS processed profile : c:spectra20181028@pro3.fit
Write individual FITS processed profile : c:spectra20181028@pro4.fit
Write individual FITS processed profile : c:spectra20181028@pro5.fit
Write individual FITS processed profile : c:spectra20181028@pro6.fit
—————————————————————————-
Write final profile : c:spectra20181028_zetadra_20181028_970_J_Coffin.fit
Write final profile : c:spectra20181028_zetadra_20181028_970_J_Coffin.dat
Intermediate files removed
—————————————————————————-
Acquisition starting date : 28/10/2018 23:16:27
Duration : 42.0 secondes
Mid-exposure date : 28.970/10/2018
Mid-exposure Julian day : 2458420.4700
Resolution power : 521.5
Ok.
John CoffinParticipantThanks for your helpful advice. The chart relating error to altitude was very useful Robin. For other readers this is the final link to it.
http://www.astronomie-amateur.fr/Documents%20Spectro/Ref_013.pdf
I must try and find my targets before they get too low in the sky!
John CoffinParticipantI would be interested in tackling some test targets. More help with ISIS would be useful and also the advanced processing too. I can get ISIS to work but I nearly always hit a problem that takes a lot of effort to overcome.
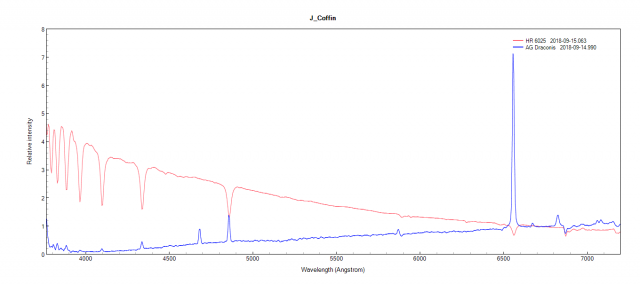
John CoffinParticipantDear Robin, your method worked. Thanks a lot. The calibration is shifted to the blue by about 1.5 A, so I guess the lesson to learn here is for me to get my spectrum straight and try again. Here are my first spectra with this set up.
 John CoffinParticipant
i was surprised that ISIS doesn’t recalculate the X position if the spectrum is rotated. I knew the spectrum was not horizontal, it was my first one with the new camera, but assumed that when ISIS measured the tilt it would make the necessary corrections. Thanks again, I am babysitting today but will try your sugestions tomorrow.
John CoffinParticipantDear Robin, I hope you were up observing and not just working on my problem. I am most grateful for your help and will follow your advice.
Many thanks, John
John CoffinParticipantThanks, am emailing you two zip files now. John
John CoffinParticipantDear Robin, I tried checking that the smile correction is working but unfortunately I couldn’t get a result. I am obviously not doing it properly. I will look at your lamp image.
John CoffinParticipanti calibrated the same star in RSpec using a third order polynomial and with an RMS of 0.6539, just by using the Balmer lines. I’d really rather be able to use ISIS as it is so much more powerful and does all the stacking etc.
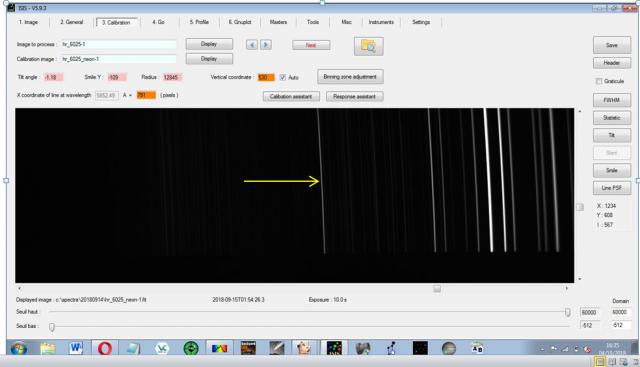
John CoffinParticipantThanks for your suggestion. The best calibration I can get with the method you suggested gives an RMS of 19.976 Angstroms. I hope I am using the correct neon line (marked below with an arrow). I have even updated the version of ISIS to the latest one. I have also tried adjusting the pixel scale by increments of 0.02, but no luck.
 John CoffinParticipant
Forgive me, I’m new to the BAA. I will do as Andy suggests. John.
John CoffinParticipantI didn’t notice this request for spectroscopic monitiring of this object in the spectroscopy section.
John CoffinParticipantThank you both for your very helpful comments and for the trouble you have taken to produce your data. I will experiment to see how much I can cool the camera. I didn’t realise that ‘warm pixels‘ can still collect useful information and that is reassuring.
John CoffinParticipantThanks, that makes sense. The DSLR will probably need changing for a CCD when I tackle fainter targets and funds become available. John.
John CoffinParticipantWhy are there emission lines for Fe but not C, N, and O which must be present in the star before iron can be formed? If the iron is dredged up from the star’s core wouldn’t C, N and O be dredged up too? The ionisation potential for Fe is similar to the other metals. Surely it can’t be just centrifugal force that brings the Fe to the surface and into the circum-stellar disc in preference to the lighter elements?
John CoffinParticipantThanks. I should have looked at Walker’s atlas. I have the PDF version.
-
AuthorPosts