Forum Replies Created
-
AuthorPosts
-
 John CoffinParticipant
Hi Robin, What exposure time did you need to capture the spectrum of the tail and what scope and camera did you use?
Thanks
John
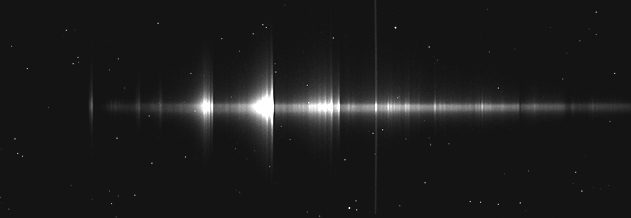
John CoffinParticipantHi, I live on the Essex marshes with views almost to the horizon, so managed to get a spectrum of the coma of this comet on Tuesday am. Didn’t try for the tail. The Swan Bands are stunningly beautiful (to a spectroscopist). The image is the raw unprocessed spectrum.
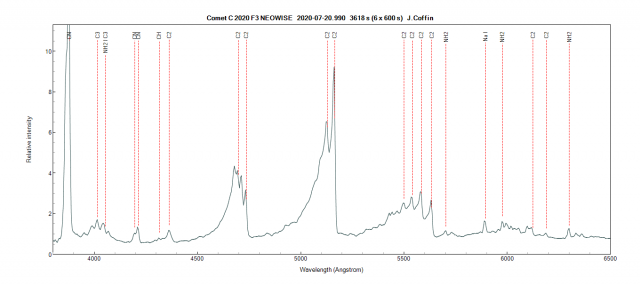
This is an annotated plot of the spectrum, the relative intensity of the emission lines is not reliable because the instrument response was calibrated using Merak which was at an altitude of 20 deg but the comet was at only 10 deg. Neither the sky background or the solar spectrum was subtracted when processing the spectrum. The emission lines were labelled according to data in Richard Walker’s Spectral Atlas and on the following website http://web.gps.caltech.edu/~mbrown/comet/all.txt
The full size images are attached.
Robin can advise on whether the annotations are reasonable. John.
John CoffinParticipantThanks for sharing that. Can you add any links to the radio image?
John CoffinParticipantDear Hugh, I read that you work in alt-az mode to avoid the effects of atmospheric dispersion. I’d be interested to know how you do this. I have an AZ-EQ6 Mount but haven’t tried the AZ mode. I normally guide on a different star to the target. Does field rotation interfere with your guiding? Do you have more difficulty synchronising your telescope to your planetarium software? I’ve been put off trying AZ mode because I had heard that it’s “go to“ function was not so accurate.
John CoffinParticipantThank you Andy, that’s very helpful. John.
John CoffinParticipantAnother idea would be to put an agreed key word or phrase in posts about spectroscopy campaigns so that they were searchable, and also a way of ordering search results by date. An alternative, though maybe messy idea, would be to have a forum just for campaigns. Thanks everyone for all the ideas, maybe it’s something to discuss at the forthcoming spectroscopy workshops.
John CoffinParticipantDoes scintillation shift the wavelength of spectra? What would be a reasonable minimum exposure time to avoid problems due to scintillation?
John CoffinParticipantThat’s helpful, thanks, John
John CoffinParticipantNice spectra. I tried to collect a spectrum of 38P/Stephan-Oterma last week. The spectrum of the nucleus was basically a straight line and the coma indistinguishable from the sky background spectrum from a part of the sky a few degrees away, (total exposure 4200 secs). On reflection I think I was a bit optimistic, the nucleus is mag 14.5 and the total mag is 10. I wondered if a a short focal length telescope is better for spectra of faint comets. What magnitude does a comet need to reach before it’s reasonable to expect to capture a spectrum with amateur equipment?
John CoffinParticipantDear Jack, there is a guide to processing hot pixels (bad pixels in PHD2) here https://openphdguiding.org/man-dev/Darks_BadPixel_Maps.htm
I hope that is what you are looking for.
Best wishes, John
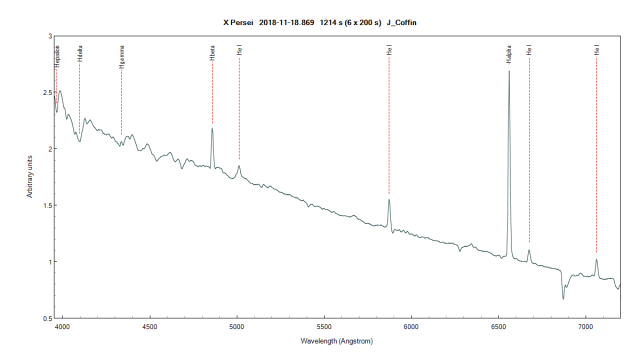
John CoffinParticipantHere is one from the 18th November with an Alpy.
What changes are we looking for, and how often should we monitor with low resolution spectra?
John CoffinParticipantI’ve used PHD2. I don’t guide on the target star but on a different one. I then adjust the lock position to move the target star onto the slit. Seems to work well.
There is a step by step guide on how to do this here. https://github.com/OpenPHDGuiding/phd2/wiki/PHD2-Guiding-for-Spectroscopy
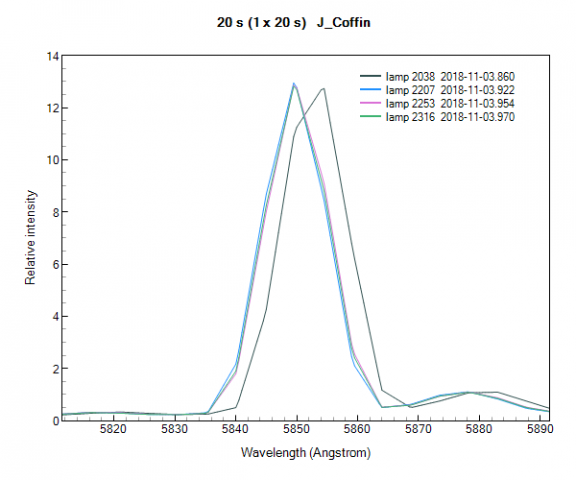
John CoffinParticipantI took your advice and compared the lamp images from the evening where I had calibration problems. There was a shift of minus 3 A between the first and second lamp image. The meridian flip was between the first and second images. Thereafter the lamp image shifted plus 0.4 A and stayed there.
I thought I had checked everything was tightened, but today I’ve discovered the two Allen head bolts holding the slit in place had worked loose. No idea how!
I don’t think this explains everything though. The star spectra have a different amount of shift at different wavelengths, while the lamp spectra have the same shift all the way along. I can only think that the different light paths of the lamp and the stars are at the root of the problem as you have been saying.
 John CoffinParticipant
The best fit for Z And was when the only frame taken after the meridian flip was used, and it was calibrated using the mixed Balmer and lamp method. The Balmer lines were found from Pi And (also taken after the flip).
The lamp was the one taken for Z And, after the flip. No heliocentric or corrections for radial velocity were made.
The errors were
H alpha -0.4
H beta +0.65
H gamma +1.2
H delta +1.0
H epsilon -1.0
When the same frame was calibrated using its lamp lines only and not the Balmer lines from Pi And
Errors are:
H alpha -0.4
H beta -1.45
H gamma -1.8
H delta -2.5
H epsilon -3.5
So for me it seems the mixed method gave the best results
John CoffinParticipantI’ll do as you say. Thanks.
John
John CoffinParticipantDear fellow Alpy users, please see my post #41
Everything In my Alpy is screwed down tight as far as I can tell. Yet I am getting these large disparities in the calibration of H alpha.
It suggests something does change when the instrument moves from one star to another, i thought of checking the Relco bulb isn’t loose, presumably the grism is unlikely to move as it’s held in place by a spring.
The best calibration using the lamp lines occurred when there was a meridian flip between the target and the acquisition of the lamp lines.
John CoffinParticipantMethod
Spectra of Zeta Cas and Z And were collected, the latter was exposed for 240s to avoid saturating the H alpha emission line and then a further set of exposures for 600s were taken in order to show more detail in the continuum and other emission lines. Towards the end of the series taken for 600s the telescope reached the meridian and the lamp image for that set was not taken until after the meridian flip. On the other occasions the lamp image was taken immediately after the end of a capture sequence.
Results
The spectra were processed in ISIS in three different ways.
Balmer lines only
This couldn’t calibrate Zeta Cas so was not suitable for Z And either
Mixed Balmer and lamp lines calibration
Each time the lamp lines for the particular target were used.
Zeta Cas H alpha blue shift 1 A, accurate from H beta onwards towards the UV end.
Z And (600s) H alpha red shift 2 A, gradually increasing so at H delta the red shift was 3.4 A.
Z And (240s) H alpha blue shift 6 A, reducing so at H delta the blue shift was 4.0 A.
In all targets using the mixed method the wavelength errors become more shifted towards the red at shorter wavelengths.
Lamp lines only calibration
Zeta Cas H alpha blue shift 1 A, increasing so at H delta the blue shift was 4.5 A.
Z And (600s) H alpha red shift 0.7, accurate calibration from H beta to H delta. H epsilon was blue shifted by 1.5 A.
Z And (240s) H alpha blue shift 6.0 A, increasing so that at H delta the blue shift was 7.7 A.
So in all the targets calibrated by the lamp lines alone, the wavelength error shifts towards the blue at shorter wavelengths.
I will be very interested to see the result of your Filly Dot experiment. I may have to throw away my calibration module. (I’ll keep it for the flat fields actually).
Cheers, John
John CoffinParticipantThanks for all your advice. Much appreciated!
John
John CoffinParticipantNo, I didn’t tick that box. Here is the new improved lamp spectrum which looks accurate. I noticed that the intensity of the lines that ISIS uses for calibration are much weaker than those above 7000 A. Perhaps I should not worry about saturating those brighter lines and try using a longer exposure in order to make the ones used by ISIS brighter.
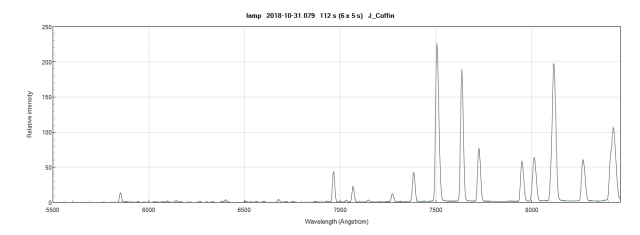
What do you think is the way forward now? I was hoping to submit spectra to our database. Should I put a comment in the FITs header about the calibration method and its (?) inherent problems, ie mixed method with accuracy upto H beta, 3A blueshift near H alpha.
What would be the best way to calibrate now? Would it depend on the nature of the target?
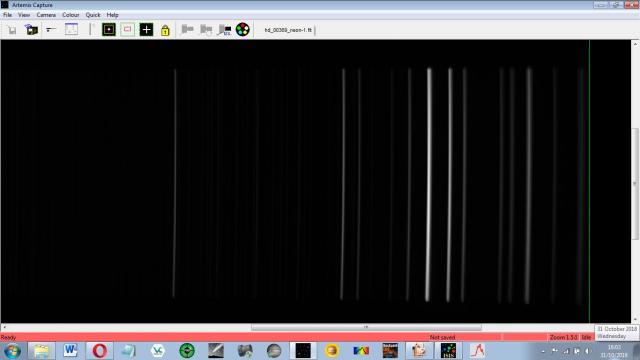
John CoffinParticipantHi Andrew, I’ve processed the calibration image as is if were a star, of course I had to use the same image to calibrate it. The result was odd, but the neon 6965 line was incorrectly calibrated.
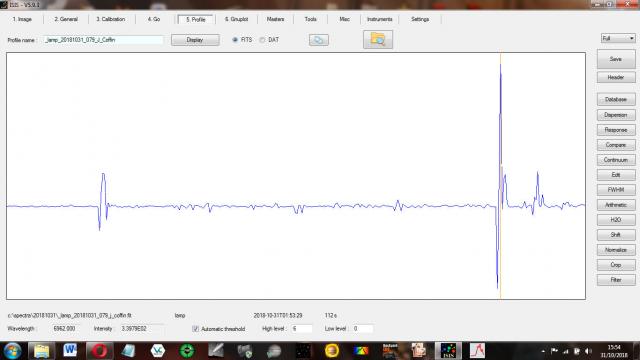
The lines are broad and fuzzy in this area, so perhaps I need to focus it better there?
I understand that if I do this I will lose definition at the blue end of the spectrum. Thank you for your thoughts on this issue. I am very grateful for everyone’s input into this.
I’ve attached the files of these images.
Regards, John
-
AuthorPosts