Forum Replies Created
-
AuthorPosts
-
 Robin LeadbeaterParticipant
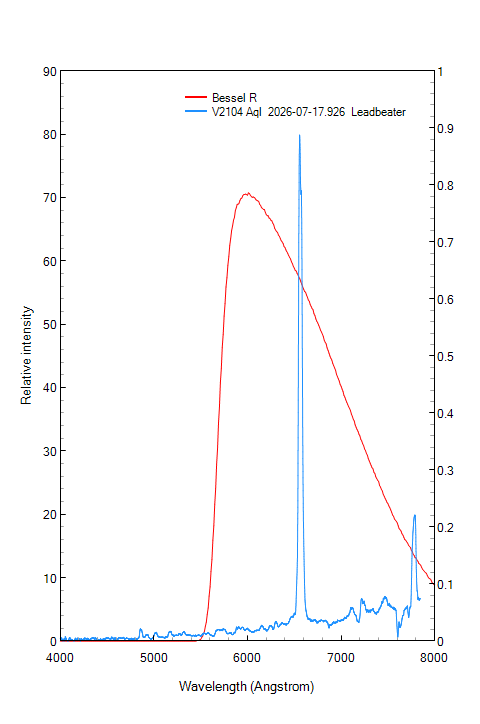
My Sloan photometry shows that it is currently getting redder as it fades. I assume that this is due to the current dominant H-alpha emission.
I don’t have the Sloan passbands in a digitised form to hand but H alpha emission currently accounts for approximately 40% of the flux in the Bessell R passband
EDIT: About 50% in Sloan r’
Cheers
Robin-
This reply was modified 16 hours, 32 minutes ago by
 Robin Leadbeater.
Attachments:
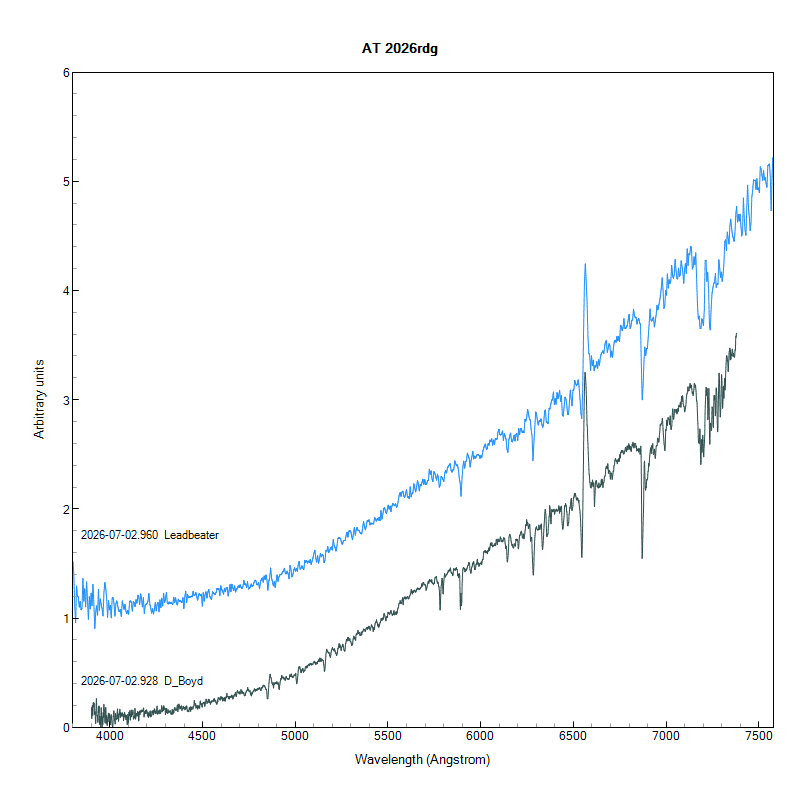
Robin LeadbeaterParticipantSpectra by me and David Boyd last night (in the BAA database)
Cheers
RobinAttachments:
Robin LeadbeaterParticipantThe nice thing with the individual measurements (both in photometry and spectroscopy) is you can use them to make a true estimate of the stochastic uncertainty (though not any systematic errors)
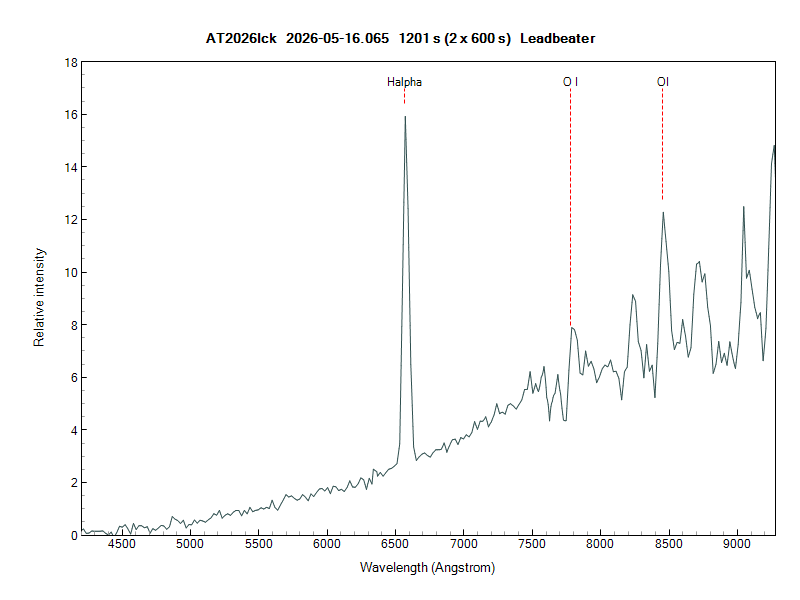
Robin LeadbeaterParticipantA quick spectrum last night with the very low resolution ALPY200 to cover the IR, though it would be bright enough to record spectra at higher resolution particularly for observers with IR capability. Lots of IS extinction and strong H alpha and other emission lines into the IR
https://britastro.org/specdb/data_graph.php?obs_id=20943Cheers
RobinAttachments:
Robin LeadbeaterParticipantHi Hugh,
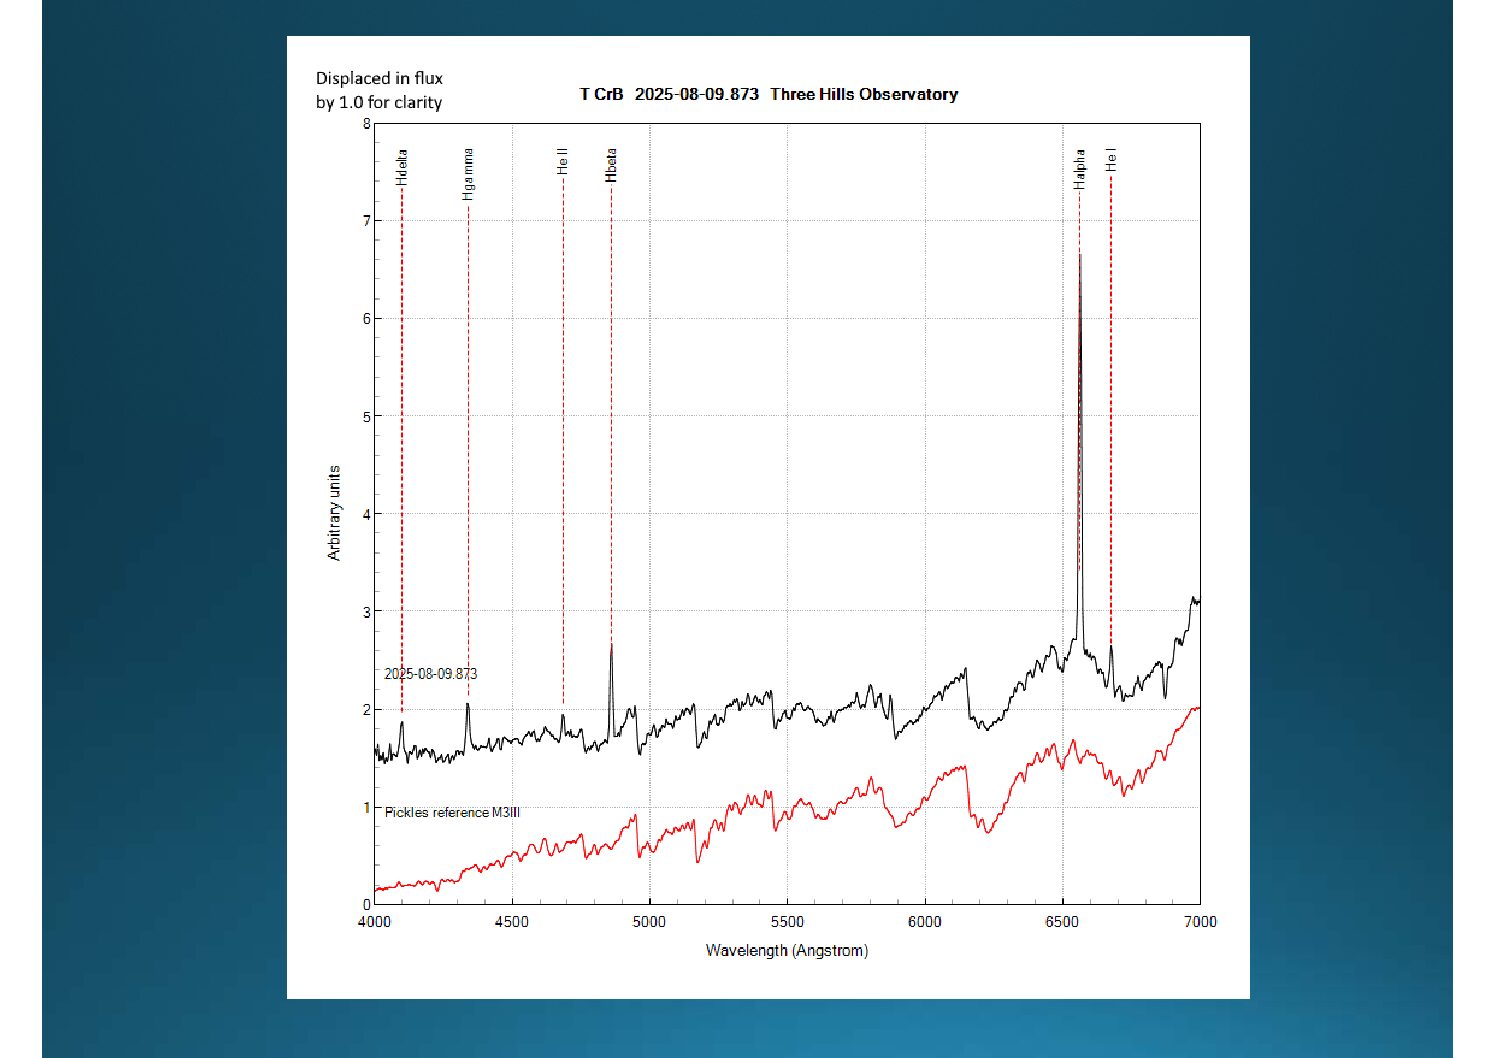
It is complicated by the fact that the hot continuum spectrum of the accreting material is superimposed on the cool star spectrum but I have seen signs that the best fit cool star spectral type once the hot component continuum is removed may vary from M3III in high activity to M4III in low activity based on TiO band depths. See attached slides. (Here I was removing the cool star component to try to see the underlying spectrum of the accreting material)
Cheers
Robin-
This reply was modified 2 months, 1 week ago by Robin Leadbeater.
Attachments:
Robin LeadbeaterParticipantIt does shows that predictions based on the kind of spot measurements taken a year apart quoted in the latest aATel are likely to be misleading. The latest minimum in the orbital cycle is deep though. Here is Chris Peterson’s plot on Cloudy Nights which shows it very clearly
https://www.cloudynights.com/forums/topic/932002-blaze-star-t-coronae-borealis-starting-to-blow/page/15/#findComment-14658109Cheers
RobinRobin LeadbeaterParticipantHere is the latest “prediction”
https://www.astronomerstelegram.org/?read=17784
Though given it appears to be based on the same premise as Brad Schaefer’s original (failed) prediction, I don’t think will be rushing down to the bookies !Cheers
RobinRobin LeadbeaterParticipantJohn Graham AKA Airship on Cloudy Nights has also been following T CrB with Seestar(s) for some years. His latest data here shows a trend to low brightness currently but does not seem to show increased scatter
https://www.cloudynights.com/forums/topic/932002-blaze-star-t-coronae-borealis-starting-to-blow/page/14/#findComment-14640801Cheers
Robin-
This reply was modified 2 months, 1 week ago by Robin Leadbeater.
Robin LeadbeaterParticipantA 45 degree (erecting) diagonal perhaps ? Is there any sign that there was a prism in there ? Not sure why though unless it added some needed optical length for some reason.
Cheers
RobinRobin LeadbeaterParticipantThat is already a very whittled down list, those that look like supernovae. The filtered tip of a very big iceberg of 800,000 alerts issued for the night of 24th Feb, set to grow by an order of magnitude once it gets up to full speed
https://www.universetoday.com/articles/get-ready-for-the-rubin-observatorys-deluge-of-discoveries
Supernovae beyond ~0.05-0.1 redshift are currently too faint for amateur spectrographs though and most of these in the list will even be beyond the professionals.-
This reply was modified 4 months, 2 weeks ago by Robin Leadbeater.
-
This reply was modified 4 months, 2 weeks ago by Robin Leadbeater.
Robin LeadbeaterParticipantLondon busses (340kW)
That’s quite a difference from the Flanders and Swan conversion factor (1 bus = 97HP). We are in trouble if fundamental units like this are found to change with time. Is there a theory to explain this ?
Robin LeadbeaterParticipantI remember making something similar to this about 20 years ago using a video camera viewfinder (a tiny Cathode ray tube)
http://www.threehillsobservatory.co.uk/astro/UC15_viewfinder.htm
to use on the scope with my long exposure modified video camera
http://www.threehillsobservatory.co.uk/astro/1004xcam1.htmWhen you compare with what you get with smart scopes these days and the cost of displays like in VR headsets for example it does seem rather expensive though. If they are popular enough, I can imagine someone undercutting them substantially.
6 February 2026 at 12:36 am in reply to: Why do only Type 1a supernovae have Silicon absorption lines in their spectra? #634509Robin LeadbeaterParticipantWith a core collapse type II supernova the core remains, compressed into a neutron star and the visible spectrum results from the heating of the outer layers of the star, mainly hydrogen, hence the strong Balmer lines.
I guess that still leaves though the question as to why 1c, core collapse SNe where the H and He envelope has already been stripped away, do not show strong Si II lines. This review paper though does suggest it perhaps is seen weakly in 1c spectra (fig2)
https://arxiv.org/abs/1908.02476-
This reply was modified 5 months, 1 week ago by Robin Leadbeater. Reason: typo
4 February 2026 at 9:10 pm in reply to: Why do only Type 1a supernovae have Silicon absorption lines in their spectra? #634458Robin LeadbeaterParticipantVery “hand waving” but as I understand it, it is because of the difference in the mechanism. With a core collapse type II supernova the core remains, compressed into a neutron star and the visible spectrum results from the heating of the outer layers of the star, mainly hydrogen, hence the strong Balmer lines. With a type Ia, the white dwarf is completely consumed by the thermonuclear explosion resulting from the increase in pressure just prior to the impending total collapse, converting all the material into heavier elements including silicon, the Si II (and Calcium) lines showing strongly in the visible part of the spectrum.
Robin LeadbeaterParticipantThanks chaps,
I now have both apps running and the original green wavy app did not alert whereas the newly installed green spiral one briefly amber alerted last night so I will swap to that one.
Cheers
RobinRobin LeadbeaterParticipantHi Alex,
Yes all conditions set up ok, though I’ve just discovered from the Lancaster Uni Aurora Watch website there are two (both third party) Android apps using the Lancaster data, titled AuroraWatch UK and Aurora Watch UK. I was using the former which has the same (green wavy) logo that Lancaster use on their website but I see on the internet page for that app they acknowledge that there is a problem with a google play limit on how many free alerts they can send out which I guess they quickly exceed these days with the increased interest. I have now downloaded the app with the space in the title (which has a green spiral logo) so hopefully perhaps that is more reliable. Is that the one you have ?
Cheers
RobinRobin LeadbeaterParticipantIt’s maddening listening to my phone pinging ‘red alerts’ for the past two days
What alert service are people using ? I have traditionally used Lancaster Uni’s Aurorawatch app but it never seems to send alerts these days
Thanks
RobinRobin LeadbeaterParticipantCorrect spelling please 😉 (2019 Merlin Medal)
Robin LeadbeaterParticipantMy first goto, the Vixen skysensor 2000 happily did this and (tracked any other object) regardless of mount alignment. It came as a shock when I found this was not universally true !
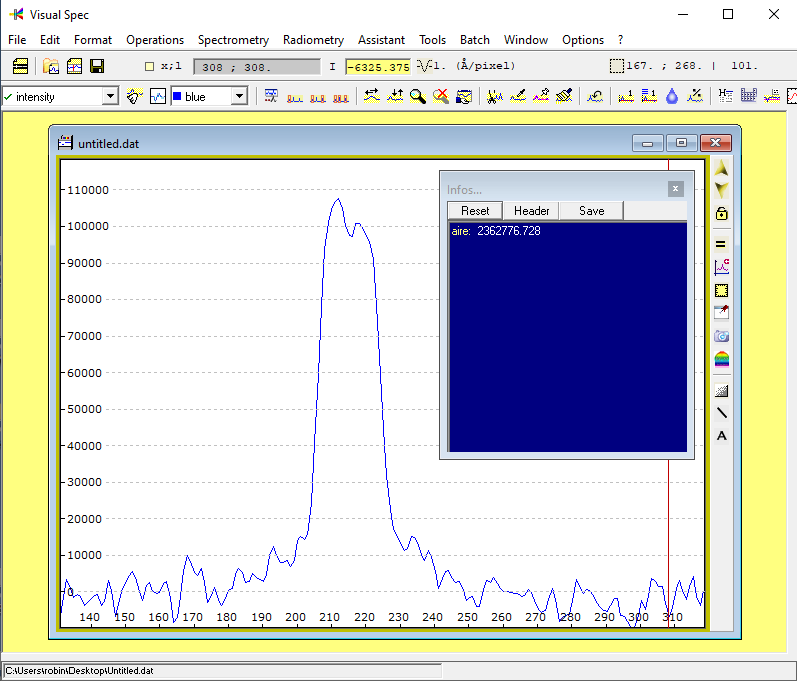
Robin LeadbeaterParticipantProfile with the background subtracted using a spline fit and the integrated count
Attachments:
-
This reply was modified 16 hours, 32 minutes ago by
-
AuthorPosts