Forum Replies Created
-
AuthorPosts
-
 Robin LeadbeaterParticipant
That does look rather like pincushion distortion
https://en.wikipedia.org/wiki/Distortion_(optics)#Radial_distortion
(In stellar spectra, atmospheric refraction can also bend the spectrum but this cannot be the cause here)
Lens distortions will also distort the spectrum along the dispersion direction as well as bending the spectrum. The DSLR lens is probably better in this respect than the CCTV lens. What does the image look like without the grating eg eg does the roof line look curved as you move from top to bottom of the frame ?
If the lens is distorting the image significantly that will make precise calibration difficult. Once defined you could correct the distortion first in software first which should straighten everything out and linearise the dispersion. I don’t have any direct experience of handling this with meteors and wide angle lenses though. Perhaps Bill Ward has come across it and has some ideas on how to deal with it ?
Cheers
Robin
Robin LeadbeaterParticipantHi Derek,
>I have a suspicion that I’m going to get slightly different dispersion distances for n = +1 and n = -1, possibly because of the grating, being plastic, it’s not completely flat but is curving. Depending on where the dot occurs, if it’s on a part that’s more curved, relative to the opposite side of the zero order image, we might get discrepancies there.
That would be really strange, I think. The light from the laser dot on the distant object illuminates the full grating (just like a star illuminates the full aperture if the telescope.) The grating then produces a number of beams at different angles according to the spectrum order, which are then brought to focus by the lens. Distortions in the grating could blur the spectrum because the effective line spacing varies across the grating but I don’t understand how it could affect the +- orders differently. If you are seeing different dispersions in +- orders I suspect It would be more likely to be due to aberrations in the lens (eg barrel/pincushion type distortions for example.
Cheers
Robin
Robin LeadbeaterParticipantHi Derek
>But I think once done and I have a value of the number of pixels the green LASER is dispersed in the first order diffraction, as long as the equipment stays the same, lens, focal length, grating, do you think the calibration will no longer be necessary ? Oh, I think I need to follow up with Robin’s comments on distance. I will need to do some exposures with various objects at different distances painted with the LASER. Robin, do you think it’s important to know the actual distances? A problem I have is, I don’t know the distances – they are just roof tops, aerials etc. Is there a way to work out their distances?
I can’t add much I am afraid as expected the dispersion to be a constant of the setup so the effect of the distance to the source came as a surprise to me ! Perhaps it only becomes significant as the focal length of the lens becomes a significant fraction of the distance. I think I would start with something close, a couple of metres away say compared with a few tens of metres to get a feel for the magnitude of the effect.
Cheers
Robin
Robin LeadbeaterParticipantYes in that case impressively close !
I have to confess the idea of using the superimposed lamp lines came from Christian Buil,the objective being to solve the issue of shifts due mechanical flexure in the LHIRES.
http://www.astrosurf.com/buil/isis/He_calibration/method.htm
about half way down (In French)
Those particular “Filly” lamps are not around any more but you would only need one reference line to correct the offset in the dispersion equation measured using the internal LHIRES lamp as you did using the water line so chances are even a neon lamp would do. The intensity of the lamp line(s) has to be adjusted to match the exposure needed for the star (not a problem in this case with bright Deneb) eg by adding some filtering material in front or perhaps in a more sophisticated setup, by electronically pulsing it on and off.
Robin
Robin LeadbeaterParticipantI wondered if the residual +1km/s offset in the fitted curve in fig 3 could be due to the mean motion of the system but it is catalogued as being in the other direction at -1.8km/s (or is this already included in the correction in table 1?)
Cheers
Robin
Robin LeadbeaterParticipantNice work detecting pulsations at this RV level with the LHIRES and separating them out from the orbital component (I was slightly worried when I saw your RV and light curves in phase as The RV curve in Cepheids is normally approximately antiphase but then I noticed your light curve Y is plotted in increasing magnitude)
RV measurements can be tricky with the H alpha line because of its width. Narrow metal lines are easier, particularly if you can measure a few of them but then in the absence of telluric lines, a stable reference is difficult to arrange. I used two Si II lines with lamp lines superimposed on the spectrum during the exposure to follow pulsations in Deneb for example.
https://britastro.org/video/13862/14769
at 18:30
which suggested a long term sigma precision of 0.5km/s is possible
Cheers
Robin
Robin LeadbeaterParticipantHi Derek,
A neat idea. You could use it to check how constant the dispersion is across the field. (A potential issue with objective gratings and wide angle lenses due to distortions)
Does anyone know if the wavelength is stable for a given pointer? (If so its wavelength could be calibrated) or does it vary eg with current and temperature? I have some cheap red green blue pointers. I might run some stability tests using the ALPY or LHIRES
Cheers
Robin
Robin LeadbeaterParticipantI am also trying to figure out if (and if so why) the distance along the laser beam changes the measured dispersion. The images showing reflections in the window suggest it does, though they will be much nearer than the typical beam distance of course. Can you see any loss of parallelism (is this a word?) between the zero order and dispersed beams?
Cheers
Robin
Robin LeadbeaterParticipantThere has been some loss of flux on the blue edge too
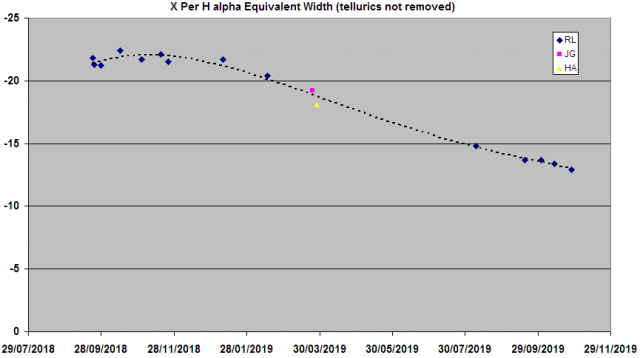
I’ve made a quick plot of EW. It looks like the drop started in January and is continuing
 Robin LeadbeaterParticipant
Hi Hugh,
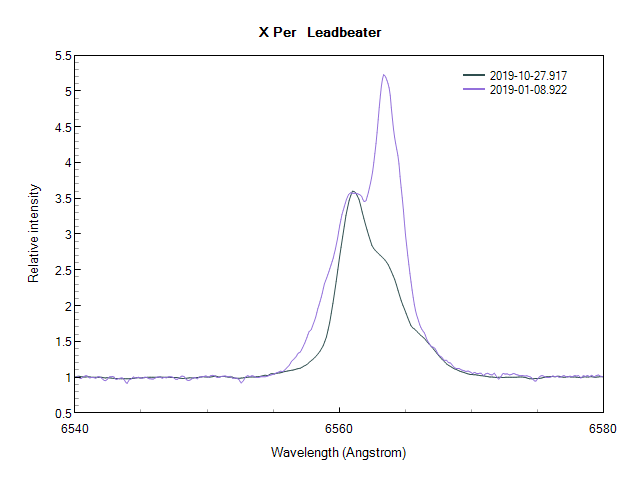
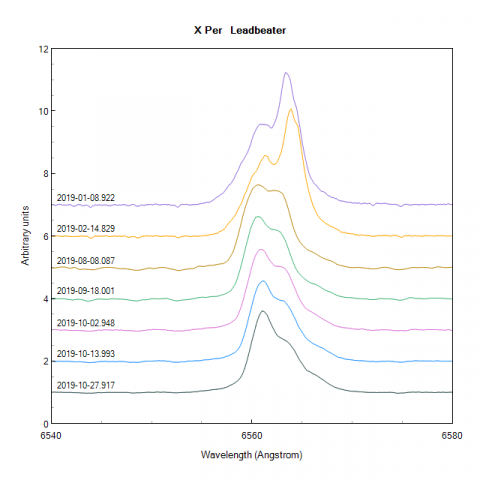
The high resolution H alpha shows that the red edge of the line has been steadily dropping over the year (most obvious during the summer in close season) but the blue component has stayed more or less constant which confims the drop in intensity you are seeing. I contacted Paul about it in August when I noticed the change over the summer but your post has reminded me that I did not get a reply so I had better try again. Something is obviously happening but I have no idea what !
Robin
 Robin LeadbeaterParticipant
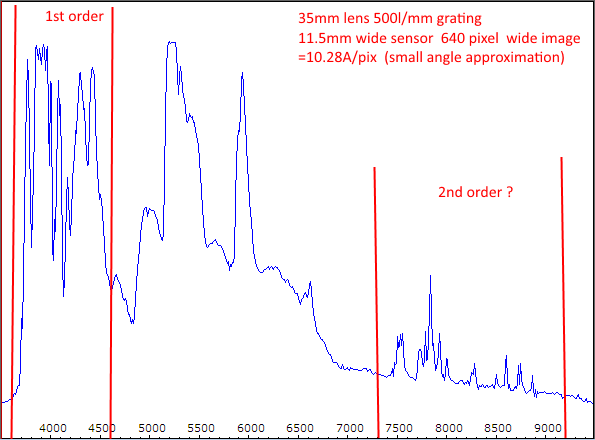
It is a bit difficult to tell from the scaled stretched image posted but with the configuration (35mm fl lens, 500 l/mm grating, 11.5mm wide sensor, rescaled to 640 pixels, the linear dispersion will be ~10.3A/pixel in the posted image (small angle approximation) The weak lines at the right hand edge are therefore likely to be the second order image of the group at the left hand edge. With this information we can estimate the location of the zero order and produce a wavelength calibrated spectrum.The calculated calibration is also in agreement with the quoted approx 3600-6500A response
(The small angle approximation will not hold precisely at the dispersion angles from a 500l/mm grating but the method could be finessed using angular dispersion in place of linear dispersion to produce an accurate wavelength calibration)
Cheers
Robin
Robin LeadbeaterParticipantI don’t know if you can apply it here but sometimes if your zero order is outside the field and your spectrum is reasonably linear (low dispersion angle) you can estimate the location of the origin (zero order) using common features in the first and second order spectra. (The distance from the zero order to a feature in the 1st order ~ the distance between the same feature in the two orders)
Cheers
Robin
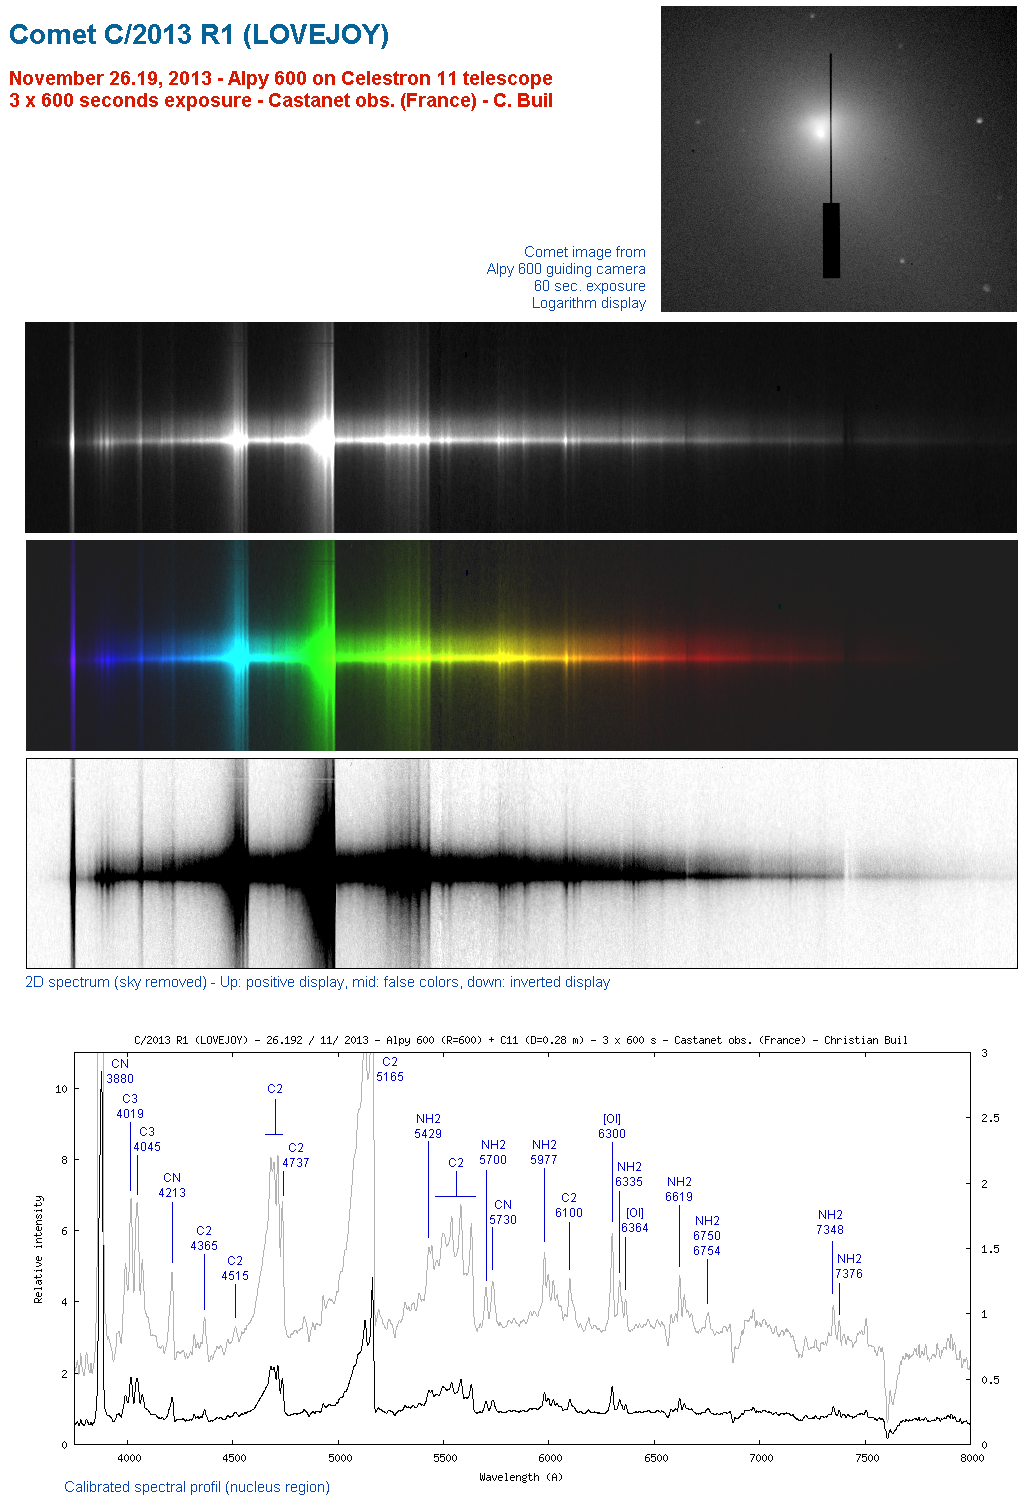
Robin LeadbeaterParticipantfrom Christian Buil
http://www.astrosurf.com/buil/comet/lovejoy/poster_lovejoy_20131126.png
Robin LeadbeaterParticipantYep assuming that blue is on the right, that central band looks just like a molecular band with a steep band head on the red side tapering down towards the blue. Like C2 Swan bands in comets for example. (hydrocarbons from left over fuel?) If you are using coated lenses then the cut off will be around 3650A. Do you have a best guess wavelength calibrated spectrum to share?
Robin LeadbeaterParticipantHi Andy,
With completely unfiltered CCD measurements (ie without cutting the IR) I vaguely remember something about CR (ie using R comparison star magnitudes) correlating better because of the extended response. Do you know if this is the case ?
Cheers
Robin
Robin LeadbeaterParticipantI see the press are at it again 🙁
Asteroid alert: NASA warning as kilometre long space rock set to skim Earth at 25,000mph
Robin LeadbeaterParticipantHere are the instructions given by Christian Buil for generating a file for use in file mode (method 3)
http://www.astrosurf.com/buil/isis/tutorial/calibration_us.htm
Robin
Robin LeadbeaterParticipantThough it does not mean I am right !. “Solar eclipses” appear to be a special case and should really be called transits or occultations
For me an eclipse involves observing the shadow in the light from a luminous body cast by one body on another body eg as observed from earth between Jupiter and its moons. The observer may be on the body which casts the shadow eg a lunar eclipse. A “solar eclipse” (total or partial) as observed on earth is an occultation or transit and is only an eclipse when observed from a location not on the earth eg from the moon or the ISS when even a “total eclipse” appears partial
Robin
EDIT: I suppose you could call observing the shadow of the moon racing across the landscape towards you or even noting the darkness of the ground at your feet during a “Total Solar Eclipse” observing an eclipse but for me the sight of the moon in front of the sun is definitely an occultation
Robin LeadbeaterParticipantI use the predefined mode with my ALPY but I use the file mode quite a bit with my LHIRES for cases where there is not a preconfigured setup. As well as the list of lines, the file contains the order of the fit you want and the approximate linear dispersion needed to approximately locate the lines so it is specific to a particular spectrograph and camera combination. You can generate your own file by doing a manual linear calibration first using the set (or subset) of the lines and noting the linear coefficient. (or you could try the linear coefficent from the fit generated using the predefined mode)This is then added to the list of line wavelengths along with the order of fit you want. (Note that it can fail if the dispersion is sufficiently non linear and the lines so closely spaced that the wrong line is picked. To avoid this, I suspect the predefined mode for the ALPY may allow for the non linearity of the instrument which the file mode does not allowing some more close spaced lines at the blue end to be used.) A typical file for the LHIRES looks like this for example
2
0.2461
6532.882
6598.953
6717.043
6752.834
where 2 is the order of the fit and 0.2461 is the linear dispersion (A/pixel)
(Ignore the doublespacing generated by the forum software)
Cheers
Robin
Robin LeadbeaterParticipantHa! I already use PHD2 and CdC but never realised that function was there
Thanks!
-
AuthorPosts