› Forums › Spectroscopy › Learning to measure eqw of spectral lines
- This topic has 9 replies, 5 voices, and was last updated 8 years, 3 months ago by
 Dr Andrew Smith.
-
AuthorPosts
-
7 December 2017 at 10:02 am #573900
 Dr Andrew SmithParticipant
I have been looking at various tools to measure the equivalent width of spectral lines. If anyone know what the current best practice is please point me at it.
Today was the turn of IRAF. Background estimation seems to be the limiting factor giving results that vary at the at the few percent level. A new game for cloudy nights
Attached is one attempt.
Regards Andrew
Attachments:
7 December 2017 at 11:05 am #578832 Robin LeadbeaterParticipant
I’ve only really measured EW manually but found it very sensitive, particularly in noisy spectra, to deciding exactly where the continuum goes (linear, spline fit, what order to use ? etc) and where the line meets the continuum for the integration limits. How does IRAF do this? In your screenshot it looks like it is fitting gaussians to separate merged line components. ( I remember something similar in SPLAT) Is this part of the EW measurement?
Robin
7 December 2017 at 4:00 pm #578833Dr Andrew SmithParticipantHi Robin, yes you are right the biggest challenge is estimating where the continuum is. IRAF gets you to manually place two points on the “continuum” and then identify all lines between these two points. It then deblends the lines by fitting Gaussian ( or other functions) to the curves and reports the lines center, FWHM and eqw etc. for all the lines.
SPLAT allows a similar process but you can provide a constant for the continuum or fit a polynomial for the background. Again it has several function you can fit with.
I found a paper on DAOSPEC which is an automatic program that has a good discussion on current methods. It also introduced an interesting idea I am trying manually with SPLAT. You estimate (guess) a background and fit the lines. You then subtract the fitted lines which leaves a new local background that provides a new estimate of the local continuum and you then use this etc. etc. iterating as long as you wish.
They also argue that you don’t want the true continuum but the local continuum which will include unmodeled lines who’s average contribution you want to avoid.
The paper is here https://arxiv.org/abs/0811.2932
I think I will use an ensemble of methods to give an error estimate and then pick the one that is as robust as I can make it.
Regards Andrew
PS Given how lazy I am I shall try tp work out how to download and compile DAOSPEC or similar and let it do the work!
7 December 2017 at 8:51 pm #578834 Andy WilsonKeymaster
Hi Andrew,
I’ve also been automating equivalent width calculations recently. I suspect you will take a different approach to me, but I thought I’d share my experience.
I am trying to measure the EW of lots of lines in lots of spectra automatically. I’ve not gone down the path of fitting polynomials or Gaussians. Instead:
- Work out the local continuum.
- Sum up the flux from the spectrum between 2 predetermined wavelengths for the start and end of the line.
- Calculate a dummy flux based on my local continuum level between the 2 wavelengths.
- Calculate my absorption flux by subtracting the summed flux from my dummy flux
- Finally calculate a width based on this absorption flux and the height of my local continuum.
As in the other posts, I also find working out the local continuum level to be the tricky bit. To deal with varying levels of noise, I take the median continuum of a few wavelength bins either side of my start and end line wavelength, then take the average of the continuum at my start and end wavelengths.
That is an interesting paper, I’ll have to give it a read.
Cheers,
Andy
7 December 2017 at 9:45 pm #578835Dr Andrew SmithParticipantHi Andy, I think your approach will work well with well isolated lines where you can be sure all the flux is from the line you are interested in. Where lines are blended fitting a Gaussians (or other line profile) allows you to deblend them, at least approximately. The biggest problem I have is that there is no obvious continuum in the yellow hypergiants which is why I am attracted to the idea in the paper of subtracting the fitted profile from the spectra to give a new estimate of the continuum.
I am going to experiment with SPLAT and see if taking different starting continuum levels converges to the same value in a few iterations – I easily lose focus!
Regards Andrew
8 December 2017 at 9:13 pm #578836 Hugh AllenParticipant
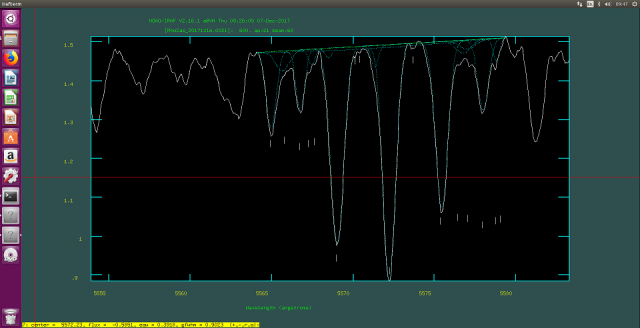
I used a crude but simple estimate of the EW of the Hα and Hβ emission lines in the VV Cep spectrum, in order to monitor progress of the current eclipse. I drew a ‘continuum’ by extending a straight line between the turning points at the base of the emission lines. As an example here’s the result I got in BASS with last night’s spectrum:
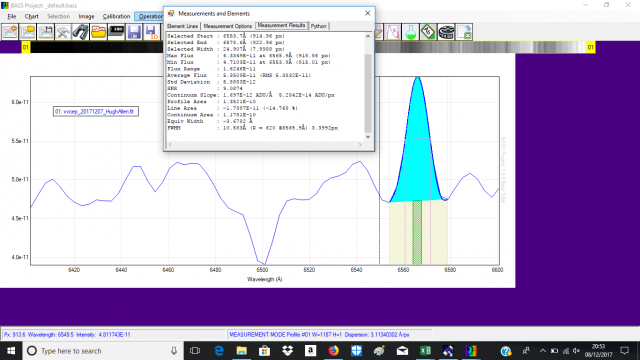
I realise the approach is not strictly scientific but is repeatable and seems to have given a reasonably comparable set of measurements. Here’s the latest time plot of my EW measurements on my own and others’ Alpy spectra:

The latest episode of Hα brightening seems to have appeared bang on time!
I’d welcome any comments on the approach
Cheers
Hugh
9 December 2017 at 9:38 am #578837Dr Andrew SmithParticipantIf it works for you Hugh, I don’t see any good reason not to use this method. If I were using it I would just look to see if the “continuum” you are using remains stable or if it moves systematically as the line changes strength. Even this does not matter if you just wish to follow the rise and fall of the intensity.
Regards Andrew
Regards Andrew
9 December 2017 at 12:02 pm #578838Robin LeadbeaterParticipantHi Hugh,
(The same answer as Andrew but with a bit more detail,read and forget if you like!)
Your measurements are showing nice qualitative trends but you have to be a bit careful when interpreting the EW of emission lines.
EW works well as a measurement of absorption line strength because absorption is normally just a proportion of the continuum, so provided you can decide where the local continuum is, the EW gives you a good measurement of the line strength. (eg even if the star changes in brightness, if the absorption is constant, the EW stays the same.)
Emission lines are different as they normally come from a different source than the continuum so are independent of it. This means the EW value of an emission line makes less sense as we are measuring it relative to something not connected with the emission line. This is OK provided we know that the continuum flux is constant (or at least how it is changing, so we can correct the EW to give a true measurement of the line strength) Otherwise the EW results can be deceiving. Classical novae are a good example. If you plot the EW of H alpha as the nova evolves it looks like the line is continuously getting stronger. In fact though this is mainly due to the continuum falling away and for much of the time the actual line strength is constant and even decreasing at times.
If we look specifically at your VV Cep spectrum, the hot star is now fully eclipsed so the continuum is that of the cool star photosphere and the emission comes from somewhere else (possibly an extended region (disc?) associated with the hot star but there are many possible sources). The variations in the continuum around the emission line will be due to a blend of the many absorption lines in the cool star spectrum and we don’t see the true continuum at this resolution (It will likely be somewhere along the high points of the spectrum). The reference points you have chosen will be somewhere in the absorption lines so will only be fixed during totality, assuming no variations in the cool star spectrum. Outside totality, the reference points will rise closer to the continuum level as the hot star reappears and the cool star absorption lines lose their relative strength. The continuum flux will also increase to that of the two stars combined. Both these will affect the EW measurement even if the emission line strength actually remained constant.
All is not lost though if you want to make an absolute measurement of the way the emission line flux is varying, as all the necessary information is available.
What we would first need to do is to convert the spectrum to absolute flux. This could be done using the available measurements of photometric brightness around the time of the spectrum. Once that has been done, we can work in absolute flux rather than relative to some poorly defined and varying continuum.
The next step would be to remove the cool star component. We could try this now by subtracting a reference spectrum of a star of the same type, adjusting it to match the intensity of the absorption lines, but probably the best way to do this would be to wait to around mid eclipse when the hot star and any circumstellar material should be hidden and use this as a template. Once this is subtracted, we should be left with the flux calibrated spectrum of the uneclipsed components, probably dominated by Balmer emission lines with their actual intensities measurable directly.
Cheers
Robin
10 December 2017 at 11:12 am #578840 David BoydParticipant
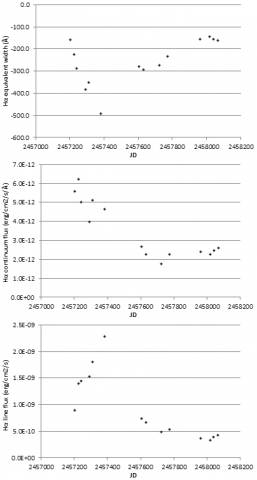
Following on from Robin’s comments above, the plots below show how the EW, continuum level and flux of the H-alpha emission line of AG Peg have varied over the past couple of years. Clearly what the continuum is doing has a big influence on how you interpret changes in the EW as an indication of how the line flux is varying.
David
 15 December 2017 at 10:27 am #578861Dr Andrew SmithParticipant
After much experimentation I have found that the most consistent way of measuring EW (for me at least) is to first rectify the spectrum to unit intensity for the continuum the use a function fit. I have found this simplest to do using SPLAT-VO. This has a modern interface and the best integrated set of tools with one exception. SPLAT allows polynomial and free hand fitting of the continuum, functional fitting of line with the standard functions for measuring the lines. It also has “flip and translate” of a spectrum for measuring line shifts. It is only for blended lines and emission lines where IRAF has better tools.
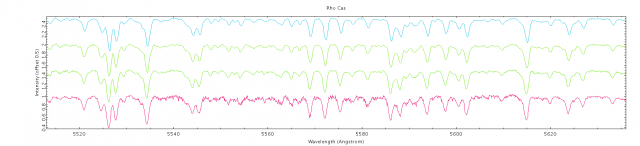
Here are four spectra of Rho Cas with 3 Fe I lines near 5572 A that I intend to monitor along with others. The spectra match to within a few percent in the continuum but are offset here for clarity. The lower two spectra are at half the exposure of the top two. The poor S/N on the first one is due to the very poor seeing at the time.
Regards Andrew
-
AuthorPosts
- You must be logged in to reply to this topic.