
Jupiter in 2022/23: Report no.10
Jupiter in 2022/23, Report no.10: Global Zonal Drift Profile
Gianluigi Adamoli & John Rogers (using data from the JUPOS team)
(2026 September)
A PDF copy of this report is here: Report-2022-23-no10_Global-ZDP
and an enlarged print of the ZDP is here: ZDP-global-2022-23_Biggest-chart(GLA)-v4
Here we present a complete zonal drift profile (ZDP) covering all accessible latitudes, derived from JUPOS data. In recent years we have often posted ZDPs in our reports covering particular latitude ranges of interest, but no global ZDP since 2015/16. The present one is far more detailed, extending from 76.4°N to 69.6°S; it includes the first ZDP for the northern-most belt. A version in u3 (m/s) is also available. Links to further information about the features shown can be found in our new Guide [Ref.1].
For 2022/23, we have already posted thorough accounts of the northern hemisphere (Report no.6: North polar region to NNTBs jet) and southern hemisphere (Report no.8: SEBn to S4 domain; & Refs.2 & 3), including JUPOS charts and ZDPs for many domains. Here we comment on a few regions that were not covered therein, or have been newly noticed in our latest analysis.
On the chart, some spots are represented multiple times because their drifts changed, and some spots with unusual drifts may have represented local or short-term disturbances (e.g. the fastest in the NNTBn retrograde jet, as noted in Report no.6). The larger version of the chart enables outliers like these to be distinguished from the more typical spots. Larger symbols denote larger and more persistent spots, viz:
Large dark spots (blue-grey squares): One NEB barge; two SEB barges; STB DS8.
Large white spots (green circles): NN-WS-4 & WS-6; NTropZ/NEBn AWOs (except WS-Z); STropZ spot Q; S2 AWOs (A1 to A8); the two S3 AWOs; S4-AWO-2. Also two cyclonic circulations: the SEB whitened barge, and STB WS6.
Long-lived red or white ovals (red circles): S5-AWO-1 (many points; see Report no.9); NN-LRS-1; WS-Z; GRS; BA; S4-LRS-1.
The blue curve is the ZWP from Cassini [Ref.6], for comparison, with the prograde jet peaks labelled. We detect spots at the peaks of the N4, N3, N2, and S2, S3 and S4 jets, as previously discussed. See our long-term reports for details of the S1 jet and domain [Ref.2] and the S2 jet [Ref.3]. As discussed therein, the S2 jet is now faster than it was up to 2000 (dashed line on the chart), while the S3 jet is slower. On the S4 jet we detect a wave-train with phase speed much slower than the jet itself (circled; see Report no.8).
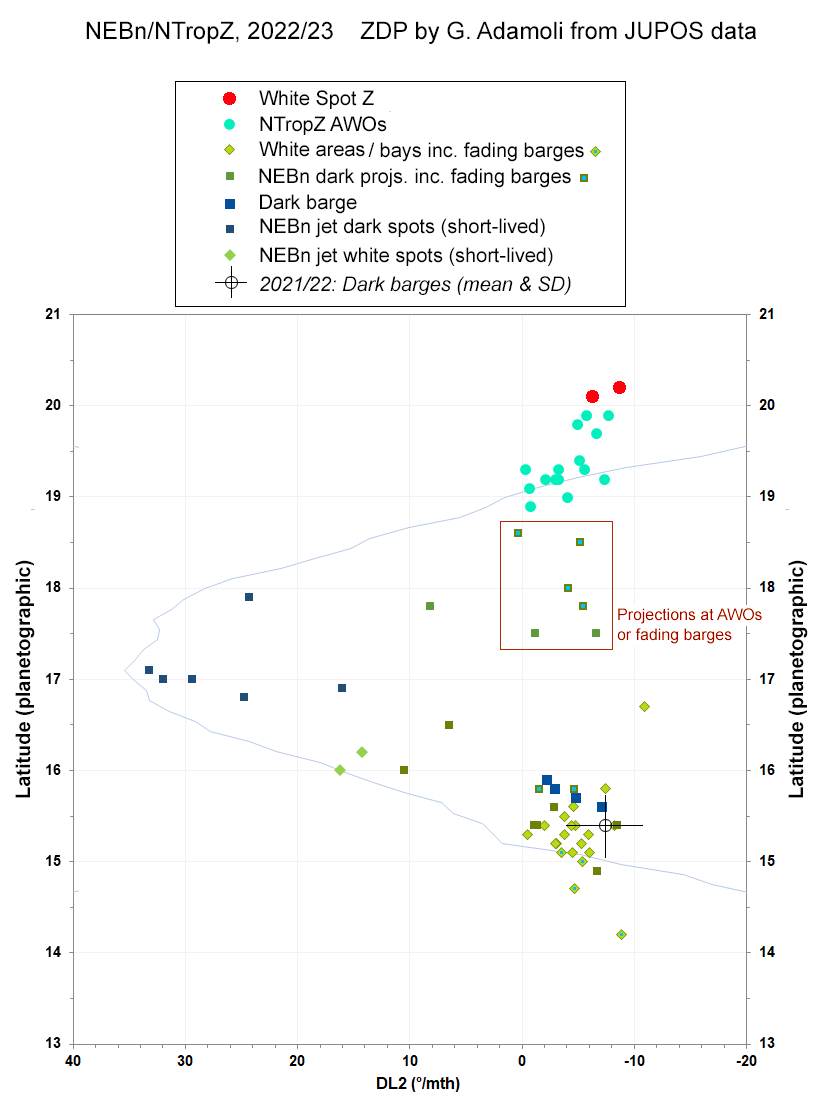
The NTropZ/NEB chart is complicated and has not been shown before; see Figure 2. At the time, the NEB was gradually reviving from an exceptional fading episode [see our reports for 2021/22 inc. Ref.4, & 2022/23 Reports nos.1-5]. It is notable that, despite all this unusual activity, the ZDP is normal. Cyclonic ‘barges’, some of them large, had been notably dark in 2021/22, but most had faded so they had low contrast and were not fully recorded by the JUPOS team, although JunoCam images showed that they retained their oblong forms. The JUPOS data shown here tracks one dark barge (15.8°N) & some fading barges (15.0-15.6°N). These latitudes are typical of barges in normal NEB and faded NEB respectively, in previous apparitions [Ref.4]; note that the dark barge is well north of the ZWP as usual, the faded ones less so. But the chart also shows other features associated with fading barges or AWOs which do not represent the centres of the circulations (some white ‘bays’, some partially faded barges at 14-15°N, and some dark ‘projections’ at 17.5-18.6°N). There is also a scattering of small dark retrograding spots representing the inconstant retrograde NEBn jet, mostly following White Spot Z (as we have noticed before). White spot Z, the long-lived AWO, lies well N of the ZWP, probably because white clouds are concentrated in its northern half.
In the NEB(S), small brilliant but short-lived convective outbreaks were expanding and gradually leading to revival of the dark belt and of the NEBs dark formations (NEDFs) [Reports nos.1-5]. The very wide range of speeds in the NEBs jet represents this transition: super-fast speeds for small features that had developed while the NEB was quiescent with no NEDFs, and speeds near DL1 = 0 for NEDFs that were reappearing, and much slower speeds (DL1 up to ~+2 deg/day) for bright and dark features associated with the miniature convective outbreaks. However, large irregular features (e.g. NEDFs) were not always measured.
The SEBn jet also shows a wide range of speeds, although most are clustered around DL1 ≈ -39 (±8) deg/30d [Reports nos.3 & 8]. There was an incipient South Equatorial Disturbance (SED), but this did not noticeably affect the speed of the jet until later in 2023.
The SEBs retrograde jet includes a notable set of six small spots, with DL2 from +140 to +160 deg/30d, not previously reported in this apparition. This speed is much faster (retrograding) than most spots or ZWPs for this jet. They were well tracked and widely distributed, mostly preceding the GRS. Their average speed was DL2 = +151.8 (±6.8) deg/30d, u3 = -73.2 (±3.1) m/s, at lat. 19.05 (±0.27)°S (N=6). They are very similar to super-fast spots that we noted in 2012/13 and 2016 (see links in Ref.1), thus usefully confirming this remarkable phenomenon.
Large anticyclonic ovals (red points) generally lie close to the ZWP and other spots, including the GRS (at 22.6°S), oval BA (33.5°S), and NN-LRS-1 (41.8–40.8°N). This contrasts with many of our earlier results, when they had systematically lower latitudes. This is attributable to the shrinkage of all these ovals in recent years:
GRS (centre): Its historical mean was 22.3°S, but when it shrank in 2013/14 it shifted to 22.5°S, and in 2022/23 we find it is at 22.6°S [Ref.5].
BA: It lies ~0.2° lower than the ZWP, less than in the past when it was bigger, and consistent with other recent meas’ts [Ref.2].
NN-LRS-1: Now similar size to WS-4 & &WS-6 [Report no.6].
References:
- J. Rogers (2026), ‘The B.A.A. Guide to Jupiter’s Atmospheric Phenomena Since 1990’. https://britastro.org/section_information_/jupiter-section-overview/baa-guide-to-jupiter
- J. Rogers, G. Adamoli, R. Bullen, M.Jacquesson, M. Vedovato, H-J. Mettig, C. Foster, C. Hansen, G. Eichstaedt, G. Orton, T. Momary (2025 Dec.). ‘Jupiter’s South Temperate Domain, 2018-2024’
- Rogers J, Adamoli G, Bullen R, Hahn G, Jacquesson M, Vedovato M, Mettig H-J, Eichstaedt G, Hansen C, Orton G, Momary T. (2025). ‘Jupiter’s S2 (South South Temperate) domain, 2012-2023.’ https://britastro.org/section_information_/jupiter-section-overview/long-term-reports-publications/s2-domain-2012-2023
- Rogers J & Adamoli G (2022), Jupiter in 2021/22, Report no.10: ‘Final report’. https://britastro.org/section_information_/jupiter-section-overview/jupiter-in-2021-22/jupiter-in-2021-22-report-no-10-final
- Rogers J, Adamoli G & Jacquesson M (2015), Jupiter in 2013/14, Report no.9: ‘The GRS and adjacent jets: Further analysis of amateur images, 2013/14’. https://britastro.org/jupiter/2012_13report09.htm
- Porco CC et 23 al. (2003), ‘Cassini Imaging of Jupiter’s Atmosphere, Satellites, and Rings’. Science 299, 1541-1547.
Figure 1:
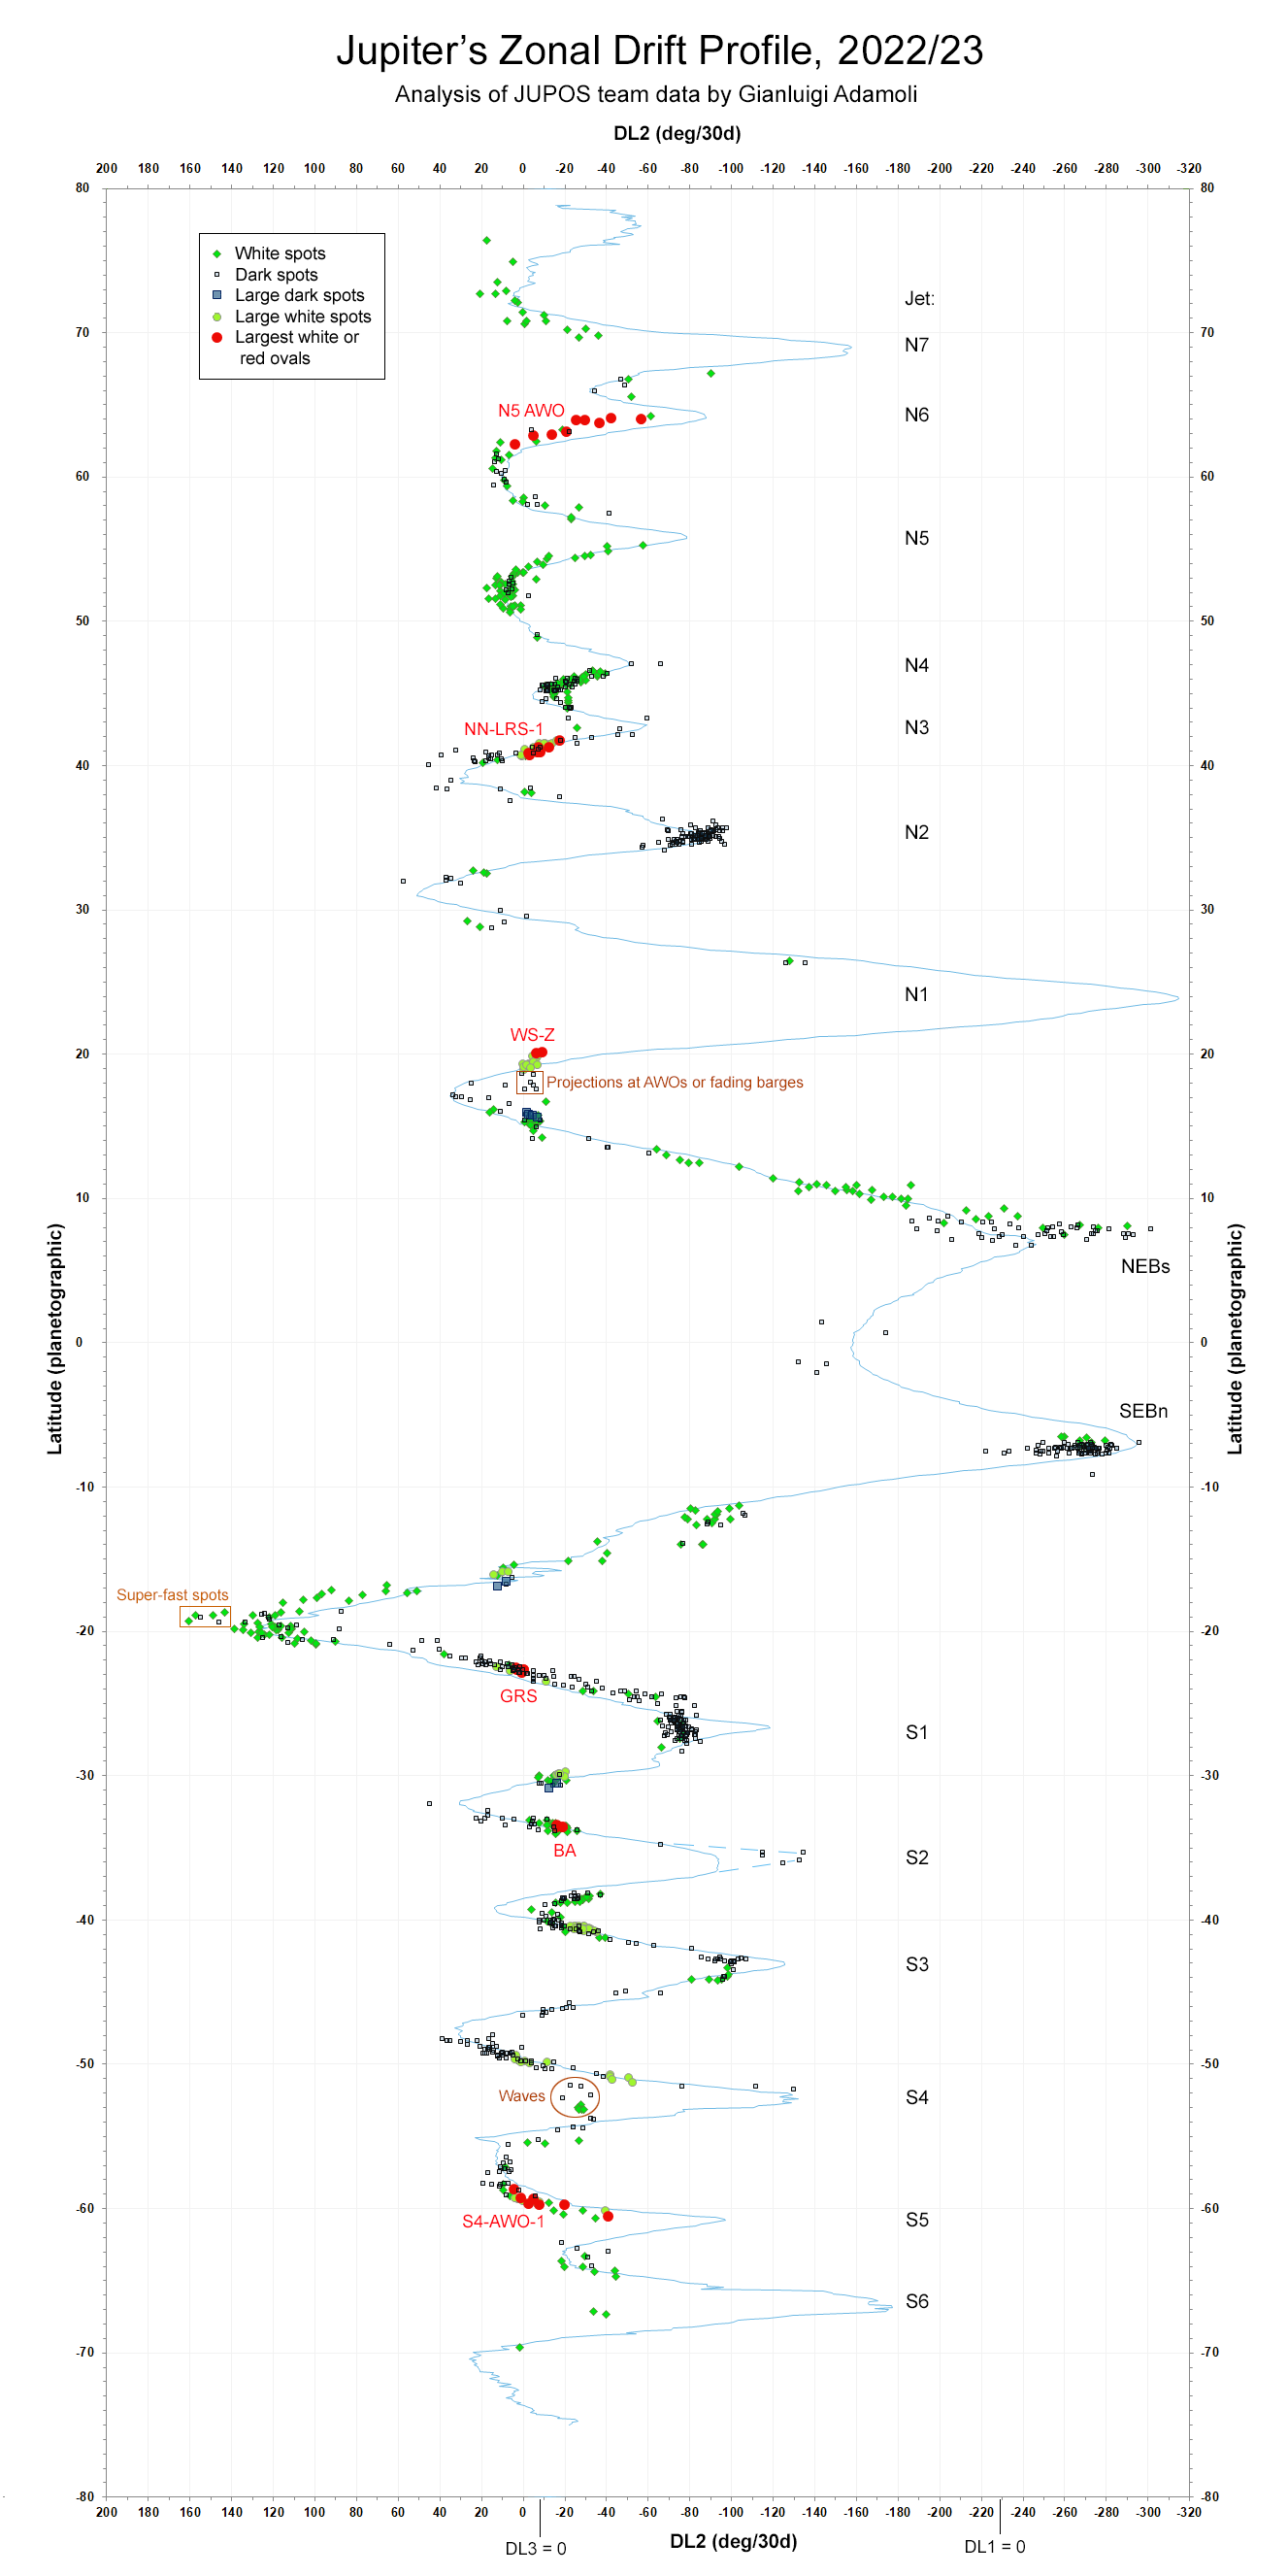
Figure 2:
| The British Astronomical Association supports amateur astronomers around the UK and the rest of the world. Find out more about the BAA or join us. |