
B.A.A. GUIDE TO JUPITER’S ATMOSPHERIC PHENOMENA SINCE 1990
THE B.A.A. GUIDE TO JUPITER’S ATMOSPHERIC PHENOMENA SINCE 1990
by John Rogers (BAA Jupiter Section Director), (2nd edition, 2026 Sep.)
These pages provide a guide to the major features of Jupiter’s atmosphere and the major phenomena that have occurred since 1990, and an index to the studies that we in the BAA Jupiter Section have published or posted about them – including our best and most up-to-date references. References are given both via a reference list (at the end), and via hyperlinks where available.
This Guide is posted as a downloadable PDF here: Jupiter_Guide-for-website_2026_Final-2
and also directly on this web page, below.
(This is the second edition; the first edition PDF of this Guide, from 2026 June, is archived as:)
Jupiter_Guide-for-website_2026_v4&Figs
_________________________________________________________
CONTENTS
INTRODUCTION
PART I: GENERAL ASPECTS
1. Belts, Zones, Jets, and Domains
1.1. Zonal wind profiles & Zonal drift profiles
1.2. General properties of the jets
2. Local circulations
2.1. Cyclonic circulations
2.2. Anticyclonic circulations
3. Global Upheavals
4. Multispectral imaging (Infrared, Methane-band, etc.):
PART II. REGIONAL PHENOMENA
5. High northern domains (N3 to ‘N7’)
6. N.N. Temperate (N2) domain & jet
6.1. NNTZ ovals
6.2. NNTBs (N2) jet
7. N. Temperate (N1) domain & jet
7.1. N.Temperate Disturbance
7.2. The NTBs jet stream (N1 jet) & NTBs outbreaks (NTB Revivals)
8. N. Tropical domain & NEBs jet
8.1. AWOs in NTropZ/NEBn
8.2. N. Equatorial Belt (NEB) (inc: NEB cycles; Thermal/methane-dark waves)
8.3. NEBs jet & NEBs dark formations (NEDFs) (= ‘hot spots’)
9. Equatorial Region
9.1. Equatorial Zone (EZ): Coloration episodes
9.2. SEBn jet & S. Equatorial Disturbance (SED)
10. S. Tropical domain
10.1. S. Equatorial Belt (SEB)
10.2. The SEBs retrograding jet
10.3. South Tropical Disturbances
10.4. Great Red Spot (GRS)
10.5. Anticyclonic rings in STropZ
11. S. Temperate (S1) domain & jet
11.1. The STBn jet
11.2. S. Temperate (S1) domain
12. S.S. Temperate (S2) domain
13. High southern domains (S3 to ‘S6’) & S. Polar Region
14. Polar polygons (from JunoCam)
REFERENCE LISTS
___________________________________________________________
INTRODUCTION
These pages provide a guide to the major features of Jupiter’s atmosphere, and to the major phenomena that have occurred since 1990, and an index to the studies that we in the BAA Jupiter Section have published or posted about them – including our best and most up-to-date references. Only a few professional references are included, mainly those in which the Jupiter Section was also involved, and a few landmark papers. Other professional references are given in some of our major reports. Our individual JunoCam perijove reports are not included except for a few special instances.
Our knowledge of Jupiter’s atmosphere up to 1991 was compiled in The Giant Planet Jupiter (Ref.J1). An index to our subsequent publications and posts that gave substantial information about the major features and phenomena up to 2015 was posted on our old web site under ‘Reference Articles’. This is an expanded and updated version of it.
References
References in this Guide are given both via a reference list (at the end; text references in green or brown), and via hyperlinks where available (hyperlinks in blue). They are organised in four categories, as follows:
–Articles in journals and other print media, e.g. “Ref.J1…” – these include papers in the Journal of the BAA (JBAA) and in professional journals; most of the latter have the Section Director and sometimes other amateur(s) as co-authors.
–Major reports on our web pages, e.g. “Ref.R1…” — these include long-term reports (which will include references to our interim reports on the same topic, so those will not all be linked here) and some apparition reports. The most comprehensive are in bold type.
–Other notable interim reports on our web pages, e.g. “Report 2024/25 no.7…” – the more important ones in bold type. These are not entered in the reference list but are given in the text as hyperlinks.
–EPSC abstracts, e.g. “EPSC 2025-55…” – these are convenient summaries of topics. Hyperlinks for these are not given in the text; please find the abstract in the reference list, with a link to it in the EPSC web sites. From 2020 onwards, abstracts posted by EPSC do not always show the figures or formatting adequately; our own properly formatted PDF versions are at: https://britastro.org/section_information_/jupiter-section-overview/contributions-2020-onwards
Conventions and abbreviations
Our reports previously used historical conventions (south up in figures, System II longitudes (L2)) but since 2015 we generally use the more recent professional conventions (north up, System III (L3)). However, we still quote longitudinal drift rates in L2 (DL2, degrees per 30 days) in order to enable comparisons with earlier records. They can easily be converted to drifts in L3: DL3 = DL2 + 8.0 deg/30d. Sometimes, drift rates are also converted into wind speeds in System III (u3, m/s).
Latitudes are given as planetographic, except in Juno reports where they are planetocentric.
Abbreviations used in our reports include the following:
Abbreviations used:
F., following = planetary west P., preceding = planetary east
AWO, anticyclonic white oval FFR, folded filamentary region [cyclonic]
GRS, Great Red Spot PJ, perijove [Juno]
ZDP, zonal drift profile ZWP, zonal wind profile
–and other standard abbreviations for belts and zones, shown in Figure 1.
___________________________________________________________________________________
PART I. GENERAL ASPECTS
1. Belts, Zones, Jets, and Domains
Jupiter’s disk appears divided into alternating belts (visibly dark) and zones (bright). Although there are variations, they tend to lie in reproducible latitudes, and have long-established names accordingly. The Voyager spacecraft showed that the average latitudes of the belt edges coincide with jet streams (jets), running eastward (prograding) or westward (retrograding). These jets have fixed latitudes, and are the most significant divisions of Jupiter’s atmosphere. Therefore, their latitudes provide the natural, modern definition of the belts (cyclonic) and zones (anticyclonic) (Figure 1).
The eastward (prograding) jets are, in most cases, the fastest and best-defined, and no substantial features cross them (with a limited exception described below). So these jets form the boundaries of domains, each of which consists of a belt (low-latitude) and zone (high-latitude). The prograde jets are numbered going poleward in each hemisphere, and each domain has the same number as the jet on its equatorward side. In order to keep the numbering compatible with the traditional names of the belts and zones, the numbering of jets starts with N1 = NTB south edge, so the N1 domain = North Temperate domain consisting of NTB & NTZ; then N2 = NNTBs jet, N2 domain = NNTB & NNTZ; and likewise in the southern hemisphere.
In abbreviations, we distinguish a belt edge (e.g. written NTBs, also referring to the N1 jet) from a belt component (e.g. written NTB(S), when the NTB is visibly double).
This scheme was described in our post: Ref.R1 = ‘Reference list of Jupiter’s jets’.
This page gives the peak speed and latitude for each jet from each of the 4 major spacecraft data sets up to 2007 (Voyager, Hubble S.T., Cassini, New Horizons). An updated table and diagram (copied here as Figure 1) are posted here:
Ref.R2 = ‘Jet streams list’
The scheme was also described in our long-term report: Ref.R3 = Jupiter’s southern high-latitude domains…
[& in our 2022/23 Report no.8].
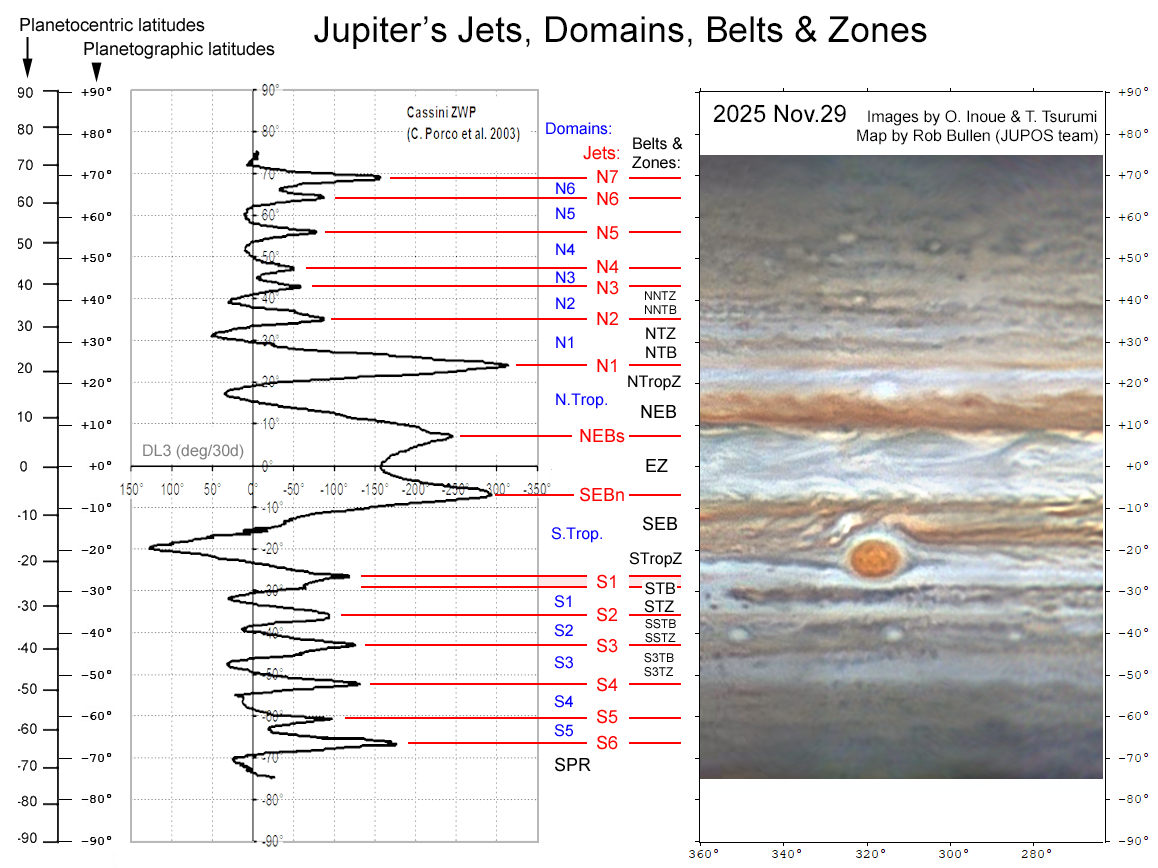
Figure 1: Definitions of Jupiter’s jets, domains, belts & zones, by latitude. Jets and domains are not shown beyond S4 and N5, but actually go up to S6 and N7.
Further zonal wind profiles have been published since, largely from Hubble images, but also from amateur images by the JUPOS team (see our refs. below) and by: Ref.J2 = Hueso et al.(2017).
An important study from Hubble images over many years produced global maps of both E-W and N-S winds, showing sectoral variations and circulations, reinforcing some of our own conclusions: Ref.J3 = Tollefson et al.(2017).
1.1. Zonal wind profiles & Zonal drift profiles
‘Zonal wind profile’ (ZWP) & ‘zonal drift profile’ (ZDP) refer to charts of east-west wind speed vs latitude.
A ZWP represents the smallest resolvable features and is taken to represent the winds (at cloud-top level, of course); these are derived from spacecraft images, or in recent years from the best amateur images by cross-correlation analysis, over a matter of hours (up to 30 hours). A ZDP represents distinct ‘spots’, i.e. weather systems, that are individually tracked for longer time-spans; these are commonly derived from amateur images by the JUPOS team.
We routinely find that a ZDP is closely aligned with the ZWP, except:
–For retrograding features, the ZDP is ‘blunt’, i.e. retrograding speeds are slower than the ZWP.
–In some cases, on the anticyclonic slope, the ZDP is displaced by up to a degree latitude from the ZWP [e.g. STropZ (see refs. on SEBs jet below) and N5 domain (see: 2022/23 report no.6 [Ref.R13] & 2024/25 report no.7)].
–Large anticyclonic ovals sometimes follow a ZDP that is displaced from the ZDP for smaller ovals, probably because they distort the adjacent jet(s):
Ref.J4 = Rogers et al.(2011), ‘A Little Red Spot tracked through a jovian year’
[inc. Supplemental tables.] for N2 & other domains;
Ref.R9 = Jupiter’s long-lived N5 oval, 2015-2023, for N5-AWO;
Ref.R15 = ‘Jupiter’s S. Temperate domain…. 2001-2012’ for S.Temp.AWOs.
Most substantial ‘spots’ have drift rates within a fairly narrow range, defining a ‘Zonal slow current’ (ZSC) which is characteristic of each domain; these are the ‘currents’ that have long been recorded by amateur observers [Ref.J1]. Substantial spots tend to lie in latitudes where their ZDP is close to the ZSC.
Zonal wind profiles from amateur work:
Ref.R4 = ‘Longitudinal drift determination from image pairs with WinJUPOS’& follow: WinJUPOS/Tutorials/.
(Grischa Hahn; includes ZWP from amateur images in 2010 Sep).
Ref.R5 = ‘Jupiter in 2012/13: Interim report no.9’, Appendix 5 (Grischa Hahn) from amateur images in 2012 Sep-Dec.
Ref.R6 = Hahn & Rogers (2015), Report 2013/14 no.10: ZWPs from ground-based and Hubble images, 2014 Feb & April
(These focussed on a S.Temperate sector with STBn jet spots, & a NTB sector.)
Report 2019 no.4: ZWP & maps from amateur images on 2019 June 19-21, by M. Vedovato.
Report 2019 no.9: ZWP & maps from HST on 2019 June 26-27, by M. Vedovato.
Ref.R7 = Report 2023/24 no.3, ‘The major jets’ (inc. Appendices): ZWPs in 2023/24 from amateur images, by G. Hahn.
Ref.R42 = Report 2024/25 no.5: ZWPs in 2024 Nov. & 2025 Feb. from amateur images, by G. Hahn.
(Profiles for NTBs jet are shown; global profiles still unpublished.)
Zonal drift profiles from amateur work:
Ref.R26 = ‘Jupiter in 2007: Final numerical report’ – Part 1, Fig.1 (ZDP).
Ref.R33 = ‘Jupiter in 2014/15, no.12: Final numerical report’.
Report 2015/16 no.13: ZDP from 62°N to 71°S.
Report 2022/23 no.10: ZDP from 76°N to 70°S.
We have also posted many ZDPs covering less-than-global latitude ranges, e.g. in our long-term reports on the N3 to N6 domains, the S1 domain, and the S2 to S4 domains [see refs. in regional sections below], and in our reports on the 2020, 2022/23 and 2024/25 apparitions. Our latest global example is in Figure 2:
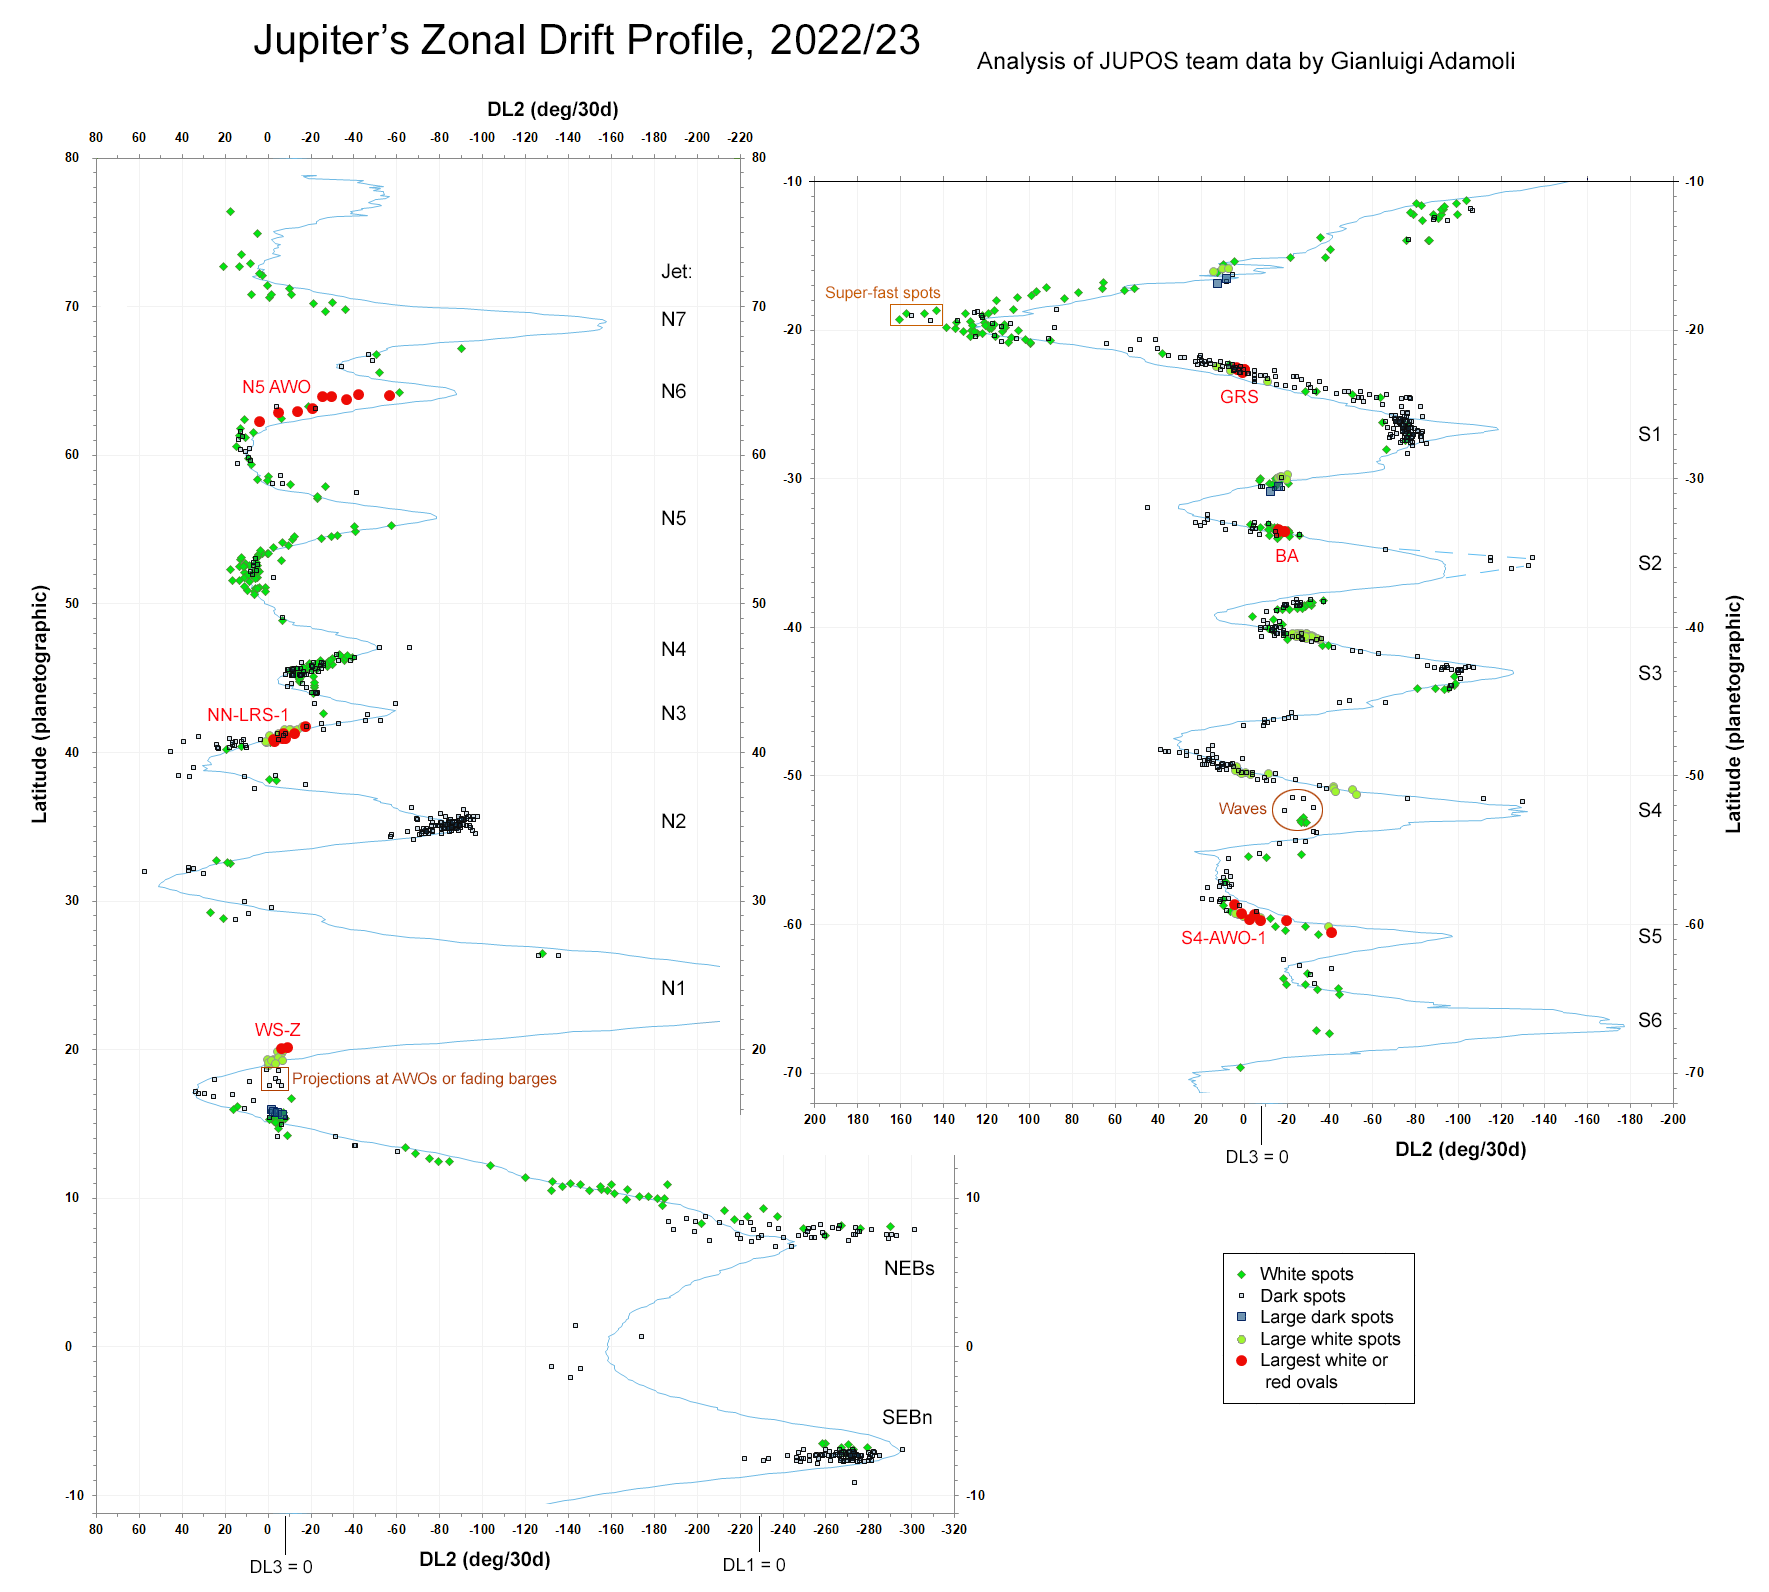
Figure 2. ZDP covering most of the planet, 2022/23, from JUPOS data (from Report 2022/23 no.10).
1.2. General properties of the jets
Here we summarise the jets in general; see regional sections below for references. For summaries of the speeds and behaviour of all the fastest jets, and details in recent years, see:
Ref.R7 = Report 2023/24 no.3, ‘The major jets’ (inc. Appendices)
& earlier ones cited therein, inc: Ref.R8 = Report 2021/22 no.10 inc. Appendix 1.
The NTBs, NEBs, and SEBn jets are by far the fastest, all with ‘super-fast’ maximum speeds in the range ~140-170 m/s, and there is evidence that the speeds are most rapid below the visible cloud-tops. There are large variations in the observed speeds which appear to be due to suppression of the ‘super-fast’ speeds by cloud-top meteorology, viz. the disturbances on the NTBs, and the North Equatorial dark formations (NEDFs: presumed Rossby waves) on the NEBs, and the comparable S. Equatorial Disturbance (SED) on the SEBn. The other prograde jets may also show speed variations but more modestly. A well-documented case is that the S2 jet has accelerated after 2000, while the S3 jet has decelerated [Ref.R20 = ‘Jupiter’s S2 domain, 2012-2023’].
The SEBs jet is the only rapidly retrograding jet, and it shares many properties with the prograde jets, including its sharp peak, its well-defined latitude, and its tendency to carry dark spots which are anticyclonic vortices, travelling less rapidly than the peak jet speed. Nevertheless, it does curve northward around the GRS forming the Red Spot Hollow, and exhibits multiple speed ranges as described below.
The other retrograde jets are slower and do not have such well-defined peaks. In low-latitude domains, the jet curves N and S around cyclonic and anticyclonic circulations. In the NEBn, these sometimes form an evenly-spaced series and the jet traces a wave-like pattern between them. In mid-latitude domains, notably the STBs, the retrograde jet is faster within long cyclonic circulations, whether chaotic (FFRs) or pale and quiescent (see below). Some narrow domains have no retrograde jet, just a minimum of eastward velocity, e.g. in N3 and N6, although in S2 there is a retrograde SSTBs jet even though early ZWPs did not show one [Ref.R20 = ‘Jupiter’s S2 domain, 2012-2023’]. In high-latitude northern domains (N4, N5, & the northernmost and southernmost belts), there is not a continuous retrograde jet: the ZWP itself is blunt like the ZDP, with a modest retrograde speed that actually applies to the FFRs (the dominant features in these domains) and so is the ZSC for the domain. However, there are much faster retrograde speeds within the FFRs.
Further details on individual jets [these & more refs. are all in appropriate sections below]:
The NTBs jet:
Ref.J19 = JBAA ‘NEB Paper III. The ‘great northern upheaval’ in 2012.’
Ref.R42 = Report 2024/25 no.5: ‘The NTBs jet outbreak’.
The NEBs jet:
Refs.J17 & J18 = NEB Papers I&II.
Ref.R8 = Report 2021/22 no.10 inc. Appendix 1.
EPSC2022-17.
The SEBn jet:
Ref.J34 = JBAA ‘Influence of Jupiter’s South Equatorial Disturbance on jet-stream speed’
Ref.J35 = Icarus ‘Longitudinal variation and waves in Jupiter’s south equatorial wind jet.’
Ref.R7 = Report 2023/24 no.3, ‘The major jets’ (inc. Appendices)
The SEBs retrograding jet: (See references in section below)
The STBn jet:
Ref.R15 = ‘S. Temp. domain… 2001-2012’
Ref.R16 = ‘S. Temp. domain… 2012-2015’.
The S2 (SSTBn) to S5 jets:
Ref.R3=R19 = Southern high-latitude domains, 2001-2012.
Ref.R20 = S2 domain, 2012-2023.
The Juno spacecraft, mapping Jupiter’s gravitational field, has shown that the major jetstreams (especially the NTBs jet) extend down to 2500-3000 km but no deeper, agreeing with theoretical predictions that they are restricted to this depth by magnetohydrodynamic effects where the deep atmosphere becomes electrically conducting, and they comprise a pattern of cylinders parallel to the planet’s axis [Refs J5 & J6 = Kaspi et al., 2018, 2023].
Outbreaks of dark spots on jets:
On the NNTBs, NTBs, and (retrograde) SEBs jets, historical visual observers sometimes recorded outbreaks of small dark spots. Spacecraft images and modern amateur images showed that these were typically anticyclonic vortices, ‘rolling’ along the anticyclonic side of the jet peak with a drift rate ~10 m/s less than the peak jet speed [Refs. J1 & J7; &
Ref.R26 = ‘Jupiter in 2007…’ (inc. Part 3, p.4, box: “The speeds of the SEBs and STBn jets”);
[& see refs. on individual jets below].
Our records suggest that they often appear in association with turbulent regions in the belts: some way downstream of FFRs in the NNTB [see section below], and of the perennial rifted region of the SEB following the GRS. Apparently similar spots are sometimes observed on the SSTBn jet; and also on the STBn jet, downstream of turbulent dark segments of the STB, but those on STBn usually show little or no vorticity [Ref. J1; Refs. R15, R16, R18 = our long-term reports listed in S.Temp. section below].
2. Local circulations
‘Spots’ (except in the equatorial region) are mostly organised circulations, either cyclonic or anticyclonic.
2.1. Cyclonic circulations
Those observable from Earth mainly fall into three categories, and spacecraft reveal a low-contrast fourth type. Most domains exhibit most or all of these types, for at least some of the time:
(i) Dark ovals or oblongs, often dark reddish-brown (including ‘barges’ in some belts and long belt segments in others);
(ii) White ovals or oblongs;
(iii) Turbulent convective regions (commonly called ‘rifted regions’ at low latitudes, ‘folded filamentary regions’ (FFRs) at higher latitudes, where they are the dominant features);
(iv) Pale oblongs (recognisable in spacecraft images as a stage in evolution of a dark or white oblong).
In conjunction with the JunoCam images, we have defined them most clearly in the S1 and S2 domains (STB and SSTB), where any type can convert into any other:
Ref.R18 = ‘S.Temp. Domain, 2018-2024’
Ref.R20 = ‘S2 domain, 2012-2023’
EPSC2024-362, EPSC2024-378.
For information on the lifetimes of FFRs, see those references and also the section on the NNTB below.
It is common for dark spots or oblongs in mid-latitude domains to turn reddish before fading away (sometimes persisting as pale oblongs) or turning white:
Ref. J13 = JBAA ‘Jupiter in 2001/02.’ [Part 2, p.215]
Ref.R15 = ‘S. Temp. domain… 2001-2012’
Ref.R3=R19 = ‘Southern high-latitude domains, 2001-2012.‘
Ref.R20 = ‘S2 domain, 2012-2023’
In the SEB and NEB, brown ‘barges’ were observed to turn white in the 2010 SEB Fade and the 2021 NEB Fade (see sections below).
Jet speeds are faster on the edges of cyclonic oblongs, at least sometimes. This is consistently true for the STBn jet, and had also sometimes been recorded for the STBs jet. We have also found it to apply to a pale sectors of NTB [Ref.R6 = ZWPs, 2014 Feb & April] and SSTB [Ref.R20 = ‘S2 domain, 2012-2023’].
Convective outbreaks, seen as bright white (and methane-bright) spots, are continually occurring on a large scale in ‘rifted regions’ of the SEB and NEB, and on a smaller scale in FFRs at higher latitudes. In the SEB (though not the NEB), they commonly begin with a plume erupting within a cyclonic circulation (see section below). Likewise, we have seen new FFRs initiated by bright plume outbreaks in the NTB [Ref.R21 = Report 2013/14 no.6], STB [2010, 2018, 2020, 2021, 2025 – see Refs R15-R18 in section below], and SSTB (2025: Report 2025/26 no.2.]
It is increasingly clear that convective or turbulent activity in cyclonic regions, including vigorous convective plumes, is of prime importance in driving weather phenomena on Jupiter, including [for references see regional sections below]:
–Driving the jets: A classic study of the SEB rifted region following the GRS, from the Galileo Orbiter, indicated that the white plumes are thunderstorms whose expansion generates vorticity that ultimately feeds into the SEBs jet [Refs.J14a&b]. This is believed to be a general process in many belts by which Jupiter’s internal heat is transduced into energy to maintain the jets.
–Controlling speed of adjacent AWOs, viz. oval BA (S1 domain) & in high-latitude domains.
–Generating dark spots (vortices) on jets, some way downstream of a rifted region (SEBs) or FFR (STBn, NNTBs).
–Generating slow-moving or retrograde spots following FFRs, in many domains (e.g. N1, S1, S2, S3).
–Initiating and/or driving large-scale upheavals, viz.:
SEB Revivals and mid-SEB outbreaks: All recent examples have started with an intense convective outbreak within a mini-barge (SEB Revivals in 2007 and 2010, and mid-SEB outbreaks in 1979, 2016, & 2024), and this may be generally true. The ongoing convective outbreak (rifting) then generates other features of the Revival including the eventual revival of the dark belt.
NEB expansion events also involve convective outbreaks (‘rifts’) in the early stages but they occur in the NEB shear zone; curiously NEB rifts often appear adjacent to a barge but never inside one. Rifts can directly induce instability on the NEBn retrograding jet, and anticyclonic dark spots in the NTropZ, initiating the broadening of the dark belt [Ref.J1; Ref. R23 = ‘Relationship of NEB rifts to NEB expansion events.’; Ref. J17 = JBAA NEB Paper I].
NTBs jet outbreaks consist of extremely intense plumes but on the peak of the jet. The wake of the plumes disrupts the whitened NTB leading to revival of the dark belt.
2.2. Anticyclonic circulations
These are the longest-lived circulations on the planet, present in almost all domains. The GRS is the largest one. The others are anticyclonic white ovals (AWOs) and reddish ovals (‘little red spots’, LRSs), and smaller darker vortices. The reddish ovals tend to be the largest and longest-lived, in the S1 domain (Oval BA), N2 domain (NN-LRS-1), and S4 domain (S4-LRS-1) [Ref. J4 = ‘Jupiter’s high-latitude storms: A Little Red Spot tracked through a jovian year’], although their colour can fluctuate and shorter-lived LRSs are occasionally observed.
Large ones have never been observed to disappear except by merging with others (except in the N. Tropical domain). Small ones can be short-lived: in the S2 domain, where they have been best documented, they rarely last for more than 2 years. The longest-lived ones, still present in 2025, have been tracked back in the N5 domain (since 2015 or 2010) [Ref.R9], the N2 domain (NN-LRS-1 since 1993, & WS-4 since 2003) [Ref. J4], the N. Tropical domain (White Spot Z, since 1997) [Ref.R24], the S1 domain (oval BA, since 2000; its precursor AWOs dated from around 1940) [Refs.J1 & R14], the S2 domain (some since 1986) [Ref.R19], and the S4 domain (S4-LRS-1, since 1994 or 1987) [Ref.R19]; and of course the GRS (since 1831 or possibly 1665) [Ref.J1 & Ref.J45]. In most cases the ovals may have already existed long before ground-based observers were able to detect them.
Thus we have not observed the formation of new large anticyclonic ovals in modern times, except in the N. Tropical domain, where they commonly form after the periodic NEB expansion events, probably by instability of the retrograding NEBn jet [Ref.J1 & Ref.J17]. Medium-sized AWOs have been observed to form following turbulent cyclonic regions with merging of smaller vortices, in the S1 and S2 domains [see sections below]. Drifting and merging of smaller vortices can also contribute to reconnection of opposing jets that forms the large-scale hemi-circulation of a S. Tropical Disturbance [see Ref.J1 & section below].
Mergers of anticyclonic ovals were described in [Ref.J15], & subsequent mergers have been described in our interim reports in the N. Tropical, S2, and S4 domains [see sections below].
In high-latitude domains (N5, N4, N2; S3, S4), AWOs in the poleward side of the domain often move with fast drift rates, but show sudden unpredictable changes in speed, all related to latitude according to the ZWP. Circumstantial evidence suggests that some of these speed changes are caused by interactions with FFRs: specifically, that high-latitude AWOs naturally drift fast, but can be blocked by encounters with FFRs moving with the ZSC [Ref.R10 = ‘Jupiter’s high northern latitudes…’]; likewise in the N2 domain: [Report 2015/16 no.13]. They can also be blocked upon encountering the leading spot in a chain of retrograding small dark spots, e.g. in the N2 domain [Ref.R25 = ‘Jupiter in 2005 & 2006’] & S3 domain [in 2011: Ref.R19 = Southern domains…, & Ref.J16].
______________________________________________________________________________________
3. Global Upheavals
The most impressive phenomena on Jupiter are cyclic upheavals in three of the major domains: the NTBs jet outbreak (NTB Revival), the NEB Expansion Event, and the SEB Fade/Revival. They are described in the sections below, but first we note their common features. All occur with periods of 3-5 years, although sometimes they cease for over a decade. All involve outbreaks of one or more vigorous convective storms, which initiate the NTB and SEB Revivals, and develop to revive or expand the dark belt after a period of quiescence. [See Ref.J19 = JBAA NEB Paper III, & Ref.J28 = Fletcher (2017).]
Another impressive cyclic phenomenon is the EZ coloration episode, which often overlaps with cloud clearing in the thermal-infrared with a period of ~7 years, but this does not involve any local storm outbreaks.
A Global Upheaval is a near-simultaneous occurrence of major phenomena in several domains. It was defined in the 1970s [Ref.J1], and recurred in 1990 and then again in 2007. With more detailed understanding of the various phenomena, we concluded that it essentially consists of three largescale phenomena that occur within a year or so, although they can also occur separately: a NTBs jet outbreak, EZ coloration, and a SEB Fade/Revival.
Our discussion as of 2007 was in these reports:
Ref.J37a [=R27] = ‘Jupiter embarks on a global upheaval’;
Ref.R28 = ‘The NTBs jet …& the nature of global upheavals.’
Our main recent discussion of these phenomena is: [Ref.J19 = NEB Paper III].
Since 2007 there have been no global upheavals as previously defined, but in 2012, a NTBs outbreak coincided with EZ coloration and a NEB Fade/Revival, producing a dramatic spectacle of colour and disturbance from ~0 to 40°N, which we nicknamed a ‘Great Northern Upheaval’. Whether this was an organised disturbance across multiple domains, or just a coincidence, is undetermined. Similar coincidences of a NTBs outbreak, EZ coloration, and a NEB expansion event, occurred in 2016/17 and in 2020, although the relative timing of the events was not the same, and the inexact 3-5-year periodicities of the NTB and NEB cycles were maintained. There may also have been a ‘Great Northern Upheaval’ in 1926-27 [Ref.J19 = NEB Paper III; & see sections below]
______________________________________________________________________________________
4. Multispectral imaging (Infrared, Methane-band, etc.):
Imaging in the 889-nm methane absorption band is particularly useful for showing the altitudes of the cloud-tops or hazes, and imaging in near-infrared continuum, ultraviolet, and some other wavebands also enhances our view of the planet.
For specific accounts of multispectral images, see our reports for the apparitions of 1997, 1999/2000 (Part II), and 2000/2001 (Part II), all available under ‘Publications – Full Section Reports’, as follows:
Ref.J21 = ‘Methane band images of Jupiter, 1995-1997.’ (Appendix).
Ref.J9 = ‘Jupiter in 1999/2000, Part II: Infrared wavelengths.’
Ref.J11 = ‘Jupiter in 2000/2001: Part II: A review of multispectral imaging…’
… and shorter summaries in recent interim reports:
Ref. R29: ‘Jupiter in 2007: Multispectral Imaging’
Ref. R30: ‘Multispectral imaging of the EZ and NTB coloration events’
Subsequently we have not posted reports specifically on non-visible wavelengths, but methane-band images are included in many of our regular reports.
An online BAA seminar on 2023 March 2 showcased four amateurs developing special techniques (C. Pellier, B. Adcock, A. Cidadao, S.M. Hill), and a video of it is on our web pages:
‘Multispectral imaging for analysis of Jupiter’s atmosphere’ (2 hours)
https://britastro.org/videos/multispectral-imaging-for-analysis-of-jupiters-atmosphere
Also see Adcock’s work in: EPSC2019-1843.
A recent professional study of various features such as we track, from Hubble and ground-based IR images is Ref.J59 = ‘Deep Clouds on Jupiter’.
Ammonia distribution:
Ammonia is one of the most important vapours in Jupiter’s atmosphere, though mostly sequestered below the clouds. Steve Hill (in Colorado) has developed a novel method for imaging and measuring the ammonia abundances above the clouds by imaging in weak absorption bands for NH3 and CH4. His paper on this, in collaboration with Prof. Patrick Irwin, is
[Ref.J22 = https://doi.org/10.1029/2024EA003562]
and a follow-up by Irwin using his professional spectra confirms Hill’s results:
[Ref.J23 = https://doi.org/10.1029/2024JE008622].
It concludes that the visible cloud-tops are much deeper than is usually assumed, at 2-3 bar pressure, and cannot be made of pure ammonia ice. Also see Hill’s EPSC abstracts:
EPSC2022-802. https://doi.org/10.5194/epsc2022-802.
EPSC2024-160. https://doi.org/10.5194/epsc2024-160.
EPSC2025-1174. https://doi.org/10.5194/epsc-dps2025-1174.
____________________________________________________________________________
PART II. REGIONAL PHENOMENA
5. High northern domains (N3 to ‘N7’)
(For the north polar polygon, as observed by JunoCam, see final section herein.)
Little was known of the regions north of 47°N until spacecraft viewed the planet and then, from around 2010 onwards, amateur imaging became able to resolve numerous features in these high latitudes. We posted a detailed pre-Juno account covering the N3 to N6 domains [Ref.R10 below], and then full analyses for the apparitions of 2020, 2021/22, 2022/23, and 2024/25, combining JUPOS tracking data with feature identification on JunoCam and Hubble maps, covering the N4, N5 and N6 domains and all the way up to 75°N. References:
Ref.R10 = ‘Jupiter’s high northern latitudes…’ (2017)
Ref.R11 = Report 2020 no.9
Ref.R12 = Report 2021/22 no.9
Ref.R13 = Report 2022/23 no.6
Report 2024/25 no.7
EPSC2022-16.
The N6 and N3 domains are both narrow, with only sparse features, all of which are prograding as there is no retrograde jet. The N6 domain approximately coincides with the ‘Bland Zone’ (~63-68°N) as seen in JunoCam images. The region further north is covered with the methane-bright, semi-transparent North Polar Hood, often observed by JunoCam. It has wavy edges; see our PJ45 report for an amateur measurement of its longitudinal rotation.
North of the N7 prograde jet (mean latitude 68.4°N) is the northernmost belt, comprised of FFRs; this may be called the ‘N7 belt’, but there is not a regular ‘N7 domain’ as no jets are known further north. We obtained the first ZDPs for this belt, up to 75-76°N, in 2022/23 and 2024/25 [Ref. R13 & Report 2024/25 no.7, & EPSC2022-16; links above]. The FFRs in the ‘N7 belt’ move with a weakly retrograding current as in the N5 and N4 domains [same references].
The N5 and N4 domains are broad, and largely filled with FFRs. They also produce the highest frequency of lightning flashes on the planet, as detected by spacecraft [Refs. R10 & J24]. In [Ref.J24 = Fletcher et al.(2025)], we have used Juno MWR and JunoCam maps to show that most or all of the strong flashes come from conspicuous bright white storms within the FFRs.
Our ZDPs for both domains coincide with spacecraft ZWPs (apart from a curious latitude offset in northern N5), and are ‘blunt’, with a modest retrograding speed over a wide range of latitude. This is the zonal slow current, representing the drift rate of the FFRs and other spots including low-latitude AWOs. No rapid-retrograde jet is detected, and perhaps does not exist outside the FFRs, although such speeds must be present in the northern edges of the FFRs. In the more northerly ranges of the N5 and N4 domains, AWOs move with faster or oscillating drift rates related to latitude. Possibly, northerly AWOs here (and in the N2, S3 and S4 domains, as noted above) always tend to move fast but are impeded by interactions with FFRs [Ref. R10 = ‘Jupiter’s high northern latitudes…’ (2017); & Ref.R11 = Report 2020 no.9]. We show examples of these interactions in our reports, and [Ref.J25] shows an example in Cassini imagery. We have also recorded many interactions between AWOs, in [Refs.R10-R13; links above], and earlier in Report 2014/15 no.12 & Report 2016/17 no.10 (Appendix 3).
Some AWOs in N4 and N5 are long-lived, but difficult to track between apparitions due to their huge unpredictable changes of drift rate. The largest is one in N5 that has been tracked (with aid from JunoCam maps during solar conjunctions) from 2015 to 2025, and this must have been one of two that existed as far back as 2010 [Ref.R9 = AWO in N5, 2015-2023]. On four occasions, we have recorded an AWO moving from the N4 domain across the N4 jet into the N3 domain [Report 2011/12 no.9; Report 2017/18 no.6; Ref.R12 = Report 2021/22 no.9; Ref.R13 = Report 2022/23 no.6] – the only known instances of a coherent circulation crossing a prograde jet, except for one similar instance from N3 to N2 [Report 2021/22 no.9].
___________________________________________________________________________________
6. N.N. Temperate (N2) domain & jet
6.1. NNTZ ovals
In [Ref.J4], we analysed the anticyclonic ovals in the NNTZ, and identified one which has existed since 1993 or earlier, named NN-LRS-1. The interaction of the ovals with the wind speed gradient across the NNTZ, leading to offsets in ZDPs, is considered in detail.
Ref.J4 = ‘Jupiter’s high-latitude storms: A Little Red Spot tracked through a jovian year.’
Follow-up report in 2012: Ref.R31 = ‘NNTZ: Anticyclonic ovals, 2008-2012’
Subsequent follow-ups include Report 2020 no.9 and Report 2021/22 no.10.
(The latter confirmed the ZDP offsets as shown previously, viz. LRS-1 < WS-6 < other AWOs).
As of late 2025, there are still two long-lived ovals: NN-LRS-1 which has been tracked since 1993, and NN-WS-4 which has been tracked since 2003. WS-6 existed from 2010 (or probably 2008) to 2024; it was reddish in 2016-17, and disappeared in 2024 July [Report 2024/25 no.7].
Timelines of FFRs and other NNTB sectors have been covered in our final reports for recent years: Report 2015/16 no.13; Report 2019 no.9; Report 2020 no.9; Report 2021/22 no.10, & Report 2022/23 no.6.
6.2. NNTBs (N2) jet
This jet can serve as a model for Jupiter’s non-equatorial jets: it is uncomplicated, well-defined, and well-observed, and it usually carries typical dark spots (anticyclonic vortices) with reproducible speed. Spacecraft values for its peak speed are surprisingly diverse, perhaps depending on how much they are affected by the jetstream spots, but they are all faster than these spots, by an average of ~18 deg/30d (7 m/s), consistent with the jetstream spots being vortices ‘rolling’ along the S edge of the jet peak as was shown by Voyager. We have not done a systematic review of this jet, but results from apparition reports are as follows:
The mean speed (from jetstream spots) was DL2 = -77 (±5) deg/30d from 1929-1991 [Ref. J1], -78.7 (±1.5) from 1999-2004, and -84.8 (±1.7) from 2004-2008 (from JUPOS data in our reports). The increasing speed may be due to improving images and analysis. Thorough JUPOS analysis in 2005 & 2006 [Ref.R25 = ‘Jupiter in 2005 and 2006: Final report.’] & in 2011/12 [Ref.R32 = Report 2011/12 no.9] & in early 2015 [Ref.R33 = Report 2014/15 no.12] showed similar speeds for the majority of spots, plus others slower and faster which followed an anticyclonic gradient from the jet peak southwards, again consistent with the dark spots ‘rolling’ along the jet peak. Taken together, these results suggested that the true peak speed of the N2 jet (at least in some sectors and epochs) is around DL2 ~ -104 (±5) deg/30d at 35.6 (±0.2)°N [Ref.R33 = Report 2014/15 no.12].
We have noted evidence [in Ref.21 = Report 2013/14 no.6; Report 2014/15 no.12; & Report 2015/16 no.13] suggesting that the jetstream spots tend to develop a short way downstream of a FFR in the NNTB, although this is not fully confirmed.
Whereas the older literature suggested that outbreaks of NNTBs jet spots were distinct events, often occurring a year or so after a NTBs jet outbreak, more recent data shows that a large number of NNTBs jet spots is normal, but they are usually suppressed when a NTBs jet outbreak occurs, only to recover a year or so later. This was noted in:
Ref.R34 = ‘Progress of Jupiter’s great northern upheaval 2012…’
Ref.J19 = NEB Paper III
Ref.R11 = Report 2020 no.9
_____________________________________________________________________________________
7. N. Temperate (N1) domain & jet
The phenomena of this domain are linked to the cyclic outbreaks on the NTBs jet (see below); but first we describe a phenomenon of the NTZ and NTBn retrograding jet:
7.1. N.Temperate Disturbance
This is a darkening of a sector of the NTZ, which can last for several years. Some NTD’s have developed ~2-3 years after NTBs super-fast jetstream outbreaks, as happened in 2009:
Ref.R35. ‘Jupiter in 2009: Interim Report, with new insights into the NTZ disturbance, NEB expansion, and SEB fading.’
Ref.R36. ‘Jupiter’s North Temperate Region in 2009: The nature of the North Temperate Disturbance.’
Ref.R37. ‘North Temperate Disturbance (NTD) in 2010, and a general conjecture about the behaviour of anticyclonic dark spots’
Ref.R38. ‘North Temperate Disturbances: Is NTB rifting necessary?’ (A historical survey showing that previous N.Temperate Disturbances have always been associated with ‘rifts’ in the NTB if photographed at sufficient resolution.)
Ref.R39. Life cycle of the North Temperate Domain and Disturbance, 2009-2012
Further examples began in 2013 and 2018, as follows. These recent well-observed examples showed that there is not generally recirculation in the NTD; it seems to be essentially a region of cloud disruption in the wake of a NTB rifted region. References: Report 2013/14 no.6 ; Report 2013/14 no.10; Report 2014/15 no.3 ; Report 2014/15 no.12; Report 2015/16 no.13.
Ref.R6 (= Report 2013/14 no.10) showed that the ZWP was normal in the NTD (although an unrelated cyclonic pale oblong in the NTB had very rapid circulation).
Report 2015/16 no.13 showed the NTD still present following a rifted sector in 2015/16. This rifted sector survived through the 2016/17 NTBs outbreak, which also failed to eliminate NNTBs jet spots; and after the outbreak, there was again a NTD following the rifted sector in 2018 [Report 2018 no.6] & 2019, which regressed from 2020 March [Ref.R11 = Report 2020 no.9]. JunoCam gave several fine views of the NTB rifted sector from PJ6 to PJ14.
___________
7.2. The NTBs jet stream (N1 jet) & NTBs outbreaks (NTB Revivals)
The NTBs jet alternates between two states. The ‘fast’ state was stable from 1991 to 2003 with long-lived vortices travelling along the jet at DL1 ~ -60 deg/30d (u3 ~ 125 m/s). In contrast the ‘super-fast’ state comprises sudden energetic outbreaks of brilliant plumes at DL1 ~ -150 to -160 deg/30d (u3 ~ 165-170 m/s). These super-fast outbreaks occurred every 5 years from 1970 to 1990 (assuming one during solar conjunction in 1985) [Ref.J1], and then again, every 4-5 years, from 2007 to 2025. Figure 3 gives a time-line of these cycles in terms of the cloud-top wind speeds:
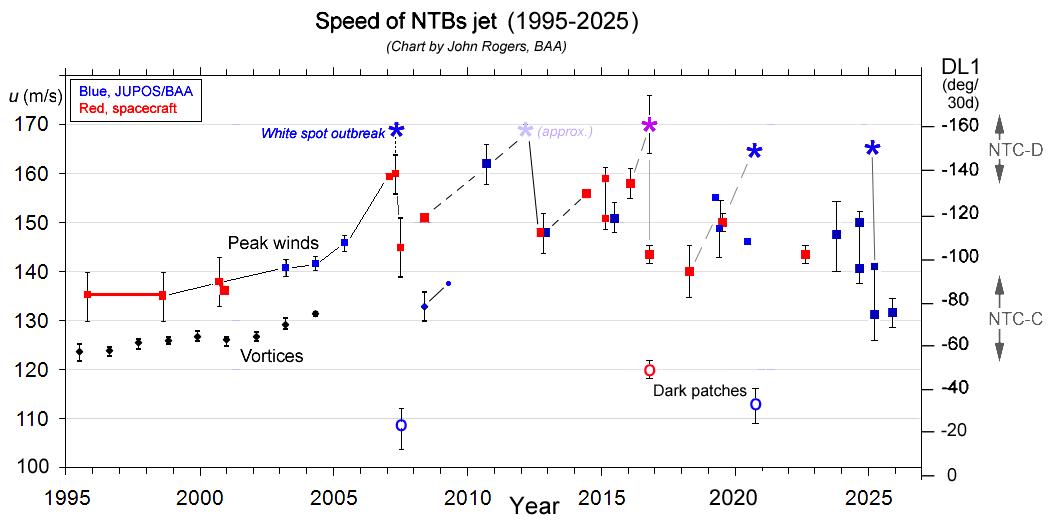 Figure 3
The cycle begins with the belt faded to near-invisibility, then 2 to 4 super-bright elevated plumes erupt which prograde faster than anything else on the planet, with a turbulent wake forming behind each one. The disturbance takes several months to go to completion, with each plume disintegrating just after it catches up with the next wake ahead of it. This is followed by revival of the dark NTB with an orange S component and a dark grey N component. These then fade gradually over the subsequent years before the next outbreak. We reviewed these outbreaks up to 2012 in [Ref.J19 = JBAA NEB Paper III].
We tracked the gradual acceleration of the NTBs jet before the 2007 outbreak:
Ref.J26 = Icarus ‘Renewed acceleration of the 24°N jet on Jupiter.’
The super-fast outbreaks started on the following dates:
— 2007 March 25 (HST)/ 27 (ground-based); two major plumes appeared simultaneously; followed by thick orange aerosol over the revived belt from mid-2007 through 2008, then gradual fading. [See ‘Reports 2007’, & Ref.R40 = ‘The NTBs Jet in 2007 and 2008: Evidence on the structure of the jet and the nature of global upheavals.’ ]
–2012 April 12 (estimated; discovered April 19); immediately before solar conjunction so most of the outbreak was unobserved. [See: Reports 2012/13 nos.1-4 , & Ref.J19 = NEB Paper III.]
–2016 Sep. 15 (estimated, ±5 days?), during solar conjunction. The earliest images were distant views from JunoCam on Oct.11-14, followed by the NASA IR Telescope Facility and amateur observers from Oct.16 onwards. 3 or 4 major plumes (we have re-interpreted the fourth as a wake-induced plumelet). [Ref.R41 = Report 2016/17 no.1; Ref.J27 = GRL https://doi.org/10.1002/2017GL073421 (& see Ref.J28 = GRL https://doi.org/10.1002/2017GL073806); & EPSC2017-332.]
–2020 Aug.18. Three major plumes. This was the most thoroughly observed outbreak to date: initial account in Reports 2020 nos.6 & 7, and full analysis in Report 2020 no.9.
–2025 Jan.10. Three major plumes, plus numerous wake-induced plumelets (which can also be identified in the outbreaks of 2020, 2016 (possibly), and 2020). This was again thoroughly observed, and we obtained ZWPs just before and during the outbreak, contrasting cloud-top variations with the motions of the super-fast plumes, and reviewing previous ZWPs to show how they change consistently through the 4-5-year cycle. [Ref.R42 = 2024/25 report no.5; EPSC2025-45 & EPSC 2025-51]
8. N. Tropical domain & NEBs jet
8.1. AWOs in NTropZ/NEBn
White spot Z (anticyclonic white oval):
This long-lived AWO in the NTropZ appeared in 1997 and was initially the strongest and fastest-moving AWO in the domain. It is still present in 2025 although now little different from other AWOs. It briefly turned reddish in 2013.
Ref.R24 = ‘White spot Z: its history and characteristics, 1997-2013’
EPSC2015-82 = ‘The major circulations in Jupiter’s North Tropical domain.’
Mergers of anticyclonic white ovals, and of cyclonic barges in NEBn:
Ref.J15 = Rogers et al.(2006, Icarus) = ‘Merging circulations on Jupiter: observed differences between cyclonic and anticyclonic mergers.’
Ref.R25 = ‘Jupiter in 2005 & 2006’
Ref.R5 = Report 2012/13 no.9, Appendix 2 = ‘NEBn: Dynamic interactions of spots’
(& see Ref.R5 for others in 2006-2010).
Further examples of well-observed mergers of AWOs include: Report 2024/25 no.2.
_______________________________________________________________________________________
8.2. N. Equatorial Belt (NEB)
NEB cycles:
The NEB undergoes a cycle with period 3-5 years, marked by rapid broadening to the north followed by gradual recession [Ref.J17 = JBAA NEB Paper I]. The NEB Expansion Event (NEE) typically begins with an outbreak of a bright ‘rift’ that is more northerly and slower-moving than usual; this is often involved with the first ejection of dark material northwards, but typically the rift also expands southwards across the width of the NEB. NEBs dark formations (NEDFs) are also affected. After the dark belt has expanded north, an array of dark cyclonic ‘barges’ and AWOs develops around the planet. The dates of onset of NEEs were as follows, and Figure 4 gives a time-line in terms of the width of the dark NEB:
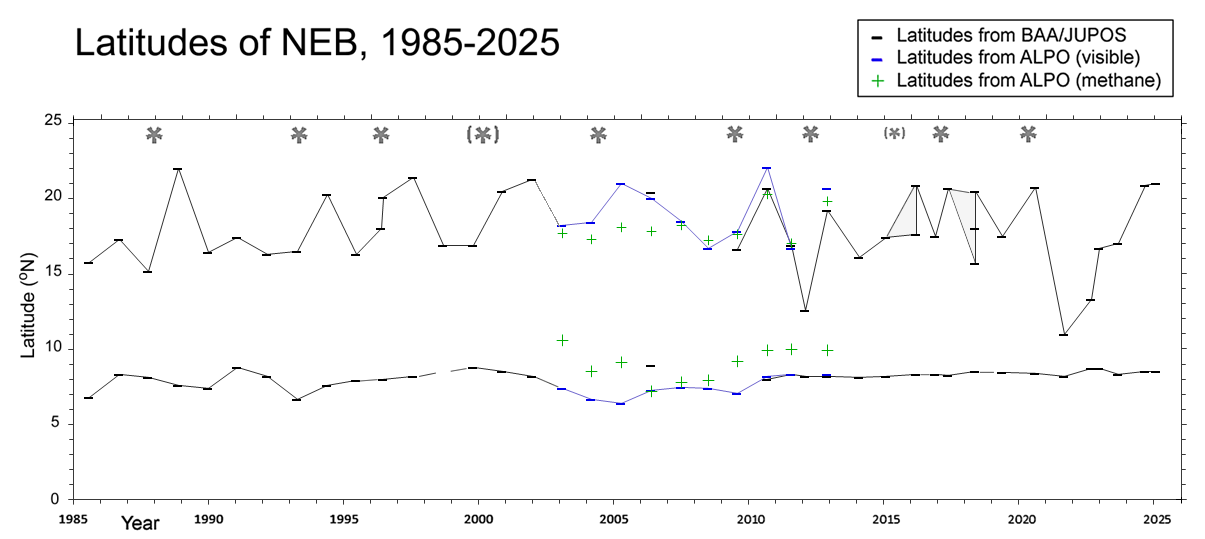
Figure 4.
Dates of onset of broadenings [from Ref.J17]:
1987/88 (began 1987 Dec)
1993 (began 1993 March) [Ref.R43 = Interim report for 1993.]
1996 (began 1996 April) [Ref.J29 = ‘Jupiter in 1996’ in JBAA]
1999-2000 (slow & irregular, from 3rdQ 1999 to late 2000)
[Ref.J8 = final report for 1999/2000, & Ref.J10 = final report for 2000/2001]
2004 (began 2004 Feb-April) [see Report 2003/04 no.5, inc. a ZDP, and notable colours including a greenish dark spot]
2009 (began 2009 May):
For a summary and discussion up t0 2009/10, see:
Ref.R35 = ‘Jupiter in 2009: Interim Report, with new insights…’
Ref.R44 = ‘Relationship of NEB rifts to NEB expansion events’
Ref.J17 = JBAA NEB Paper I
Dates of onset of broadenings [continued; further details follow]:
2012 (began 2012 March) – exceptional fading & revival.
2016-17 (after incomplete NEE in early 2015, full NEE began in late 2016)
2020 (began 2020 Feb.)
2023-24 (after exceptional fading & revival, full NEE began in 2023 Oct.).
_ _ _ _
2012: A more extreme version of this cycle occurred: a Fade and Revival of the NEB, perhaps comparable to those of the SEB. These were common a century earlier, but none had occurred since 1926-27. During the Fade in 2011-12, the NEB became totally quiescent with no visible convective activity or rifts, and no NEDFs, and the NEBs jet accelerated dramatically (see below). The Revival apparently started from a white spot (rift) at 9.5°N on 2012 March 8, just before solar conjunction. Therefore most of the Revival was not observed, and the belt was mostly fully broadened and chaotic-looking when observations recommenced in 2012 June. Observations of another Fade & Revival in 2021-22 (see below) suggest that the process may have been more complex than a typical NEE. [See ‘Reports’ for 2011/12 (esp. nos.5 & 9) & 2012/13 (inc. Ref.R34); EPSC2013-384; Refs. J18 & J19 = JBAA NEB Papers II & III].
2015-16: There was some northerly rifting and disturbance from late 2014, leading to a slow and incomplete expansion event in mid/late 2015, but this extended only half way round the planet by 2016 Feb., then regressed. [Reports 2015/16 nos.3 & 13; & EPSC 2019-302]
2016-17: After northerly rifts appeared in 2016 Oct., a rapid and complete NEE occurred in early 2017, complete by June
[Reports 2016/17 (esp. nos.4,10,11) & EPSC 2019-302 & Ref.J20 = Fletcher et al.(2017, GRL)].
The subsequent growth of AWOs and barges: Reports 2016-17 nos.10 & 11.
2020: A complete NEE occurred in the first half of 2020; it started in mid-Feb. when a bright spots at ~14°N initiated a complex expanding rift system, which led to NEBn broadening around the planet, complete by late June [Reports 2020 nos.4 & 9].
In 2021, the northern part of the NEB retreated again, normally at first but with exceptional fading from June onwards. This initiated a NEB Fade & Revival in 2021-22, as in 2011-12. Most of the NEB faded except for a narrow red-brown NEB(S), and the dark barges, which were faster-moving and slightly further south than usual, as in 2011-12 [Reports 2021/22 nos.2 & 10]. All convective and turbulent activity disappeared, as did all the NEDFs, and the NEBs jet again accelerated (see below). This time the revival was well observed, by Juno’s instruments as well as by amateurs, and it was not a dramatic upheaval. Instead, small short-lived bright outbreaks developed within a slow-moving sector of the residual dark red-brown NEB(S), at 10°N, and these gradually led to dark material spreading northwards to produce a slow, partial revival of the dark belt. [Reports 2021/22 nos.2, 6, 7, 10; & EPSC2022-17, & Ref.J30 (ref. below)]. This was different from the usual NEE process, and perhaps unrelated to it, as a NEE then developed 3-4 years after the last one.
The small bright outbreaks that drove the slow revival were not unusual (similar outbreaks often occur in normal times – e.g. our report on PJ20), but in 2021-22 they were the only convective activity in the belt, and three of them were closely imaged by JunoCam (at PJ38, PJ39, PJ44; see our reports). Juno detected lightning bursts from them, and one was thoroughly documented as a vigorous thunderstorm [Ref.J30 = Icarus ‘Multi-Instrument Sounding of a Jovian Thunderstorm from PJ38’], & Refs.J59 & J60]. They occurred intermittently in a limited sector of the NEB, which was therefore dubbed a ‘stealth superstorm’.
2023-24: In 2023 Oct. a major NEB rift appeared, and gradually initiated a typical NEB Expansion Event, which was complete by mid-2024. [Reports 2023/24 no.4 & 5]
Thermal/methane-dark waves:
Slow-moving thermal waves over the NEB, previously reported from professional infrared observatories, were shown by the Cassini spacecraft in 2000 to coincide with methane-dark waves. We showed that these waves arose from large-scale eddies in the tropospheric cloud layer of the broadening NEB [Ref.J11 = ‘Jupiter in 2000/2001: Part II’].
In 2009, similar methane-dark waves appeared, but were just one aspect of high-contrast visible waves.
A notable methane-dark wave pattern reappeared during the NEEs of 2015-2018 [Report 2015/16 no.13; Report 2016/17 no.10; EPSC 2019-302; Ref.J20 = GRL Fletcher et al.(2017)]. They appeared in 2015 and some persisted until the next NEE climaxed in 2017, and only diminished during 2018, as the NEB receded towards its normal width. There was no obvious correspondence with underlying visible circulation patterns in 2015-16 (although detailed analysis remains to be done), but by mid-2017 there was a striking pattern of waves that were both dark brown and methane-dark around most of the NEB.
During the 2020 NEE, there was only a short-lived, incomplete methane-dark wave-train in May, and a single very methane-dark patch later [Reports 2020 nos.4 & 9].
These waves represent clearances of high-altitude haze, probably coinciding with thermal waves, which may be forced by meridional waves in the retrograding NEBn jet in the main cloud deck
[Ref.J11 = ‘Jupiter in 2000/2001: Part II’: EPSC 2019-302; Ref.J20 = GRL Fletcher et al.(2017) ].
They appear in the later stages of some NEEs, but not all.
_____________________
8.3. NEBs jet & NEBs dark formations (NEDFs) (= ‘hot spots’)
The NEBs is usually marked by up to 12 of the well-known, prominent NEBs dark formations (NEDFs), also known as infrared ‘hot spots’ because they are largely cloud-free and therefore warm at 5 microns wavelength. They were historically called ‘projections’ but this is inappropriate because they are distinct weather systems, not extensions of the NEB.
They are believed to be Rossby waves, and they follow a suitable dispersion relation between their speed and their spacing [e.g. Ref.J31 = Arregi et al.(2006, JGR)], which was supported by our results in 2007:
[Ref.R26 = ‘Jupiter in 2007: Final numerical report’ (Part 4), & subsequently [Ref.J17 = JBAA NEB Paper I].
Ref.J17 [= JBAA NEB Paper I] is our full account of the NEDFs and the NEBs jet behaviour, including the background from the professional literature, and defining three speed ranges that are observed for this jet: normal, fast, and super-fast.
The normal speed of the NEBs jet is close to System I (u3 ~ 100-110 m/s); this is the speed of the NEDFs, but as Rossby waves they would be travelling more slowly than the wind speed. Sometimes there are also smaller, more closely spaced features moving with a faster speed (u3 ~ 120 m/s); they fit onto the same dispersion relation so are probably smaller versions of the same wave type (Ref.J17). But rarely, all the typical NEDFs disappear and remaining small features develop a ‘super-fast’ speed of u3 ~ 140 m/s. This occurred during the extreme NEB Fades in 2011-12 and 2021-22 [Ref.J17, & Report 2021/22 no.10, & EPSC2022-17].
The Galileo Probe descended into a NEDF and experienced a wind speed of u3 ~ 170 m/s, so it is likely that there is a permanent super-fast wind of ~150-170 m/s below the visible clouds (just as in the NTBs and SEBn jets), but the NEDFs normally suppress it at cloud-top level. The concurrent loss of visible ‘rifts’ and NEDFs, in turn, suggests that convective activity in the NEB is necessary to sustain the NEDF wave pattern.
9. Equatorial Region
9.1. Equatorial Zone (EZ): Coloration episodes
Episodes of reddish or yellowish coloration of the EZ, either in a broad Equatorial Band (EB) or more widely, have been noted throughout observational history [Ref.J1]. While some episodes display obvious yellow or orange or duller ochre colour, and can last for several years, other episodes show only a brownish-grey shade changing to neutral dark grey, and only last for 1-2 years. Orange shading tends to be diffuse and sometimes (but not always) methane-bright and so high-altitude, whereas dark grey colour (which includes the NEDFs and associated festoons) denotes clearance of the usual white clouds. However, it now appears that these are both aspects of one complex phenomenon: they fit a cycle of ‘equatorial disturbances’ with period of 6-7 years proposed on the basis of EZ cloud clearances revealed as brightening in the thermal infrared at 5 microns [Refs.J32 & J33 = Antuñano et al., 2018 & 2019]; see EPSC2026-392, & Figure 5 therefrom:
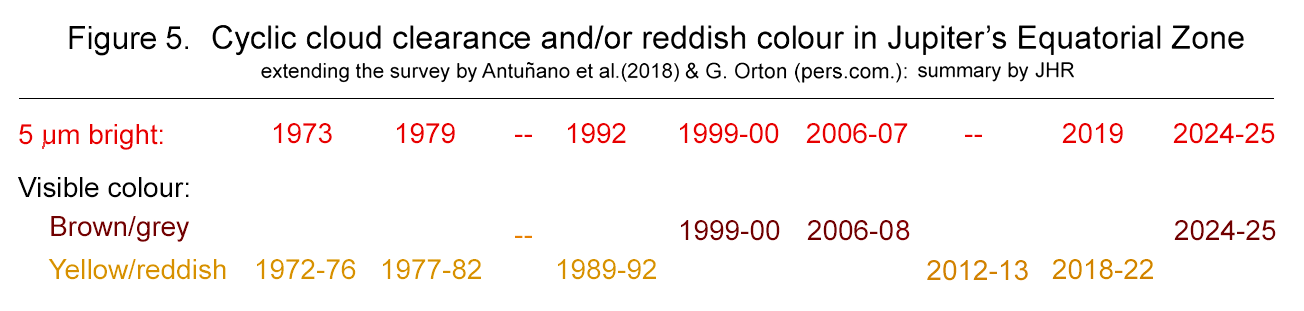 __________________________________________________________________________
List of coloration episodes since 1977:
(Those up to 1992 are described in Ref.J1; subsequent episodes were described in our interim reports and are summarised more systematically in EPSC2026-392.)
1977-82: Largely pure colour, strong yellow or ochre over most of EZ, but with grey EB component in 1978-79 and thereafter; then, yellow colour gradually retreating to EZ(S) and fading.
(1986: Although NEDFs and grey shadings were prominent, the EZ remained largely white so there was no coloration event.)
1989-1992: Started as pure yellow colour in late 1989, becoming brown or (eventually) grey in 1990-92, with the colour shifting southwards.
1999-2000: A brown EB developed in mid-1999, then became grey from 1999 Nov. to 2000 Jan.
(2002: Weak yellowish tint, not recorded as a distinct episode)
2006-2007: In 2006, dark features accumulated all across the EZ including a brown EB. In 2007, the whole EZ was largely grey-brown.
2012: Orange colour in an EB from June to August, coinciding with the vigorous revivals of the NTB and NEB (see above). It was not methane-bright. [Ref.J19 = NEB Paper III] & [Ref.R5 = Report 2012/13 no.9 Appendix 3].
2018-2022: Orange colour developed gradually in 2018 (March-May), and was intense in late 2018 and in 2019. It began on the equator then spread to most of the EZ except a narrow strip of white EZ(S). It was fainter in the first half of 2020, but revived in late 2020, and was intense during 2021. It faded away in the second quarter of 2022.
Stationary features in orange haze over EZ: During much of this episode, the orange EB was particularly methane-bright, and we detected waves on its S edge (in 2020) and large methane-bright patches (in 2021) that were almost stationary in System III (sic). [Report 2020 no.4 (Part III); & Report 2021/22 no.7; & EPSC2021-95] This is unprecedented, and suggests that the orange, methane-bright haze extended up to very high altitude.
2024-2025: A grey-brown EB gradually appeared from 2023 Dec. onwards, and was notable in 2024-25; it faded away in 2025 Dec.
________________________
9.2. SEBn jet & S. Equatorial Disturbance (SED)
The SED was a large wave-like feature in the SEBn jet, which existed from 1999 to 2009-10. (A similar SED existed from 1977 to 1989.) We defined and characterised it in the following papers: the first 3 are available under ‘Publications – Full Section Reports’:
Ref.J8 = Rogers et al. (2003), JBAA: ‘Jupiter in 1999/2000, Part I…’
Ref.J12 = Rogers et al.(2005),JBAA: ‘Jupiter in 2000/2001: Part III: The SED: A large-scale wave in a prograde jet.’
Ref.J34 = Rogers & Mettig (2008) JBAA: ‘Influence of Jupiter’s South Equatorial Disturbance on jet-stream speed’
& supplementary materials HERE. Also see: EPSC2011-169.
Ref.J35 = Simon-Miller et al. (2012), Icarus: ‘Longitudinal variation and waves in Jupiter’s south equatorial wind jet.’
or http://dx.doi.org/10.1016/j.icarus.2012.01.022
Ref.R45 = Rogers (2012): ‘The life of the South Equatorial Disturbance, 1999-2010’.
Subsequent SED-like tracks have occasionally been recorded, mainly as a slow-moving gap in the array of spots on the SEBn edge, but not consistently visible nor long-lived (e.g. one in late 2012 [Report 2012/13 no.9, Appendix 4]).
New SED, 2022-2025:
A new SED appeared in 2022 June, mainly tracked as a gap in the SEBn ‘chevrons’ [Report 2022/23 no.3], but it was usually inconspicuous visually until mid-2024. From then until late 2025, it was often prominent, and again the SEBn jet speed was reduced p. the SED [Ref.R7 = Report 2023/24 no.3, ‘The major jets’; Reports 2024/25 nos.1,2,7; EPSC2026-268].
SEBn jet speed: See [Refs J34 & J35] above, &:
[Ref.R7 = Report 2023/24 no.3, ‘The major jets’]: An overview of SEBn jet speeds since 1995 shows bimodal or trimodal distribution; and previous rapid speeds (DL1 ~ -100 to -115, u3 ~ 150-160 m/s) have not been evident since 2016.
___________________________________________________________________________________
10. S. Tropical domain
10.1. S. Equatorial Belt (SEB)
SEB Revivals
SEB Revivals, preceded by Fades, are among the most spectacular phenomena on Jupiter [Ref.J1]. They occurred in 1990, 1993, 2007 and 2010:
–1990: SEB fading in 1989; Revival started during solar conjunction in 1990 July (estimated) [Ref.J1].
–1993: SEB fading in 1992; Revival started on 2003 April 6. Our report is still unpublished; see [Ref.R43 = interim report; & Ref.J36].
–2007: Quiescence from 2006 Dec.; Fade started around 2007 March; Revival started on 2007 May 17. The Revival was somewhat atypical in that it started before the fading was complete, and the N. branch was blocked by the GRS, and the S. branch was blocked by one of two S. Tropical Disturbances. (See Reports 2007 online [esp. Ref.R26 = Final Report]; & News items in JBAA = Ref.J37 [esp. Ref.J37b = ‘The climax of Jupiter’s global upheaval’]).
–2010: Quiescence from 2009 June; Fade started around 2009 August; Revival started on 2010 Nov.9. This was the best-observed cycle to date. The following papers give a full account of it, & comparison with previous examples revealing new common features, & up-to-date explanations of the whole SEB Fade/Revival phenomenon.
(Our full reports on the SEB Fade/Revival of 2009-10:)
EPSC2011-168 & EPSC2013-33.
Ref.R46 = Report 2010 no.22.
Ref.J38 = Rogers (2017, JBAA): ‘I. The SEB Fade.’
Ref.J39 = Rogers (2017, JBAA): ‘II. The SEB Revival.’
(& Professional papers in which we collaborated:)
Ref.J40. Fletcher et al. (2011, Icarus), ‘Jovian Temperature and Cloud Variability during the 2009-2010 Fade of the SEB.’
Ref.J41. Fletcher et al. (2017, Icarus), ‘Moist Convection and the 2010-2011 Revival…’
Mid-SEB outbreaks
These are convective outbreaks in the SEB, similar to the perennial post-GRS rifted region and to SEB Revivals but intermediate in scale. There had been none since 1987/88, until mid-SEB outbreaks occurred in 1998, 2003, and 2005 Nov., all starting during solar conjunction. The earliest dates of observation were as follows (see interim reports):
–1998 (prior to 1998 March 31) – continued active till Oct.
–2003 (prior to 2003 Sep.) — ended by Dec.
–2005 (two, one probably starting in Nov., second on Dec.10) – continued active in first half of 2006, before Fade/Revival in 2007.
–2008 (two, starting on March 8 & March 21).
After the SEB Fade-Revival of 2009-10, mid-SEB outbreaks were less common, occurring only in 2016/17 and 2024:
–2016 Dec.29. This proceeded until 2017 August with some spots even later. It was also well observed by Juno & by professional astronomers. See: Reports 2016/17 nos.3,4,6,10, esp:
Ref.R22 = Report 2016-17 no.17: ‘Summary of the mid-SEB outbreak’;
Ref.J42 = de Pater et al. (2019, Astron.J.), ‘…Multi-wavelength study of convection’.
–2024 Nov.10 [see Report 2024/25 no.7].
It is possible that all SEB Revivals and mid-SEB outbreaks start with an intense convective eruption within a cyclonic mini-barge, as this was the case for all recent examples: viz.,
SEB Revivals in 2007 [Ref.R26 = ‘Jupiter in 2007: Final Numerical Report.’]
& 2010 [Ref.J39 = JBAA_Oct2017 Rogers_SEBRev.pdf; Ref.J41 = Fletcher et al, 2017];
Mid-SEB outbreaks in 1979 (Voyager) [Ref.J1],
& 2016 [Ref.R22 = ‘Summary of the mid-SEB outbreak’],
& 2024 [Report 2024/25 no.7]).
_______________
10.2. The SEBs retrograding jet
This is the only rapidly retrograding jet, and it shares many properties with the prograde jets, including its sharp peak, its well-defined latitude, and its tendency to carry dark spots which are anticyclonic vortices. Nevertheless, it does curve northward around the GRS forming the Red Spot Hollow. Its latitude has been constant in recent decades, but may have been altered during the years of the Great STropD (see below). Refs:
— Ref.R26 = ‘Jupiter in 2007: Final numerical report’ –(Part 3, box on page 4, “The speeds of the SEBs and STBn jets”);
— Ref.J43 = Rogers et al. (2016, Icarus) (SEBs waves; set of ZDPs in Fig.7);
— Ref.R48 = Report 2015/16 no.13, Appendix 1 [see below];
— Ref.J39 = Rogers (2017, JBAA) (SEB Rev.; set of ZDPs in Fig.10);
— Ref.R7 = Report 2023/24 no.3.
The observed speed is usually around DL2 = +120 deg/30d, which is the typical drift rate of vortices (jet spots) on its S edge, though this depends on their size and latitude; this speed dominates some spacecraft ZWPs. However, small vortices and other features give DL2 up to +133, and we believe that +133 is the peak speed of the jet at cloud-tops. Thus the vortices run slower than the true wind peak by ~10-20 deg/30d (5-9 m/s), as they do on prograde jets.
There are other complications:
(i) The ZDP is systematically broader (to the south, where the vortices run) than the ZWP, possibly suggesting a different, deeper ZWP. [Ref. J39 = Rogers (2017, JBAA).]
(ii) Occasionally, small bright spots run at DL2 ~ +150 deg/30d, and we suggested that this could be the true peak jet speed below the main cloud-tops.
Ref.R47 = Report 2012/13: Report no.12: ‘The SEBs jet in 2012/13.’ ; & update in:
Ref.R48 = Report 2015/16 no.13, Appendix 1: “The SEBs jet in 2016: Wave motions and super-fast motions”.
Report 2022/23 no.10.
(iii) In the 2010 SEB Revival, the SEBs jet spots were not vortices [Ref. J39].
(iv) The SEBs sometimes shows long trains of small-scale latitudinal waves with wavelength 4-10 deg, with phase speeds (tightly related to their wavelength) much slower than the jet speed; they can coexist with other features with full jet speed.
Ref.J43 = Rogers et al (2016, Icarus). ‘A dispersive wave pattern on Jupiter’s fastest retrograde jet at 20ºS.’
Further observations of these waves:
—Ref.R47 = Report 2012/13: Report no.12: ‘The SEBs jet in 2012/13.’ ; & update in:
—Ref.R48 = Report 2015/16 no.13, Appendix 1: “The SEBs jet in 2016: Wave motions and super-fast motions”.
—Ref.R33 = Report 2014/15, no.12.
—Ref.R49 = Report 2019 no.10 (Box A).
—Ref.R7 = Report 2023/24 no.3. (Update on SEBs waves, with data from 2016, 2019, & 2023, extending the linear dispersion relation to shorter wavelengths with faster speeds.)
(v) When a STropD is or has just been present, the speed of visible jet spots can be much faster than DL2 = +120: the average for such years was +130 (±16) [Ref.J1], including notable mean values of +140 (1928-1934) and +144 (1979/80). This suggests that circulation at the STropD accelerated the SEBs jet in the long anticyclonic sector outside it [Ref. J1].
_______________
10.3. South Tropical Disturbances
Occasionally, a connection forms between the retrograde SEBs and prograde STBn jets so that material flows (recirculates) between them. The Great STropD lasted from 1901 to 1939 [Ref. J1; Ref.J44 = McKim (1997, JBAA) ‘PB Molesworth’s discovery of the great STropD… 1901.’; Ref.R50 = ‘Historical records of the Great STropD passing the GRS, 1902-1913.’].
Others have existed since then, but only for about two years or less [Ref.J1]. The recent examples were:
1993: A STropD existed for several months, just before and during the SEB Revival; its p. end quickly contacted and began to flow round the GRS, before it was lost in the SEB Revival. [Ref. R43 = interim report for 1993; & Ref.R14 = our S.Temp. report 1991-1999; & Ref.J36 (Sanchez-Lavega et al, 1996, Icarus].
2007: Two STropD’s formed in or before 2007 Jan., about 2 months before the SEB Fade began, and one of them intercepted and recirculated all the retrograding dark spots in the SEB Revival: (See Reports 2007 [esp. Ref.R26 = Final Report, Part 3]; & Ref.J37b = ‘The climax of Jupiter’s global upheaval’.)
2017-18: A new STropD formed during solar conjunction and was discovered by JunoCam images at PJ9 (2017 Oct.24). Amateur images in August had shown some recirculating spots in the STropD that were precursors of it. Prograding as usual, it soon contacted the GRS and began to flow around it in early 2018, producing chaotic disturbance on the STBn jet. But it did not re-form as a STropD p. the GRS, although a faint remnant of the f. end did survive p. the GRS for 2 months [Ref. Reports 2018 no.1, 2, 5, 6, & our PJ9 & PJ12 reports, & EPSC2018-562]
_______________
10.4. Great Red Spot (GRS)
The GRS is the largest anticyclone in the solar system. It has been tracked since 1831, when it was first observed as a long ‘hollow’, but only became a great red oval in the 1870s [Ref.J1].
Drift rate and size:
Its drift rate has varied irregularly, with an overall trend to slower drift (more positive DL2). The GRS has also been shrinking, with fluctuations, since the early 20th century [Ref.J1, & Ref.J45 = Rogers (2008, JBAA)]; see these refs. for charts of its historic longitude and length. Charts of GRS longitude in the 19th century & from 1964 onwards, from the JUPOS project, are at: http://jupos.privat.t-online.de/index.htm (follow: Drift charts & movies / Older drift charts).
The JUPOS project and the ALPO-Japan still continue to monitor the GRS drift rate and size. Figure 6 presents charts for the past 50-60 years. Notably, the GRS decelerated (increased positive DL2) in 2009-10 during the SEB Fade, as is typical, and also resumed shrinking after several years ‘standstill’; but acceleration during the 2010 SEB Revival was short-lived, and both the slower drift rate and the shrinking have continued up to 2024. Particularly abrupt shrinkages occurred in 2012-13 (which prompted Hubble observations in 2014 April) and in 2019 (associated with ‘flaking’ activity) [see refs. below]. Shrinkage has been mainly in longitude, but also slightly in latitude. Both the JUPOS project and the ALPO-Japan still post regular charts covering one or several apparitions, which are copied in some of our interim reports, e.g. Report 2025/26 no.4.
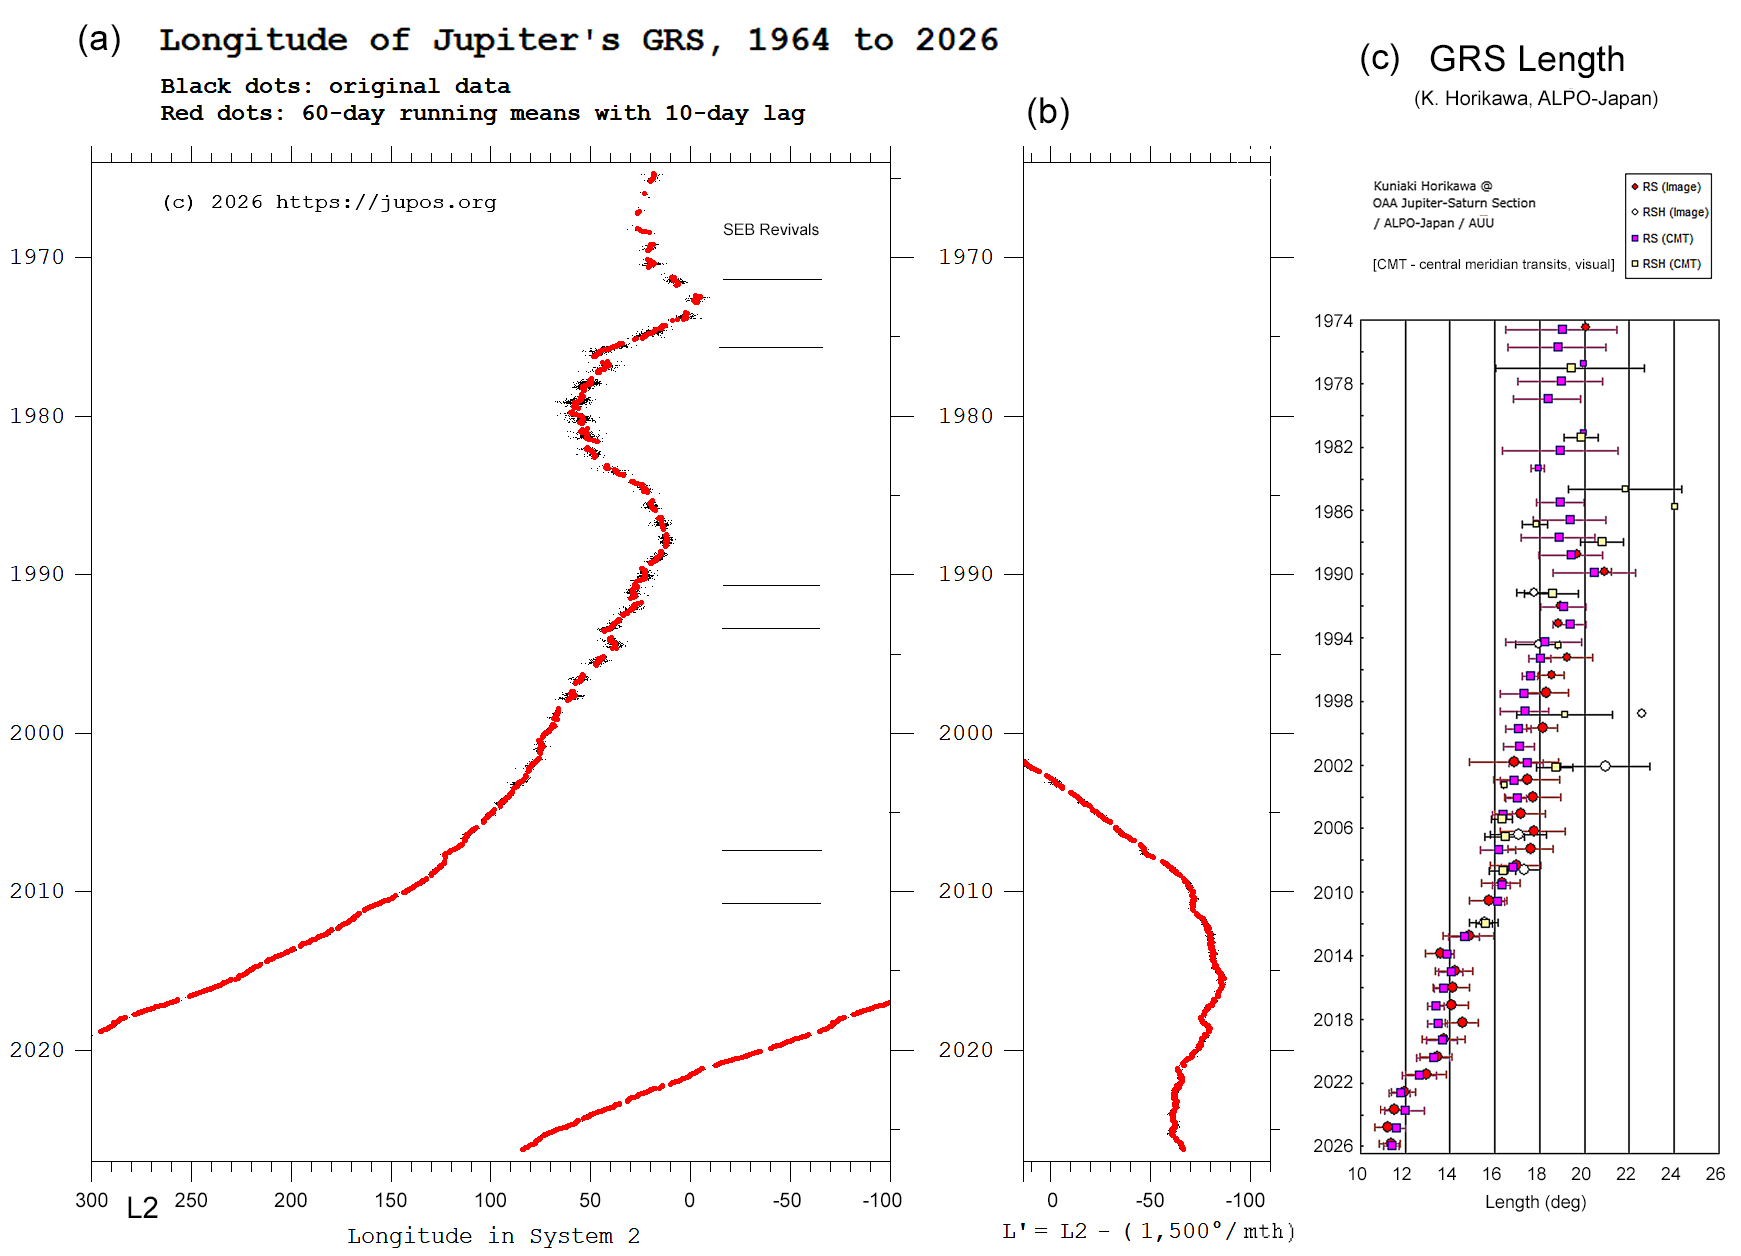
Figure 6. Drift and length of the GRS. (a) Longitude (L2) since 1964, from the JUPOS team (new chart from H-J. Mettig); (b) part of the same in a system moving at +1.5 deg/30d in L2. (c) Length since 1975, from the ALPO-Japan (new chart by K. Horikawa).
Internal circulation:
Amateur images have also been used to measure the internal rotation of the GRS from 2006 onwards, & esp. from 2014 onwards; see refs. below. The internal rotation period has decreased as the GRS has become smaller, and there is some evidence for the wind speeds accelerating as well.
Ref.J45 = Rogers (2008, JBAA), ‘The accelerating circulation of the Great Red Spot.’
(This paper includes a summary of the history of the GRS, its progressive shrinkage over the decades,
interaction with SEBs rings, and its 90-day oscillation.) –under ‘Publications – Full Section Reports’.
Follow-up report in 2012: Ref.R51 = ‘The accelerating circulation of the Great Red Spot.’
& subsequently:
Ref.R52 = Report 2013/14 no.7: ‘The GRS in 2013/14: Faster shrinkage and evidence for faster wind speed.’
Ref.R53 = Report 2013/14 no.9: ‘… Further analysis of amateur images, 2013/14’
Reports 2014/15 nos.2,3,7,12 (these give M. Jacquesson’s measurements of rotation period in 2014/15, averaging 3.7 days througout the apparition);
Ref.R54 = Report 2015/16 no.13, Appendix 2: ‘Mapping the circulation within the GRS’.
Our report of the shortened internal rotation period (Ref.R52) led Dr Amy Simon to observe the GRS with the Hubble Space Telescope (HST) in 2014 April. Although the images were impaired by the shadow of Ganymede, results were published in:
Ref.J46 = Simon et al.(2014) ‘Dramatic Change In Jupiter’s GRS…’
–and the GRS rotation period was tracked from these and other HST images in:
Ref.R55 = Rogers (2016) ‘The circulation of the GRS, 2009-2014: preliminary analysis of HST images.’; also see: EPSC2015-46.
A thorough professional study of the GRS internal winds from Hubble imaging is:
Ref. J47 = Wong et al.(2021, GRL) ‘Evolution of the horizontal winds in Jupiter’s GRS…’
(but note that an average ZWP across the domain has been subtracted from the GRS profiles and speeds, which must be considered when comparing these results with others).
JunoCam took closeup images of the GRS at PJ7. See our PJ7 report, &:
Ref. J48 = Sanchez-Lavega et al. (2018) (GRS dynamics from JunoCam).
Other aspects of the GRS:
Many of these aspects have been closely studied by our colleagues in the ALPO-Japan, esp. K. Horikawa & S. Mizumoto. We use some of their results in our reports, and others are posted on their web site. A full account of all the following aspects is in our Report 2021/22 no.8. Recent examples of their charts, including items (i), (ii) & (iv) below, are in our Report 2025/26 no.4.
i) The 90-day oscillation in longitude. This has been continuous since the 1960s and probably much earlier; it is now routinely observed by JUPOS and ALPO-Japan.
Ref.J50 = Hahn (1996, JBAA), ‘The 90-day oscillation of the jovian GRS.’
Ref.J45 = Rogers (2008, JBAA) ‘The accelerating circulation of the Great Red Spot.’
ii) The ‘Chimney’. This is a white spot or rift that sometimes appears in the N edge of the Red Spot Hollow (RSH), both in normal times (when it looks like a plume of white smoke) and when the SEB is faded [Ref. J38 = Rogers (2017, JBAA) The SEB Fade].
K. Horikawa has shown that it appears regularly at a specific phase of the 90-day oscillation:
[Ref. R56 = K. Horikawa (2018), ‘On the Periodic Rifting in GRS Bay’: Video of talk, on the ALPO-Japan website: http://alpo-j.sakura.ne.jp/kk21/j210106r.htm ]
The ‘Chimney’ is summarised in: [Ref.R49 = Report 2019 no.10 (Box B)].
iii) ‘Flakes’ around the GRS, in 2019 & other years:
These are flakes of red, methane-bright material that appear to be torn out of the edge of the GRS a few days after a SEBs jet spot has entered the RSH; they often circulate around from the f. end to the p. end. They were first noticed when prominent in 2019:
[EPSC2019-546; Ref.R49 = Report 2019 no.10, & Ref.J49 = S-L et al.(2021, JGR-P).]
Some red flakes have also been observed in subsequent years, though not frequent nor large: esp. see Report 2020 no.4 (Part II); Report 2021/22 no.8; Report 2022/23 no.8.
Previous records of SEBs jet spots entering the Red Spot Hollow were noted (but no flake was recorded), e.g. in 2003 March-April [Report 2003/04 no.4] and 2006 April [Ref.J45 = Rogers (2008, JBAA) GRS]; and in 2015 Feb-Mar., a typical flake was shown though not identified as such [Ref.R33 = Report 2014/15, no.12 (Fig.6)].
iv) The ‘Hook’ and S. Tropical Band. The ‘Hook’ is a dark projection from the SEBs around the f. edge of the GRS, which on average develops every two years or so [unpublished survey mentioned in Report 2021/22 no.8]. It was esp. documented during the 2019 flaking events but seems to be unrelated. It typically extends anticyclonically around the S edge of the GRS then extends eastward (p.) in the STropZ p. it, forming a dark S. Tropical Band. E.g. Report 2019 no.10; Report 2021/22 no.8; etc.
________________
10.5. Anticyclonic rings in STropZ
Sometimes a substantial anticyclonic oval develops in the STropZ: usually a dark ring, which we call ‘Spot Q’, with weak westward drift so that it usually ends by entering the Red Spot Hollow.
There was a notable long-lived one from 1987-1997, which transiently became a Little Red Spot when the GRS intensified in 1990 and 1993, then a bright white spot in 1996. It merged into the Red Spot Hollow in 1997 May-June.
[Ref.J1; Ref. J21 = ‘Jupiter in 1997’ (final) in JBAA; Ref. J51 = ‘Jupiter in 2007’ (interim) in JBAA; Ref.J52 = S-L et al. in Icarus].
Others were observed in 1998/99; 1999-2001 (reached Red Spot Hollow in 2001 March); 2001/02; 2005 & 2006; 2008 (another red one; see below); 2016 Jan.-May (it was a SEBs jet spot which drifted south, but did not survive long [Report 2015/16 no.13]); 2022/23 (ditto); 2025 Sep. onwards. These were all noted in our interim reports.
The red oval in 2008 (nicknamed the ‘Baby Red Spot’) had developed from a STropD in 2007, and was large and prograding; its collision with the GRS in 2008 was impressive [Reports 2008 nos.4 & 5; Ref. R37d; Ref.J53].
______________________________________________________________________________________
11. S. Temperate (S1) domain & jet
11.1. The STBn jet
Uniquely, this jet is double, with a continuous northern sub-peak at 26.5°S, and a variable southern sub-peak at ~29°S which we have shown is strong alongside STB structured sectors, but weak or absent outside them [Refs.R14 to R18 = our long-term reports below, including our detailed studies of its ZWP & ZDP; & Ref.J3 = Tollefson et al,(2017)]. The STBn jet is deflected slightly southward around the GRS. The northern sub-peak always shows small-scale, high-amplitude wavy structure in JunoCam images, which could represent deviations of the peak winds [Ref. R18 = S.Temp. 2018-2024].
Small dark spots are commonly seen on this jet, sometimes very sparse, but sometimes abundant as they emerge from the preceding end of a turbulent STB segment [see our long-term reports below]. In spacecraft images they show little or no vorticity. STBn jet spots commonly drift northward while prograding at constant jet speed; this is because they arise near the southern sub-peak, then drift northwards towards the northern sub-peak [Ref. R16 = S.Temp. 2012-2015].
11.2. S. Temperate (S1) domain
This includes the STB, STZ, and one large anticyclonic oval called oval BA. Oval BA formed by merging ovals in 2000 [Ref.J15 = Rogers et al. (2006, Icarus). ‘Merging circulations…’], and turned reddish in 2005/06. The behaviour of other structures in these years was reported in [Ref.R14 = S. Temp. 1991-1999 ] (& see professional refs. therein). In those years the STB was a substantial belt containing turbulent sectors like FFRs, and in this report we showed that those sectors behaved in ways comparable to those in the subsequent decades, despite their different appearance.
From 1998-2020 the South Temperate domain showed a consistent cyclic pattern of behaviour, entirely different from cycles in other major domains. This has been fully documented in our series of combined reports, as follows:
Ref.R14: ‘Jupiter’s South Temperate domain: Evolution 1991-1999 and dynamics of cyclonic structured sectors as seen in Hubble maps’
Ref.R15: ‘Jupiter’s South Temperate domain: Long-lived features 2001-2012 and systematic variations in latitude’
Ref.R16: Jupiter’s South Temperate Domain 2012-2015
Ref.R17: Jupiter’s South Temperate Domain 2015-2018
Ref.R18: Jupiter’s South Temperate Domain 2018-2024
(Very few of our interim reports are cited here, although some of them were very substantial; all are summarised or referenced in these combined reports.)
Also see EPSC abstracts: EPSC2013-385; EPSC2020-196; EPSC2021-121; EPSC2024-362.
From 1998-2020, the STB was whitened around most longitudes, with just one large anticyclonic oval (BA), and a dark sector of STB following it (STB Segment A). Other structured, cyclonic sectors of STB (six in succession) arose periodically shortly preceding BA, then expanded and prograded until they collided with Segment A [see our long-term reports above]. Some of these were dark, turbulent segments of STB (Segments B, D & G); the others were pale quiescent circulations (Segments C, E & F, also called the STB Remnant, Ghost, and Spectre). When they collided with Segment A, they underwent vigorous transformation and merger with it, in 2003/04 (B), 2010 (C), 2013 (D), and 2018 (E). The 2010 and 2018 events involved a sudden bright convective outbreak within the STB Remnant and Ghost respectively as each contacted Segment A, converting it into a turbulent sector that then merged with Segment A [Report 2018 no.2; & Ref.J54 = Iñurrigarro et al.(2020)]. These events also triggered acceleration of oval BA, and emission of dark spots prograding on the STBn jet and retrograding or slow-moving in the STZ. Figure 7 is our long-term chart summarising this behaviour:
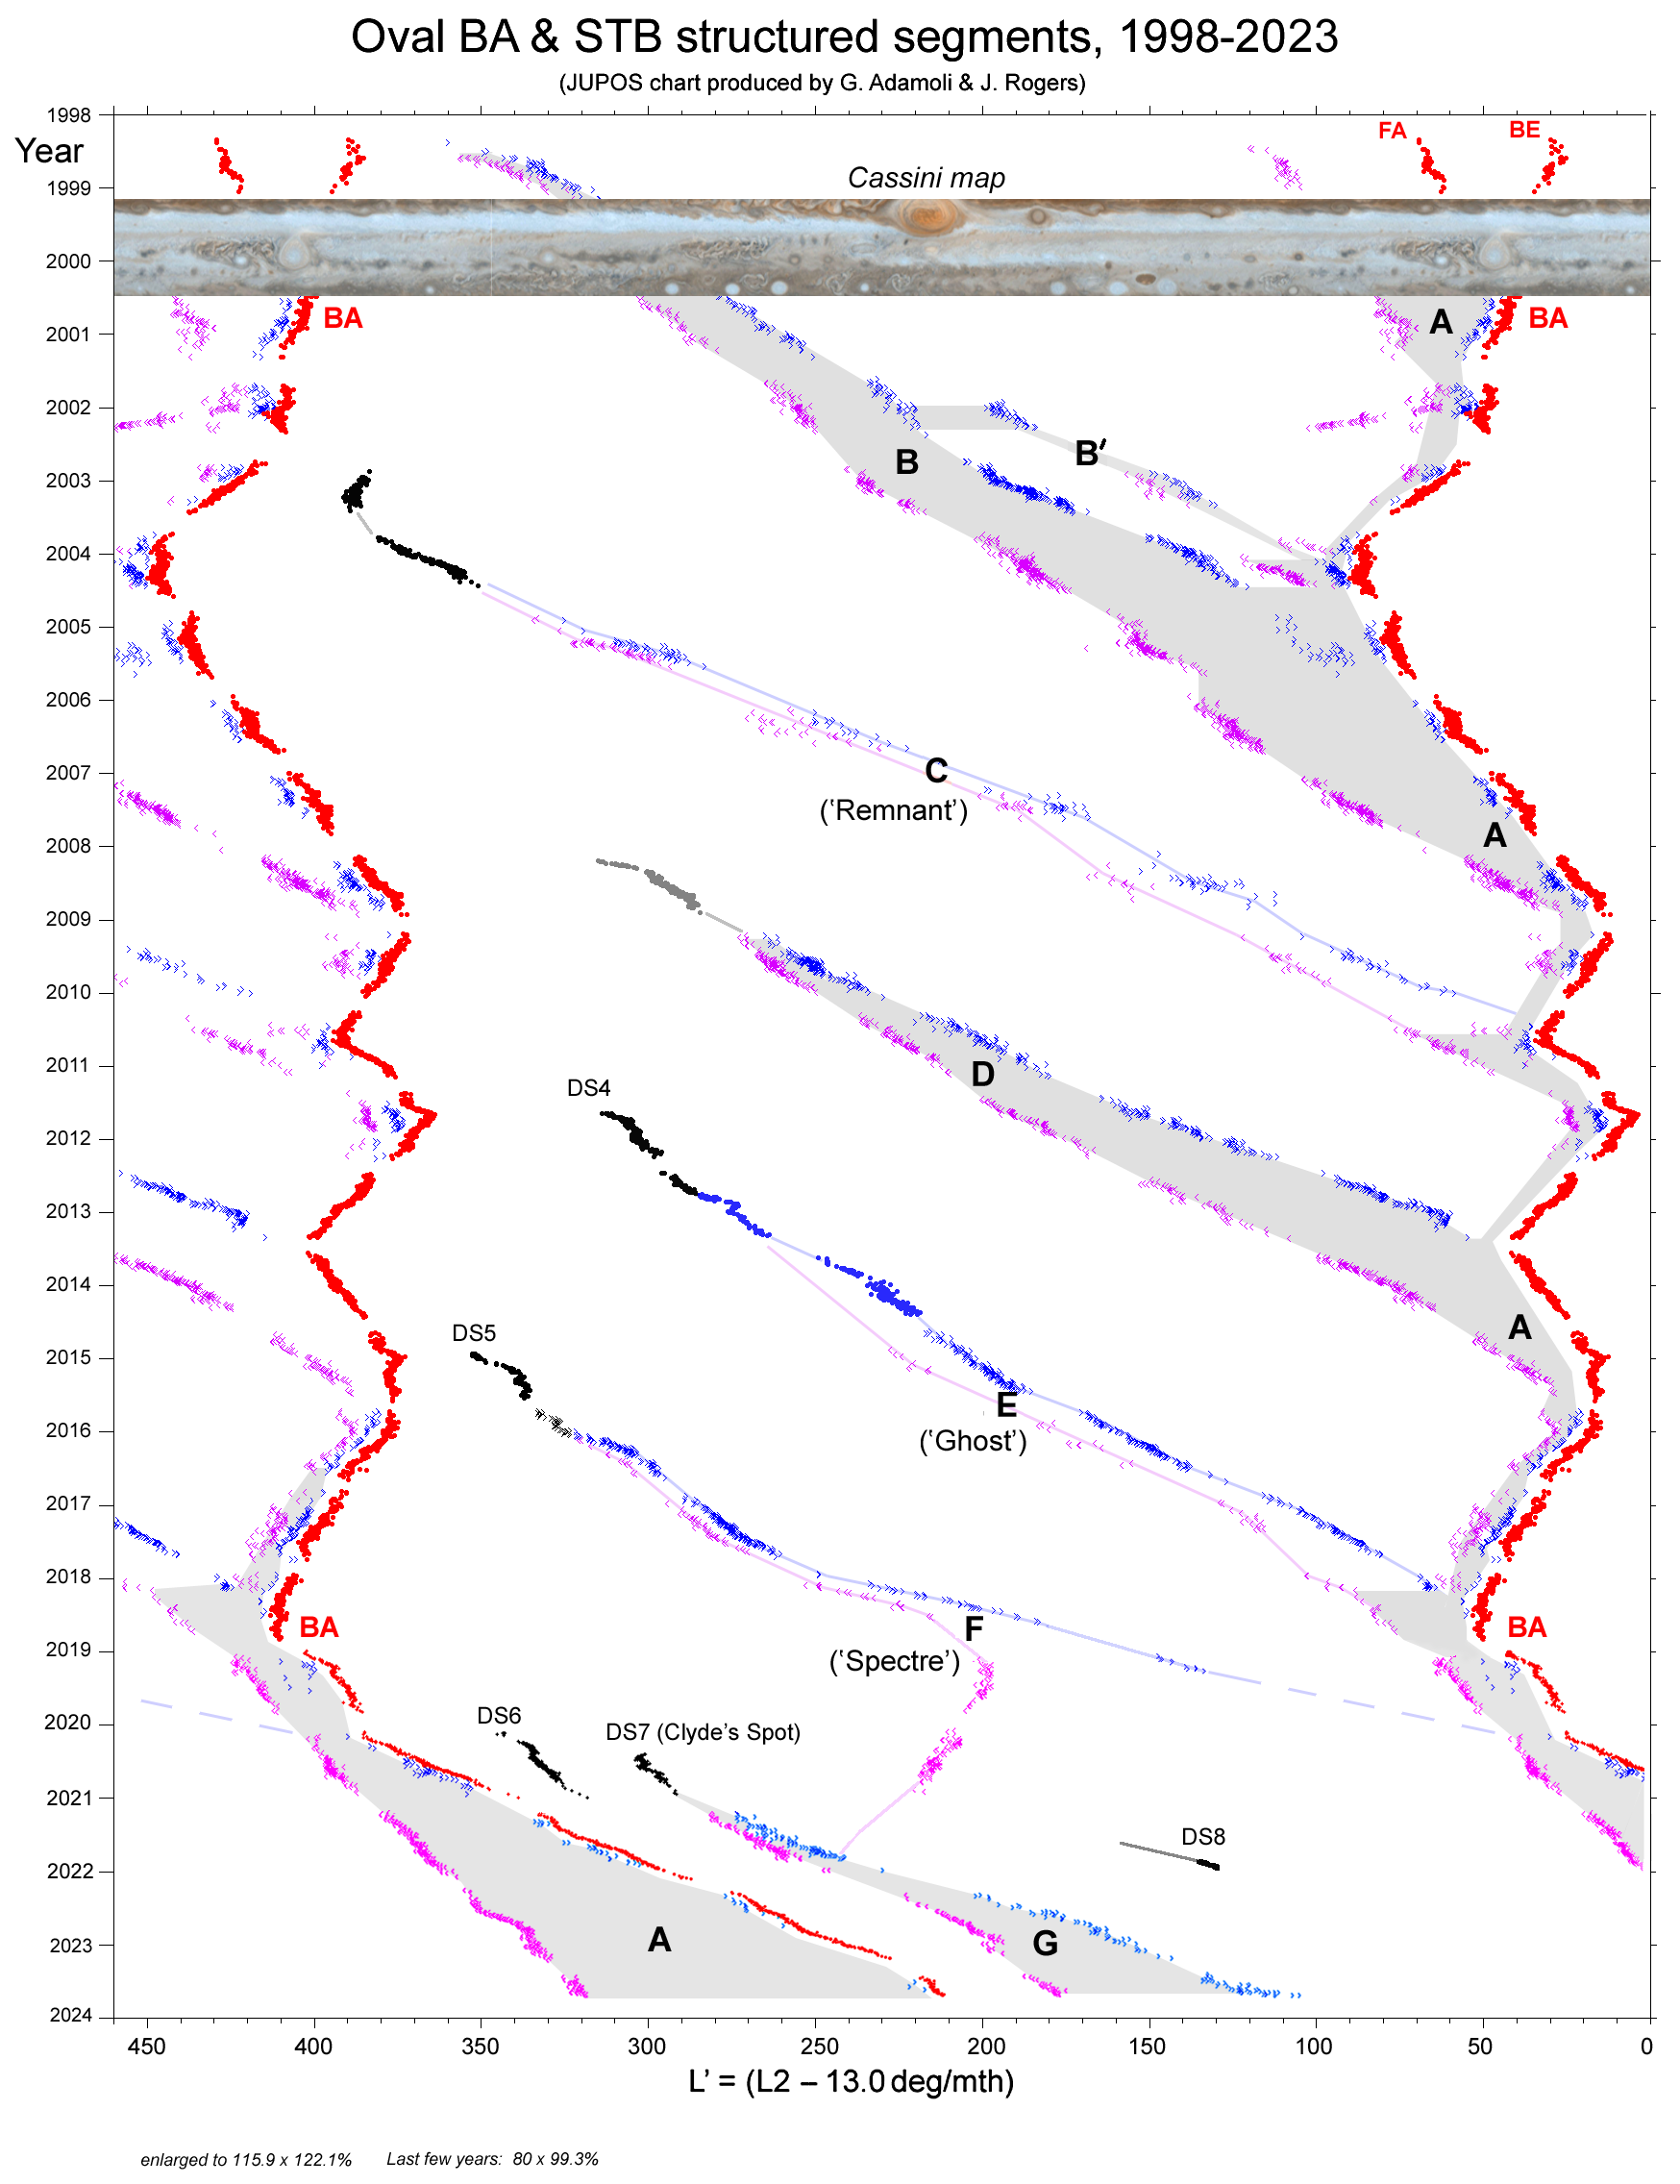
Figure 7. JUPOS chart of S.Temperate sectors, 1998-2024 [from EPSC2024-362].
A transition to a different pattern of behaviour began in early 2020, when the preceding end of the STB Spectre arrived at Segment A: it did not transform internally but Segment A itself grew more active and longer. Meanwhile, we were expecting one or more new cyclonic spot(s) to arise some way p. BA to initiate the next structured sector, and this happened in 2020, when two small pale cyclones developed into two dark spots. One of these began as ‘Clyde’s Spot’, when a sudden convective outburst transformed the cyclone into a turbulent feature which darkened and expanded from that time onwards to become the new STB Segment G [Ref.R18 = ‘S.Temp.domain 2018-2024’; Ref.J55 = Hueso et al. (2022, Icarus); Report 2021/22 no.5 = S.Temp.domain ; Ref.R8 = Report 2021/22 no.10 (Final); EPSC2020-196; EPSC2021-121]. A year later, a similar outburst produced dark Spot 8, but that eventually became a pale cyclonic oval [Ref.R18]. Oval BA no longer drifts slower than cyclonic features; instead, Segment A and the new dark Segment G both continued expanding and emitting streams of dark spots on the STBn and STBs jets, re-creating a visibly dark STB around much of the circumference, which had not happened since the mid-1990s. Thus the cycle of successive segments has been broken, and the domain has moved into a new regime.
Wind speeds in large circulations:
Measurements of circulation in oval BA from JunoCam images: PJ17 report.
Measurements of circulation in the STB Ghost from Hubble & amateur images:
Ref.R17 = ‘S.Temp. domain 2015-2018’, &
Ref.J54 = Iñurrigarro et al. (2019/20, Icarus).
______________________________________________________________________________________
12. S.S. Temperate (S2) domain
We have combined all our results on this domain in two long-term reviews, covering all long-lived features including the S2 jet and the AWOs:
Ref.R3=R19= Rogers et al.(2014) ‘Jupiter’s southern high-latitude domains… 2001-2012’;
Ref.R20 = Rogers et al.(2025), ‘Jupiter’s S2 domain, 2012-2023’ (inc. JunoCam maps).
(Previous detailed interim reports are mostly not referenced individually in this present review, but are cited in these long-term reports.)
The domain is distinguished by an array of prominent AWOs, described as the “string of pearls”. Over a span of 37 years (1986-2023) there have always been between 6 and 9 large AWOs, with a mean number of 7-8, and a nominal mean lifetime of ~56 years. Some of them have existed throughout these 37 years, and they have never been observed to disappear except by merging with others, so there may be no intrinsic limit to their lifetime. Smaller, shorter-lived AWOs have appeared but rarely lasted for more than 2 years.
One that did, in 2015-2019, was apparently ‘fed’ by smaller anticyclonic vortices emerging from an FFR preceding it, but it eventually merged with a larger AWO [Ref.R20 (above); details were in Ref.R57 = Report 2016/17 no.8 , & Report 2016/17 no.14, & our PJ1 & PJ24 reports]. Another such small AWO that probably formed from vortices from a FFR, but was short-lived, was described in [Ref.R20, & Report 2021/22 no.10].
Between the AWOs are cyclonic formations, formerly obscure but now well characterised thanks to high resolution of JunoCam and Hubble and modern amateur images. We have shown that they fall into 4 categories (dark ovals or oblongs, white ovals or oblongs, FFRs, and pale oblongs), any of which can transform into any of the others. Their lifetimes range from months to years, with two FFRs having lasted for 8 years. Details are in: [Ref.R20 = ‘Jupiter’s S2 domain, 2012-2023’, & EPSC2024-378].
_______________________________________________________________________________________
13. High southern domains (S3 to ‘S6’) & S. Polar Region
All long-lived features including the jets and the AWOs were described in:
Ref.R3=R19 = ‘Jupiter’s southern high-latitude domains… 2001-2012’.
The more detailed subsequent interim reports, including JunoCam data, are: Report 2022/23 no.8; Report 2024/25 no.7.
The S3 and S4 domains always contain one or more anticyclonic ovals, including one long-lived one (S4-LRS-1 in S4). As in the N4 and N5 domains, they have very variable speeds which are faster on the poleward side of each domain. The FFRs are not generally trackable from amateur or JunoCam images, but JunoCam images suggested that in S3 they move with the historical zonal slow current (ZSC: here, S3TC) with DL2 ~ -8 deg/30d. No consistent ZSC has been established for S4.
Also in the S3 & S4 domains, JUPOS charts normally show many retrograding dark spots, at 49°S, which we have analysed in:
[Report 2013/14 no.6; 2015/16 no.13; 2018 no.6; 2022/23 no.8; & 2024/25 no.7]. These are not FFRs, but small spots which may be retrograding following FFRs (as in the N2 and S1 domains, but in contrast to N4 and N5). A long-lived AWO, prograding, sometimes halts its prograding motion when it encounters them, as in 2011 Oct. & 2013 Dec. [Ref.R3=R19, above; Ref.J16 = Schmude (2014); Report 2013/14 no.6; & Report 2019 no.9]. These spots occurred in limited sectors which persisted for several years drifting with the S3TC, from 2005-2010 [Ref.R3=R19, above] and again from 2014-2016 [Report 2014/15, no.12; & Report 2015/16 no.13] and 2017-2018 [Report 2018 no.6]. Our suggestion that they were produced from long-lived FFRs, not resolved from Earth [Ref.R3=R19, above], was supported by the observations in 2018.
__________
The S4 jet: A sinuous wave pattern has been recorded on this jet at about 52°S, with very consistent phase velocity and group velocity, in 2016, 2022, 2023, and 2024/25 [Report 2015/16 no.13 & Report 2022/23 no.8; & Report 2024/25 no.7 & refs. therein]. This is the lowest-latitude prograde jet in which such latitudinal variations have been recorded; they are more usually present in the S5 and especially the S6 jet, as observed by Juno [Ref.J56, below].
_____________
S4-LRS-1, the long lived oval at 60°S, has very likely existed since at least 1994 or (other authors) 1987; it may well be the same ‘grand spiral’ that was imaged by Voyager in 1979. Its reddish colour probably fluctuates but is not well documented.
Ref.J4 = ‘Jupiter’s high-latitude storms….’ inc. Appendix & Supplemental tables;
Ref.R3=R19 = ‘Jupiter’s southern high-latitude domains… 2001-2012’;
EPSC2019-1130.
_____________
South polar region: Flow patterns in the higher latitudes have been revealed by a combination of JunoCam and amateur imaging, as the JUPOS team can now track features up into the southermost belt. These studies revealed that the southernmost (S6) jet is sinuous with waves that define the edge of the methane-bright South Polar Hood. Poleward of it is the ‘southernmost belt’ of FFRs at ~68-74°S, which could also be called the S6 belt, but there is not a well-defined S6 domain because there are no continuous jets further south.
Ref.J56 = Rogers et al.(2021/22, Icarus) ‘Flow patterns of Jupiter’s south polar region.’].
EPSC2020-151; EPSC2020-153.
___________________________________________________________________________________
14. Polar polygons (from JunoCam)
Only Juno can observe the poles themselves, and in its the first four perijoves, JunoCam and JIRAM discovered remarkable polygons of cyclones at each pole: a pentagon of 5 cyclones surrounding a sixth at the south pole, and an octagon of 8 cyclones surrounding a ninth at the north pole. The polygons and the individual cyclones have remained stable from 2016 to 2025, despite the rapid and chaotic changes around them. JunoCam’s observations of them have been published as follows:
Ref.J57 = Adriani et al. (2018, Nature) ‘Clusters of Cyclones Encircling Jupiter’s Poles.’
Ref.J58 = Tabataba-Vakili et al.(2019/20, Icarus) ‘Long-term tracking of circumpolar cyclones…’.
EPSC abstracts:
EPSC2018-702. ‘Long-term behaviour of Jovian polar vortices from JunoCam observations.’
EPSC2019-300. ‘Jupiter’s north polar region from Pioneer 11 to Juno.’
EPSC2021-57. ‘Behaviour of Jupiter’s polar polygons over 4 years’
EPSC2024-154. ‘Counter-rotating cores in Jupiter’s circumpolar cyclones…’
EPSC2025-711. ‘Morphological and Positional Changes in Jupiter’s Northern Polar Cyclones’
EPSC2026-710. ‘Tracking Jupiter’s North Polar Vortices.’
REFERENCE LISTS
References are organised in three groups as follows, listed in order below:
(i) Articles in the JBAA and professional journals and other print media, e.g. “Ref.J1...” – most of the professional ones have one or more amateur(s) as co-authors. [JBAA = Journal of the BAA. JGR = Journal of Geophysical Research. GRL = Geophysical Research Letters.] (Many of these are behind paywalls so URLs may not give full access. Hyperlinks are given here only for our own papers.)
(ii) Major reports on our web pages, e.g. “Ref.R1...” — these include long-term reports (which include references to our interim reports on the same topic, so those are not all linked here) and some apparition reports.
(iii) EPSC abstracts, e.g. “EPSC 2025-55...” – these are the most convenient summaries of topics.
____________
J1. J.H. Rogers (1995), The Giant Planet Jupiter (Cambridge Univ. Press)
J2. Hueso R, Sánchez‐Lavega A, Iñurrigarro P, Rojas JF, Pérez‐Hoyos S, Mendikoa I, Gómez‐Forrellad JM, Go C, Peach D, Colas F, & Vedovato M (2017). ‘Jupiter cloud morphology and zonal winds from ground‐based observations before and during Juno’s first perijove’ Geophys. Res. Lett., 44, 4669–4678. DOI: 10.1002/2017GL073444. https://doi.org/10.1002/2017GL073444.
J3. Tollefson J, Wong MH, de Pater I, Simon AA, Orton GS, Rogers JH, Atreya SK, Cosentino RG, Januszewski W, Morales-Juberias R, Marcus PS. ‘Changes in Jupiter’s Zonal Wind Profile in Light of Juno.’ Icarus 296, 163-178 (2017): https://doi.org/10.1016/j.icarus.2017.06.007
J4. Rogers JH, Adamoli G & Mettig H-J (2011 Feb.) ‘Jupiter’s high-latitude storms: A Little Red Spot tracked through a jovian year.’ [inc. Supplemental tables.]. JBAA 121 (no.1), 19-29. [NNTZ ovals, & Appendix on S4-LRS-1]
J5. Kaspi Y et 19 al., ‘Jupiter’s atmospheric jet stream extend thousands of kilometres deep’ Nature 555, 223-226; [& Guillot T et 19 al, ‘A suppression of differential rotation in Jupiter’s deep interior’, Nature 555, 227-230] (2018).
J6. Kaspi Y, Galanti E, Park RS, Duer K, Gavriel N, Durante D, Iess L, Parisi M, Buccino DR, Guillot T, Stevenson DJ & Bolton SJ (2023) ‘Observational evidence for cylindrically oriented zonal flows on Jupiter’. Nature Astronomy. https://doi.org/10.1038/s41550-023-02077-8.
J7. Garcia-Melendo E, Sanchez-Lavega A, Gomez JM, Lecacheux J, Colas F, Miyazaki I and Parker D (2000). ‘Long-lived vortices and profile changes in the 23.7°N high-speed jovian jet.’ Icarus 146, 514-524.
Refs. J8-J13: Our apparition reports, 1999-2002, in JBAA:
J8. Rogers J, Mettig H-J, Peach D & Foulkes M (2003 Feb), JBAA 113 (no.1), 10-31. ‘Jupiter in 1999/2000, Part I: Visible wavelengths.’ Download in PDF
J9. Rogers J (2003 June) , JBAA 113 (3), 136-140. ‘Jupiter in 1999/2000, Part II: Infrared wavelengths.’ Download in PDF. [Includes review of the properties of various methane filters used for imaging Jupiter.]
J10. Rogers J, Mettig H-J, Peach D, & Foulkes M (2004), JBAA 114 (no.4), 193-214. ‘Jupiter in 2000/2001: Part I: Visible wavelengths: Jupiter during the Cassini encounter.’ Download complete PDF.
J11. Rogers JH, Akutsu T, & Orton GS (2004), JBAA 114 (no.6), 313-330. ‘Jupiter in 2000/2001: Part II: Infrared and ultraviolet wavelengths: A review of multispectral imaging of the jovian atmosphere.’ Download complete PDF.
J12. Rogers JH, Cidadão A, Akutsu T, Mettig H-J, Peach D, Orton GS (2005 Feb.), JBAA 115 (no.2), 70-78. ‘Jupiter in 2000/2001: Part III: The South Equatorial Disturbance: A large-scale wave in a prograde jet.’ Disturbance: A large-scale wave in a prograde jet. [View summary.] [Download complete PDF.]
J13. Rogers JH, Mettig H-J, Foulkes M, Peach D, & Cidadão A (2008 April), JBAA 118 (no.2), 75-86 (Part I) and (no.4) pp.203-216. ‘Jupiter in 2001/02’: Part I [LINK TO PDF] & Part II [LINK TO PDF].
J14a. Gierasch P.J. et al. ‘Observation of moist convection in Jupiter’s atmosphere.’ Nature 403, 628-630 (2000)
J14b. Ingersoll AP, Gierasch PJ, Banfield D, Vasavada AR & the Galileo Imaging Team. ‘Moist convection as an energy source for the large-scale motions in Jupiter’s atmosphere’. Nature 403, 630-632 (2000)
J15. Rogers JH, Mettig H-J, Cidadão A, Sherrod PC, and Peach D (2006). ‘Merging circulations on Jupiter: observed differences between cyclonic and anticyclonic mergers.’ Icarus 185, 244-257.
http://dx.doi.org/10.1016/j.icarus.2006.05.022 & Preprint: https://britastro.org/jupiter/Merger-paper-v2.pdf
J16. Schmude RW (2014 Feb.), JBAA 124 (1), 38-. ‘Changing characteristics of an anticyclone in Jupiter’s S.S.S. Temperate Current.’
Refs. J17-J19: ‘Jupiter’s North Equatorial Belt and Jet’: 3 papers for JBAA (2017-18): https://britastro.org/node/15627 [preprints, inc. Supplementary Material] or https://britastro.org/node/11059 [published articles], in: https://britastro.org/section_information_/jupiter-section-overview/long-term-reports-publications/full-papers-from-collaborations-in-jbaa-2016-2018
J17. Rogers JH (2019 Feb.) JBAA 129 (no.1), 13-26. ‘Jupiter’s North Equatorial Belt and Jet: I. Cyclic expansions and planetary waves.’ https://britastro.org/node/9140.
Also at: http://arxiv.org/abs/1707.03343 & NEB Paper I: Published article.
J18. Rogers JH (2019 April) JBAA 129 (no.2), 94-102. ‘Jupiter’s North Equatorial Belt and Jet: II. Acceleration of the jet and the NEB Fade in 2011-12.’ https://britastro.org/node/15628.
Also at: http://arxiv.org/abs/1809.09719 & NEB Paper II: Published article.
J19. Rogers JH & Adamoli G (2019 June) JBAA 129 (no.3), 158-169. ‘Jupiter’s North Equatorial Belt and Jet: III. The ‘great northern upheaval’ in 2012.’ https://britastro.org/node/15629 Also at: http://arxiv.org/abs/1809.09736
& NEB-III_published.pdf
_______________
J20. L.N. Fletcher, G.S. Orton, J.A. Sinclair, P. Donnelly, H. Melin, J.H. Rogers, et al. ‘Jupiter’s North Equatorial Belt expansion and thermal wave activity ahead of Juno’s arrival.’ Geophys. Res. Lett., 44, 7140-7148 (2017). DOI: 10.1002/2017GL073383. https://doi.org/10.1002/2017GL073383 Also at: http://arXiv:1708.05179v1
J21a. Rogers JH (2001 Aug.), ‘Jupiter in 1997’. [Final report.] JBAA 111 (no.4), 186-198. https://britastro.org/jupiter/JBAA111_Jup97.pdf. Includes Appendix, pp.197-8: ‘Methane band images of Jupiter, 1995-1997.’
J22. Hill SM, Irwin PGJ, Alexander C, & Rogers JH (2024 Aug.) ‘Spatial Variations of Jovian Tropospheric Ammonia via Ground-Based Imaging’, Earth and Space Science, Volume 11 (no. 8), paper e2024EA003562. https://doi.org/10.1029/2024EA003562.
J23. Irwin PGJ, Hill SM, Fletcher LN, Alexander C & Rogers JH (2024 Dec.), ‘Clouds and ammonia in the atmospheres of Jupiter and Saturn determined from a band-depth analysis of VLT/MUSE observations’, Journal of Geophysical Research – Planets, e2024JE008622. https://doi.org/10.1029/2024JE008622.
J24. L.N.Fletcher, Z.Zhang, S.Brown, F.A.Oyafuso, J.H.Rogers, M.H.Wong, A.Mura, G.Eichstädt, G.S.Orton, S.Brueshaber, R.Sankar, C. Li, S.M.Levin, F.Biagiotti, T.Guillot, D.Grassi, C.J.Hansen, S. Bolton, J.H.Waite. ‘Structure of Jupiter’s High-Latitude Storms: Folded Filamentary Regions Revealed by Juno.’ JGR-Planets, Vol.131, e2025JE009315 (2025/26). https://doi.org/10.1029/2025JE009315
J25. Morales-Juberias R, Li L, Dowling T, Mercuri S, Simon A & Sankar R (2026). ‘Interaction between oppositely signed vortices on adjacent domains in Jupiter.’ Icarus 445, no.116868. https://doi.org/10.1016/j.icarus.2025.116868. [N4 domain in Cassini images]
J26. Rogers JH, Mettig H-J, and Peach D (2006). Icarus 184, 452-459. ‘Renewed acceleration of the 24°N jet on Jupiter.’ http://dx.doi.org/10.1016/j.icarus.2006.05.007
J27. A. Sánchez-Lavega, J. H. Rogers, G. S. Orton, et al. (2017). ‘A planetary-scale disturbance in the most intense Jovian atmospheric jet from JunoCam and ground-based observations.’ Geophysical Research Letters (2017) 44, 4679–4686. DOI:10.1002/2017GL073421. https://doi.org/10.1002/2017GL073421.
J28. Fletcher LN (2017) Commentary: ‘Cycles of activity in the Jovian atmosphere’, Geophysical Research Letters 44 (10), 4725-4729. DOI: 10.1002/2017GL073806. https://doi.org/10.1002/2017GL073806
J29. Rogers JH & Foulkes M (2001 April), JBAA 111 (no.2), 67-77. ‘Jupiter in 1996’.
J30. Brueshaber SR, et al. (2025). ‘Multi-Instrument Sounding of a Jovian Thunderstorm from Perijove 38’ Icarus 432, no.116465 (2025). https://doi.org/10.1016/j.icarus.2025.116465
J31. Arregi J, Rojas JF, Sanchez-Lavega A & Morgado A (2006) J.Geophys.Res. 111, E09010. ‘Phase dispersion of the 5-micron hot spot wave from a long-term study of Jupiter in the visible.’
J32. A. Antuñano, L.N. Fletcher, G.S. Orton, H. Melin, P.T. Donnelly, N. Rowe-Gurney, J.S.D. Blake, J. Rogers and J. Harrington (2018). ‘Infrared Characterisation of Jupiter’s Equatorial Disturbance Cycle’ Geophysical Research Letters 45, 10987-95. https://doi.org/10.1029/2018GL080382.
J33. A. Antuñano, L.N. Fletcher, G.S. Orton, H. Melin, S. Milan, J.H. Rogers, T. Greathouse, J. Harrington, P.T. Donnelly & R. Giles (2019) ‘Jupiter’s atmospheric variability from long-term ground-based observations at 5 microns.’ Astronomical Journal 158 (no.3), 130. DOI 10.3847/1538-3881/ab2cd6. Preprint: https://arxiv.org/abs/1906.11088. https://iopscience.iop.org/article/10.3847/1538-3881/ab2cd6
J34. Rogers JH & Mettig H-J. (2008 Dec.), ‘Influence of Jupiter’s South Equatorial Disturbance on jet-stream speed’. JBAA 118 (no.6), 326-334. ‘Influence of Jupiter’s South Equatorial Disturbance on jet-stream speed’ and supplementary material can be be found HERE.
J35. Simon-Miller AA, Rogers JH, Gierasch PJ, Choi D, Allison MD, Adamoli G, Mettig H-J (2012). ‘Longitudinal variation and waves in Jupiter’s south equatorial wind jet.’ Icarus 218, 817–830. [doi:10.1016/j.icarus.2012.01.022]
‘Longitudinal variation and waves in Jupiter’s south equatorial wind jet.’ & http://dx.doi.org/10.1016/j.icarus.2012.01.022
___________
Refs. J36-J41: SEB Fades & Revivals:
J36. Sanchez-Lavega A, Gomez JM, Lecacheux J, Colas F, Miyazaki I, Parker D & Guarro J (1996) Icarus 121, 18-29. ‘The South Equatorial Belt of Jupiter, II: The onset and development of the 1993 disturbance.’
Ref.J37. Interim reports on 2007 apparition, in JBAA, posted at https://britastro.org/jupiter/interim.htm:
J37a. Rogers JH (2007 June) JBAA 117 (no.3), 113-115 & cover. ‘Jupiter embarks on a global upheaval.’ & cover: ‘New Horizons at Jupiter’. = Ref.R27: Report 2007 no.3, https://britastro.org/jupiter/2007report03.htm
J37b. Rogers JH (2007 Oct.) JBAA 117 (no.5), 226-230. ‘The climax of Jupiter’s global upheaval.’ https://britastro.org/jupiter/2007/JBAA%20117-5%20Rogers.pdf
J37c. Rogers JH (2008 Feb.) JBAA 118 (no.1), 9. ‘Progress of Jupiter’s global upheaval.’
J37d. Rogers JH (2008 Oct.) JBAA 118 (no.5), 242-244. ‘Jupiter in 2008: Aftermath of the global upheaval.’
J38. Rogers JH (2017) ‘Jupiter’s South Equatorial Belt cycle in 2009-2011: I. The SEB Fade.’ JBAA 127 (3), 146-158. Rogers-2017_SEB Fade_JBAA 127-3.pdf
J39. Rogers JH (2017) ‘Jupiter’s South Equatorial Belt cycle in 2009-2011: II. The SEB Revival.’ JBAA 127 (5), 264-280. JBAA_Oct2017_pp264-280_Rogers_SEBRev.pdf and http://arxiv.org/abs/1707.03356
J40. Fletcher LN, Orton GS, Rogers JH, Simon-Miller AA, de Pater I, Wong MH, Mousis O, Irwin PGJ, Jacquesson M, Yanamandra-Fisher PA (2011). ‘Jovian Temperature and Cloud Variability during the 2009-2010 Fade of the South Equatorial Belt.’ Icarus 213, 564–580. (http://dx.doi.org/10.1016/j.icarus.2011.03.007)
J41. Fletcher LN, Orton GS, Rogers JH, Giles RS, Payne AV, Irwin PGL, & Vedovato M (2017), ‘Moist Convection and the 2010-2011 Revival of Jupiter’s South Equatorial Belt’, Icarus, 286, 94-117 (http://dx.doi.org/10.1016/j.icarus.2017.01.001)
___________
J42. I. de Pater, R.J. Sault, C. Moeckel, A. Moullet, M.H. Wong, C. Goullaud, D. DeBoer, B. Butler, G. Bjoraker, M. Adamkovics, R. Cosentino, P.T. Donnelly, L. N. Fletcher, Y. Kasaba, G. Orton, J. Rogers, J. Sinclair, E. Villard. ‘First ALMA millimeter wavelength maps of Jupiter, with a multi-wavelength study of convection’ Astron.J. 158:139 (2019 Oct.). [Inc. Mid-SEB outbreak.] DOI 10.3847/1538-3881/ab3643. https://iopscience.iop.org/article/10.3847/1538-3881/ab3643/meta
J43. Rogers JH, Fletcher LN, Adamoli G, Jacquesson M, Vedovato M & Orton GS (2016). ‘A dispersive wave pattern on Jupiter’s fastest retrograde jet at 20ºS.’ Icarus 277 (2016) 354–369. http://dx.doi.org/10.1016/j.icarus.2016.05.028
also preprint at: https://arxiv.org/abs/1605.07883 & https://britastro.org/node/7718
J44. McKim R (1997) JBAA 197 (no.5), 239-245. ‘P.B. Molesworth’s discovery of the great South Tropical Disturbance on Jupiter, 1901.’
Refs. J45-J53: The Great Red Spot:
J45. Rogers JH (2008) JBAA 118 (no.1), 14-20. ‘The accelerating circulation of the Great Red Spot.’ https://britastro.org/jupiter/JBAA-118-1_GRS-paper.pdf
J46. Simon AA, Wong MH, Rogers JH, Orton GS, de Pater I, Asay-Davis X, Carlson RW & Marcus PS (2014 Dec.). ‘Dramatic Change In Jupiter’s Great Red Spot From Spacecraft Observations’. Astrophysical Journal Letters, 797:L31-L34. doi:10.1088/2041-8205/797/2/L31. https://iopscience.iop.org/article/10.1088/2041-8205/797/2/L31/pdf
J47. Wong, M. H., Marcus, P. S., Simon, A. A., de Pater, I., Tollefson, J. W., & Asay-Davis, X. (2021). ‘Evolution of the horizontal winds in Jupiter’s Great Red Spot from one Jovian year of HST/ WFC3 maps.’ Geophysical Research Letters, 48, e2021GL093982. https://doi.org/10.1029/2021GL093982
J48. A. Sánchez-Lavega, R. Hueso, G. Eichstädt, G. Orton, J. Rogers, C. J. Hansen, T. Momary, F. Tabataba-Vakili, & S. Bolton. (2018 Oct.). ‘The rich dynamics of Jupiter’s Great Red Spot from JunoCam Juno images.’ Astronomical Journal 156 (no.4), ID162 (9 pp.). DOI 10.3847/1538-3881/aada81. https://iopscience.iop.org/article/10.3847/1538-3881/aada81
J49. A. Sánchez-Lavega, A. Anguiano-Arteaga, P. Iñurrigarro, E. Garcia-Melendo, J. Legarreta, R. Hueso, J. F. Sanz-Requena, S. Pérez-Hoyos, I. Mendikoa, M. Soria, J. F. Rojas, M. Andrés-Carcasona, A. Prat-Gasull, I. Ordoñez-Extebarria, J.H. Rogers, C. Foster, S. Mizumoto, A. Casely, C.J. Hansen, G.S. Orton, T. Momary, G. Eichstädt. JGR-Planets (2021) vol.126 (no.4), e2020JE006686. ‘Jupiter’s Great Red Spot: strong interactions with incoming anticyclones in 2019’. http://dx.doi.org/10.1029/2020JE006686
J50. Hahn G (1996) JBAA 106, 40-43. ‘The 90-day oscillation of the jovian Great Red Spot.’
J51. Rogers JH (1997 Dec.), JBAA 107, 333-335. ‘Jupiter in 1997.’ [Interim report]
J52. Sanchez-Lavega et 7 al. (1998) Icarus 136, 14-26. ‘Dynamics and interaction between a large-scale vortex and the Great Red Spot on Jupiter.’
J53. Sanchez-Lavega A et 12 al.(2013) J.Geophys.Res. (Planets) 118, 1-21. ‘Colors of Jupiter’s large anticyclones and the interaction of a tropical red oval with the GRS in 2008.’
____________
J54. P. Iñurrigarro, R. Hueso, J. Legarreta, A. Sánchez-Lavega, G. Eichstädt, J. H. Rogers, G. S. Orton, C.J. Hansen, S. Pérez-Hoyos, J. F. Rojas, J. M. Gómez-Forrellad. (2019/20). ‘Observations and numerical modelling of a convective disturbance in a large-scale cyclone in Jupiter’s South Temperate Belt.’ Icarus 336 (2020), paper 113475 (online, 2019). [STB Ghost] https://doi.org/10.1016/j.icarus.2019.113475
J55. R. Hueso, P. Inurrigarro, A. Sanchez-Lavega, C.R. Foster, J.H. Rogers, et al.(2022), ‘Convective storms in closed cyclones in Jupiter’s South Temperate Belt: I. Observations’ Icarus 380, 114994 [‘Clyde’s spot’]. https://doi.org/10.1016/j.icarus.2022.114994
J56. J.H. Rogers, G. Eichstädt, C.J. Hansen, G.S. Orton, T. Momary, A. Casely, G. Adamoli, M. Jacquesson, R. Bullen, D. Peach, T. Olivetti, S. Brueshaber, M. Ravine, S. Bolton (2021/22). ‘Flow patterns of Jupiter’s south polar region.’ Icarus 372, paper 114742 (2022 Jan.; online, 2021 Nov.). https://doi.org/10.1016/j.icarus.2021.114742
J57. Adriani A, Mura A, Orton G, Hansen C, Altieri F, Moriconi ML, Rogers J, Eichstädt G, et al. (2018 March 8) ‘Clusters of Cyclones Encircling Jupiter’s Poles.’ Nature 555, 216-219. [doi:10.1038/nature25491] https://www.nature.com/articles/nature25491
J58. Tabataba-Vakili F, Rogers JH, Eichstädt G, Orton GS, Hansen CJ, Momary TW, Sinclair JA, Giles RS, Caplinger MA, Ravine MA & Bolton SJ. ‘Long-term tracking of circumpolar cyclones on Jupiter from polar observations with JunoCam.’ Icarus 335 (2020), paper 113405 (online 2019). https://doi.org/10.1016/j.icarus.2019.113405
J59. Wong M.H., Bjoraker G.L., Goullaud C., Stephens A.W., Luszcz-Cook S.H., Atreya S.K., de Pater I., & Brown S.T. ‘Deep Clouds on Jupiter’. Remote Sensing 15, 702 (2023). https://doi.org/10.3390/rs15030702
J60. Wong M.H., Kolmašová I., Oyafuso F. A., Imai M., Mizumoto S., Levin S.M., et al. (2026). ‘Radio pulse power distribution of lightning in Jupiter’s 2021-2022 stealth superstorms.’ AGU Advances, 7, e2025AV002083. https://doi.org/10.1029/2025AV002083
_______________________________________________________________________________________
R1: Rogers JH (2013) ‘Reference list of Jupiter’s jets’ http://www.britastro.org/jupiter/reference/jup_jets/ref_jets.htm
R2: https://britastro.org/section_information_/jupiter-section-overview/jet-streams-list
R3 = R19: Jupiter’s southern high-latitude domains: long-lived features and dynamics, 2001-2012.
Refs. R4-R7: Zonal wind profiles from amateur work:
R4. ‘Longitudinal drift determination from image pairs with WinJUPOS’ [includes ZWP from amateur images in 2010 Sep] (Grischa Hahn): & follow: WinJUPOS/Tutorials/
viz: Hahn G, ‘Jupiter: Longitudinal drifts computation from image pairs’: http://www.grischa-hahn.homepage.t-online.de/ “Zonal wind profiles”, or direct to: http://www.grischa-hahn.homepage.t-online.de/astro/winjupos/LongDrifts/Jupiter_LongDriftDetermination_English.pdf
R5. ‘Jupiter in 2012/13: Interim report no.9’, Appendix 2 (‘NEBn: Dynamic interactions of spots’) & Appendix 5 (Grischa Hahn: ZWPs from amateur images in 2012 Sep-Dec).
R6. Hahn G & Rogers J (2015), Report 2013/14 no.10: Zonal wind profiles from ground-based and Hubble images, 2014 February and April [These focussed on S.Temperate & N.Temperate sectors.]
= Hahn G & Rogers J (2015) ‘Zonal wind profiles from ground-based and Hubble images, 2014 February and April.’ http://www.britastro.org/jupiter/2013_14report10.htm
R7. Rogers J, Adamoli G, Bullen R, Jacquesson M, & Mettig H-J (2024) ‘Jupiter in 2023/24, Report no.3: The major jets.’ & Appendix 1: ‘Background data on the major jets’ & Appendix 2: ‘Zonal wind profiles by G. Hahn’. Report 2023/24 no.3, ‘The major jets’
R8. Rogers J & Adamoli G (2022), ‘Jupiter in 2021/22, Report no.10: Final report’, inc. Appendix 1. https://britastro.org/section_information_/jupiter-section-overview/jupiter-in-2021-22/jupiter-in-2021-22-report-no-10-final
R9. Rogers J (2024/2026), BAA Jupiter Section: ‘Tracking the large AWO in the N5 domain, 2015-2023’. [Recently posted as 2022/23 Report no.9] https://britastro.org/section_information_ /jupiter-section-overview/long-term-reports-publications/jupiters-long-lived-n5-oval
______________
Refs. R10-14: The high northern domains:
R10. Rogers J, Adamoli G, Jacquesson M, Vedovato M, & Mettig H-J (2017), ‘Jupiter’s high northern latitudes: patterns and dynamics of the N3 to N6 domains.’ https://britastro.org/node/11328
R11. Rogers J & Adamoli G, BAA Jupiter Section Report: 2020 no.9, “Final numerical report: Northern hemisphere”. http://britastro.org/node/26046
R12. Rogers J & Adamoli G, BAA Jupiter Section Report: 2021/22 no.9, “N4 to N6 domains”. Report 2021/22 no.9 [https://britastro.org/section_information_/jupiter-section-overview/jupiter-in-2021-22/jupiter-in-2021-22-report-no-9-n3-to-n6-domains]
R13. Rogers J, Adamoli G & Bullen R, BAA Jupiter Section Report: 2022/23 no.6, “Final report on the high northern latitudes”. Report 2022/23 no.6 [https://britastro.org/section_information_/ jupiter-section-overview/jupiter-in-2022-23/jupiter-in-2022-23-report-no-6]
__________________
Refs. R10-14: S. Temperate domain:
R14. Rogers JH (2016) ‘Jupiter’s South Temperate domain: Evolution 1991-1999 and dynamics of cyclonic structured sectors as seen in Hubble maps.’ https://www.britastro.org/node/7230
R15. Rogers J, Adamoli G, Hahn G, Jacquesson M, Vedovato M, & Mettig H-J (2013). ‘Jupiter’s South Temperate domain: Behaviour of long-lived features and jets, 2001-2012.’ http://www.britastro.org/jupiter/stemp2013.htm
R16. Rogers J & Adamoli G (2015) ‘Jupiter’s South Temperate Domain, 2012-2015’. http://www.britastro.org/jupiter/2014_15report08.htm
R17. Rogers J (2019 Feb.), ‘Jupiter’s South Temperate Domain, 2015-2018’. https://britastro.org/node/17283
R18. J. Rogers, G. Adamoli, R. Bullen, M.Jacquesson, M. Vedovato, H-J. Mettig, C. Foster, C. Hansen, G. Eichstaedt, G. Orton, T. Momary (2025 Dec.). ‘Jupiter’s South Temperate Domain, 2018-2024’. https://britastro.org/section_information_/jupiter-section-overview/long-term-reports-publications/jupiters-south-temperate-domain-2018-2024
________________
R19 = R3. Rogers J, Adamoli G, Hahn G, Jacquesson M, Vedovato M, & Mettig H-J (2014). ‘Jupiter’s southern high-latitude domains: long-lived features and dynamics, 2001-2012.’ http://www.britastro.org/jupiter/sstemp2014.htm
R20. Rogers J, Adamoli G, Bullen R, Hahn G, Jacquesson M, Vedovato M, Mettig H-J, Eichstaedt G, Hansen C, Orton G, Momary T. (2025). ‘Jupiter’s S2 (South South Temperate) domain, 2012-2023.’ https://britastro.org/section_information_/jupiter-section-overview/long-term-reports-publications/s2-domain-2012-2023
R21. Rogers J (2014), Report 2013/14 no.6. (Now on our new web pages, at:) https://britastro.org/section_information_/jupiter-section-overview/jupiter-in-2013-14/report-2013-14-no-6
R22. Report 2016/17 no.17: ‘Summary of the mid-SEB outbreak’ https://www.britastro.org/node/16772
R23. Rogers J (2015 Dec.) ‘Relationship of NEB rifts to NEB expansion events.’ https://www.britastro.org/jupiter/relationnebrifts.htm
R24. Rogers J (2013). Jupiter in 2013-14, report no.3: ‘White spot Z: its history and characteristics, 1997-2013’. http://www.britastro.org/jupiter/2013_14report03.htm
R25. Rogers J & Adamoli G (2015), ‘Jupiter in 2005 and 2006: Final report.’ http://www.britastro.org/jupiter/2006report13.htm
R26. Rogers J & Mettig H-J (2008), ‘Jupiter in 2007: Final Numerical Report.’ http://www.britastro.org/jupiter/2007report20.htm
R27 = J37a. Rogers J, ‘Jupiter embarks on a global upheaval’ [JBAA news item, posted as Report 2007 no.3:] https://britastro.org/jupiter/2007report03.htm.
R28. Rogers J (2008), Report 2008 no.3, ‘The NTBs jet in 2007 and 2008: Evidence on the structure of the jet and the nature of global upheavals.’ https://britastro.org/jupiter/2008report03.htm
R29. Rogers J (2012), ‘Jupiter in 2007: Multispectral Imaging’ https://britastro.org/jupiter/2007report21.htm
R30. Rogers JH (2012), Report 2012/13 no.4. ‘Multispectral imaging of the EZ and NTB coloration events’ [brief survey for 2008-2012]. http://www.britastro.org/jupiter/2012_13report04.htm
R31. G.Adamoli & J. Rogers: in: ‘Jupiter in 2012/13: Interim report no.9’, Appendix 1: https://britastro.org/jupiter/2012_13report09.htm = ‘NNTZ: Anticyclonic ovals, 2008-2012’
R32. Rogers & Adamoli (2015), Report 2011/12 no.9, ‘Final report up to 2012 Feb.’ https://britastro.org/jupiter/2011report09.htm
R33. Rogers & Adamoli (2016), Report 2014/15 no.12, ‘Final numerical report’. https://britastro.org/jupiter/2014_15report12.htm
R34. J. Rogers & G. Adamoli (2012), Report 2012/13 no.3: ‘Progress of Jupiter’s great northern upheaval, 2012 July-August’. https://britastro.org/jupiter/2012_13report03.htm
Refs. R35-R39: N.Temperate Disturbance:
R35. Rogers JH (2010), ‘Jupiter in 2009: Interim Report, with new insights into the NTZ disturbance, NEB expansion, and SEB fading.’ https://britastro.org/jupiter/2009report07.htm
R36. Adamoli G & Rogers JH (2010). ‘Jupiter’s North Temperate Region in 2009: The nature of the North Temperate Disturbance.’ https://britastro.org/jupiter/2009report08.htm
R37. Rogers J, Mettig H-J, Adamoli G, Jacquesson M & Vedovato M (2010), in: ‘Jupiter in 2010: Interim report: Northern hemisphere’: Appendix. ‘North Temperate Disturbance (NTD) in 2010, and a general conjecture about the behaviour of anticyclonic dark spots’ . https://britastro.org/jupiter/2010report09.htm
R38. Rogers J (2010). ‘North Temperate Disturbances: Is NTB rifting necessary?’ https://britastro.org/jupiter/reference/NTD&Rifts_historicalreport-2010jul28.pdf
R39. J.H. Rogers, G. Adamoli, H-J. Mettig, M. Jacquesson, & M. Vedovato (2012) Life cycle of the North Temperate Domain and Disturbance, 2009-2012. https://britastro.org/jupiter/2011report08.htm
R41. Rogers J (2016), Report 2016-17 no.1: ‘Start of the 2016 NTBs outbreak’. https://www.britastro.org/node/8102
R42. Rogers J, Mizumoto S, Adamoli A, Bullen R, Hahn G, Jacquesson M, Mettig H-J, & Vedovato M (2025). Report 2024/25 no.5: ‘The NTBs jet outbreak’. https://britastro.org/section_information_/jupiter-section-overview/jupiter-in-2024-25/report-no-5-ntbs-outbreak
R43. Rogers J (1993) JBAA 103, 157-159. ‘Exciting events on Jupiter.’ [Interim report for 1993. PDF posted at:] https://britastro.org/wp-content/uploads/2016/11/JBAA103-157_interim-report-1993.pdf. [Our full report for 1993 is still unpublished.]
R44. Rogers J (2015) Relationship of NEB rifts to NEB expansion events. https://britastro.org/jupiter/relationnebrifts.htm
R45. Rogers J (2012), ‘The life of the South Equatorial Disturbance, 1999-2010’. https://britastro.org/jupiter/2012_13/SED-1999-2010_Final-overview-to-post.pdf
Refs.R47-R56: SEB & GRS:
R46. Rogers J (2011), Jupiter in 2010, Report no.22: ‘Jupiter’s SEB Revival in 2010/11: Analysis of the early stages of the southern branch.’ http://www.britastro.org/jupiter/2010report22.htm
R47. Rogers J, Adamoli G & Vedovato M (2015 July) Jupiter in 2012/13: Report no.12. ‘The SEBs jet in 2012/13.’ http://www.britastro.org/jupiter/2012_13report12.htm [& see update in:]
R48. Rogers J & Adamoli G (2016), in: Report 2015/16 no.13, Appendix 1: ‘The SEBs jet in 2016: Wave motions and super-fast motions’. https://britastro.org/node/8263
R49. Foster C, Rogers JH, Mizumoto S, Casely A, & Vedovato M (2020): Jupiter in 2019, Report no.10: ‘The GRS in 2019 and its interaction with retrograding vortices’ https://britastro.org/node/22552
R50. Rogers J (2018), ‘Historical records of the Great S. Tropical Disturbance (STropD) passing the Great Red Spot (GRS), 1902-1913.’ https://britastro.org/node/15051
R51. Rogers J (2012), ‘The accelerating circulation of the Great Red Spot.’ https://britastro.org/jupiter/2012_13report07.htm
R52. Rogers J (2014). Jupiter in 2013/14: Report no.7: ‘The Great Red Spot in 2013/14: Faster shrinkage and evidence for faster wind speed.’ https://britastro.org/section_information_/jupiter-section-overview/jupiter-in-2013-14/report-2013-14-no-7-grs
R53. Rogers J, Adamoli G & Jacquesson M (2015). Jupiter in 2013/14: Report no.9: ‘The GRS and adjacent jets: Further analysis of amateur images, 2013/14’. http://www.britastro.org/jupiter/2013_14report09.htm
R54. M. Jacquesson & J. Rogers (2016), in: Report 2015/16 no.13, Appendix 2: ‘Mapping the circulation within the GRS’. https://britastro.org/node/8263
R55. Rogers JH (2016 Nov.). ‘The circulation of the GRS, 2009-2014: preliminary analysis of HST images.’ https://britastro.org/node/8262
R56. K. Horikawa (2018), ‘On the Periodic Rifting in GRS Bay’
Talk at the RAS-Juno meeting in London (2018). It is on the ALPO-Japan website:
http://alpo-j.sakura.ne.jp/kk21/j210106r.htm
R57. Rogers J (2017), Report 2016/17 no.8 (= No.10 Appendix 4): ‘Mergers of small ovals in the S2 domain’. https://britastro.org/node/9378
__________________________________________________________________________________
EPSC abstracts (ordered by year)
These are listed here in order of date and number, with URLs provided. They are all available on the EPSC web site for each year. However, in some years these web sites do not show the figures or format adequately. On our own web sites, we have posted properly formatted PDFs; please find them at:
https://britastro.org/section_information_/jupiter-section-overview/contributions-2020-onwards
Also for 2019, 2021 and 2022 we have posted not just the abstracts but the complete posters or Powerpoints.
EPSC2011-168. ‘Jupiter’s South Equatorial Belt Revival in 2010/11’ Rogers, M. Jacquesson, G. Adamoli, M. Vedovato, & H-J. Mettig. EPSC Abstracts, Vol. 6, EPSC-DPS2011-168-1 (2011). http://meetingorganizer.copernicus.org/EPSC-DPS2011/EPSC-DPS2011-168-1.pdf
EPSC2011-169. ‘Jupiter’s South Equatorial Jet: Speed variations with and without the South Equatorial Disturbance’ G. Adamoli, H-J. Mettig, M. Jacquesson, M. Vedovato, & J.H. Rogers. EPSC Abstracts, Vol. 6, EPSC-DPS2011-169-1 (2011). http://meetingorganizer.copernicus.org/EPSC-DPS2011/EPSC-DPS2011-169-1.pdf
EPSC2013-33. ‘The 2010-2011 revival of Jupiter’s South Equatorial Belt,’ R.S. Giles, L.N. Fletcher, P.G.J. Irwin, G.S. Orton, and J.H. Rogers (EPSC, London, 2013). http://meetingorganizer.copernicus.org/EPSC2013/EPSC2013-33.pdf
EPSC2013-384. ‘Jupiter’s North Equatorial Belt: An historic change in cyclic behaviour with acceleration of the North Equatorial jet,’ Rogers J, Adamoli G, Hahn G, Jacquesson M, Vedovato M, & Mettig H-J. http://meetingorganizer.copernicus.org/EPSC2013/EPSC2013-384.pdf
EPSC2013-385. ‘Long-term monitoring of Jupiter’s South Temperate domain: Oval BA and the cyclic development of structured sectors,’ Rogers J, Adamoli G, Hahn G, Jacquesson M, Vedovato M, & Mettig H-J. (EPSC, London, 2013). http://meetingorganizer.copernicus.org/EPSC2013/EPSC2013-385.pdf
EPSC2015-46. ‘Circulation of Jupiter’s Great Red Spot measured from amateur and Hubble images.’ Rogers JH and Jacquesson M. EPSC2015-46. https://meetingorganizer.copernicus.org/EPSC2015/EPSC2015-46.pdf
EPSC2015-82. ‘The major circulations in Jupiter’s North Tropical domain.’ Rogers JH, Adamoli G, Mettig H-J, Jacquesson M, & Vedovato M. EPSC2015-82. https://meetingorganizer.copernicus.org/EPSC2015/EPSC2015-82.pdf
& https://britastro.org/wp-content/uploads/2015/11/EPSC_authortemplate_NEB_final.pdf
EPSC2017-332. ‘The 2016 outbreak on Jupiter’s North Temperate Belt and jet from ground-based and Juno imaging.’ Rogers JH, Orton GS, Eichstädt G, Vedovato M, Caplinger M, Momary TW, Hansen CJ (2017). EPSC Abstracts Vol. 11, 2017-332. https://meetingorganizer.copernicus.org/EPSC2017/EPSC2017-332.pdf
& https://britastro.org/wp-content/uploads/2015/11/EPSC-2017_Rogers_NTBO_final.pdf
EPSC2018-562. ‘The new South Tropical Disturbance and its interaction with the Great Red Spot.’ J.H. Rogers, G. Eichstädt, M. Jacquesson, C.J. Hansen, G. S. Orton, T.W. Momary, F. Tabataba-Vakili, M.A. Caplinger, M.A. Ravine, G. Adamoli, M. Vedovato, H-J. Mettig, R. Bullen, C. Go, & A. Casely. EPSC abstracts vol.12, no.562. (2018).
https://meetingorganizer.copernicus.org/EPSC2018/EPSC2018-562.pdf
https://britastro.org/wp-content/uploads/2015/11/EPSC2018-562_JHR_STropD.pdf
EPSC2018-702. ‘Long-term behavior of Jovian polar vortices from JunoCam observations.’ Tabataba-Vakili, G. S. Orton, C. J. Hansen, J.H. Rogers, G. Eichstädt, T.W. Momary, M. Caplinger, M. Ravine, S. Bolton. EPSC abstracts vol.12, no.702 (2018). https://meetingorganizer.copernicus.org/EPSC2018/EPSC2018-702.pdf
__________________________________________
Abstracts for EPSC-DPS (Geneva, 2019 Sep.). EPSC uploads are OK. Ours with complete posters are online at: https://www.britastro.org/node/19341]
EPSC2019-101. ‘The Role of Amateur Observations in Characterizing the Current Equatorial Zone Disturbance in Jupiter.’ G. Orton, J. Rogers, A. Antuñano, L. Fletcher, T. Momary. EPSC Abstracts Vol. 13, EPSC-DPS2019-101 (2019). https://meetingorganizer.copernicus.org/EPSC-DPS2019/EPSC-DPS2019-101.pdf
EPSC2019-300. ‘Jupiter’s north polar region from Pioneer 11 to Juno.’ J.H. Rogers, T. Stryk, G. Eichstädt, C.J. Hansen, G. S. Orton, T.W. Momary. EPSC Abstracts Vol. 13, EPSC-DPS2019-300. https://meetingorganizer.copernicus.org/EPSC-DPS2019/EPSC-DPS2019-300.pdf
EPSC2019-302. ‘The cyclic expansions of Jupiter’s North Equatorial Belt in 2015-2017.’ J.H. Rogers, C.J. Hansen, G. S. Orton, T.W. Momary, M.A. Caplinger, M.A. Ravine, G. Eichstädt, M. Vedovato, G. Adamoli, M. Jacquesson, R. Bullen, H-J. Mettig, C. Go, P. Miles. EPSC Abstracts Vol. 13, EPSC-DPS2019-302. https://meetingorganizer.copernicus.org/EPSC-DPS2019/EPSC-DPS2019-302-1.pdf
EPSC2019-546. ‘The Great Red Spot in 2019 and its unusual interaction with retrograding vortices.’ C. Foster, J. Rogers, S. Mizumoto, A. Casely, & M. Vedovato. EPSC Abstracts Vol. 13, EPSC-DPS2019-546-1. https://meetingorganizer.copernicus.org/EPSC-DPS2019/EPSC-DPS2019-546-1.pdf
EPSC2019-1130. ‘Hungry Little Red Spot? The approach and probable merger of Jovian S4 storms AWO-2 and LRS-1 in 2018.’ A. Casely, C. Foster, & J.H. Rogers. EPSC Abstracts Vol. 13, EPSC-DPS2019-1130. https://meetingorganizer.copernicus.org/EPSC-DPS2019/EPSC-DPS2019-1130.pdf
EPSC2019-1843. ‘Infrared studies of Jupiter using image subtraction.’ B. Adcock, EPSC Abstracts Vol. 13, EPSC-DPS2019-1843. https://meetingorganizer.copernicus.org/EPSC-DPS2019/EPSC-DPS2019-1843.pdf
________________
From 2020 onwards, abstracts posted by EPSC do not always show the figures adequately.
Our properly formatted PDFs for 2020 are at:
https://britastro.org/section_information_/jupiter-section-overview/amateur-contributions…. 2016-2020
& for 2021 onwards, at:
https://britastro.org/section_information_/jupiter-section-overview/contributions-2020-onwards
EPSC2020-151. ‘Jupiter’s south polar region (~60-80ºS): Wind patterns from JunoCam maps.’ J.H. Rogers, G. Eichstädt, C.J. Hansen, G.S. Orton, T. Momary. EPSC Abstracts Vol. 14, EPSC2020-151, 2020. https://doi.org/10.5194/epsc2020-151
EPSC2020-153. ‘Jupiter’s south polar region (~60-75ºS): Medium-term flow patterns from amateur and JunoCam maps.’ J.H. Rogers, A. Casely, G. Adamoli, M. Jacquesson, M. Vedovato, R. Bullen, H-J. Mettig, G. Eichstädt, C.J. Hansen, G.S. Orton, T. Momary. EPSC Abstracts Vol. 14, EPSC2020-153, 2020. https://doi.org/10.5194/epsc2020-153
EPSC2020-196. ‘A rare methane-bright outbreak in Jupiter’s South Temperate domain.’ C. Foster, J. Rogers, S. Mizumoto, G. Orton, C. Hansen, T. Momary, and A. Casely. EPSC Abstracts Vol. 14, EPSC2020-196, 2020. https://doi.org/10.5194/epsc2020-196
EPSC2021-57. ‘Behaviour of Jupiter’s polar polygons over 4 years’. Rogers J, Eichstaedt G, Hansen C, Orton G, Momary T, EPSC Abstracts Vol. 15, EPSC2021-57, 2021. https://doi.org/10.5194/epsc2021-57
EPSC2021-95. ‘Stationary waves in Jupiter’s Equatorial Zone in 2020’ by J. Rogers and C. Go EPSC2021-95. https://doi.org/10.5194/epsc2021-95
EPSC2021-121. ‘The latest developments of Jupiter’s STB May 2020 outbreak (Clyde’s Spot)’ by Clyde Foster et al. EPSC2021-121. https://doi.org/10.5194/epsc2021-121
EPSC2022-16. Rogers J, Adamoli G, Hansen C, Eichstaedt G, Orton G, Momary T, Jacquesson M, Bullen R, & Mettig H-J (2022). ‘Jupiter’s high-latitude northern domains: Dynamics from Earth-based and JunoCam imaging.’ EPSC Abstracts Vol. 16, EPSC2022-16. https://doi.org/10.5194/epsc2022-16
EPSC2022-17. Rogers J, Mizumoto S, Hansen C, Eichstaedt G, Orton G, Momary T, Adamoli G, Bullen R, Jacquesson M, & Mettig H-J. ‘The transformation of Jupiter’s North Equatorial Belt in 2021-22.’ EPSC Abstracts Vol. 16, EPSC2022-17. https://doi.org/10.5194/epsc2022-17. (2022)
EPSC2022-802. S.M. Hill & J. Rogers. ‘Jupiter Ammonia Absorption Imaging: Highlights 2020-21’, EPSC Abstracts Vol. 16, EPSC2022-802. https://doi.org/10.5194/epsc2022-802.
EPSC2024-154. G. Eichstädt, S. Brueshaber, C. Li, J. Rogers, G. Orton, C. Hansen, S. Bolton. ‘Counter-rotating cores in Jupiter’s circumpolar cyclones observed by JunoCam and modeled in 2D’ EPSC Abstracts Vol. 17, EPSC2024-154. https://doi.org/10.5194/epsc2024-154.
EPSC2024-160. S. M. Hill, P. Irwin, C. Alexander & J. Rogers (2024) ‘Characteristics and Changes in Ammonia Abundance Features in Jupiter’s Upper Troposphere 2022-2023.’ EPSC Abstracts Vol. 17, EPSC2024-160. https://doi.org/10.5194/epsc2024-160.
EPSC2024-362. J. Rogers, C. Hansen, G. Eichstaedt, G. Orton, T. Momary, G. Adamoli, R. Bullen, C. Foster, M.Jacquesson, M. Vedovato, H-J. Mettig (2024). ‘Jupiter’s South Temperate Domain: Origins of new cyclonic features and a change in the cyclic regime, 2019-2024.’ EPSC Abstracts Vol. 17, EPSC2024-362. https://doi.org/10.5194/epsc2024-362.
EPSC2024-378. J. Rogers, C. Hansen, G. Eichstaedt, G. Orton, T. Momary, G. Adamoli, R. Bullen, M.Jacquesson, M. Vedovato, H-J. Mettig (2024) ‘Longevity of cyclonic formations in Jupiter’s S2 (South South Temperate) Domain.’ EPSC Abstracts Vol. 17, EPSC2024-378. https://doi.org/10.5194/epsc2024-378.
EPSC2025-45. Rogers JH et 13 al., ‘Jupiter’s NTBs jet outbreak 2025: Convective plumes and plumelets’ EPSC Abstracts Vol. 18, EPSC-DPS 2025-45. https://doi.org/10.5194/epsc-dps2025-45.
EPSC2025-51. Rogers JH et 8 al., ‘Jupiter’s NTBs jet outbreak 2025: Zonal winds at cloud-tops and below’ EPSC Abstracts Vol. 18, EPSC-DPS 2025-51. https://doi.org/10.5194/epsc-dps2025-51.
EPSC2025-711. S. Brueshaber, I. Williams, J.H. Rogers [presenter], G. Eichstadt, G. Orton, C. Hansen, L.N. Fletcher, & S. Bolton. ‘Morphological and Positional Changes in Jupiter’s Northern Polar Cyclones’ EPSC Abstracts Vol. 18, EPSC-DPS2025-711. https://doi.org/10.5194/epsc-dps2025-711
EPSC2025-1174. S.M. Hill, P. Irwin, J. Rogers, & L. Fletcher. ‘Optically Observed Ammonia in the Northern Equatorial Zone’, EPSC Abstracts Vol. 18, EPSC-DPS2025-1174. https://doi.org/10.5194/epsc-dps2025-1174
_____________
EPSC2026 abstracts do not yet have EPSC URLs, but are posted on our web site at the end of: https://britastro.org/section_information_/jupiter-section-overview/contributions-2020-onwards
EPSC2026-268. Rogers JH, Adamoli G, Bullen R, Jacquesson J, Mettig H-J, Vedovato V & Mizumoto S. ‘Unusual features on Jupiter: new examples confirm dynamical behaviour’ EPSC2026-268.
EPSC2026-392. Rogers JH (2026). ‘Jupiter’s Equatorial Zone: Visible colorations and 5-micron clearances together support 7-year periodicity’ EPSC2026-392.
EPSC2026-710. Brueshaber S, Rogers J, Williams I, Eichstaedt G, Orton G, & Hansen C (2026), ‘Tracking Jupiter’s North Polar Vortices’ EPSC2026-710.
______________________________________________________________________________
| The British Astronomical Association supports amateur astronomers around the UK and the rest of the world. Find out more about the BAA or join us. |