› Forums › Variable Stars › PNV J00425895+4126279
- This topic has 23 replies, 5 voices, and was last updated 8 years, 10 months ago by
 George Carey.
-
AuthorPosts
-
10 September 2017 at 7:35 am #573831
 Nick JamesParticipant
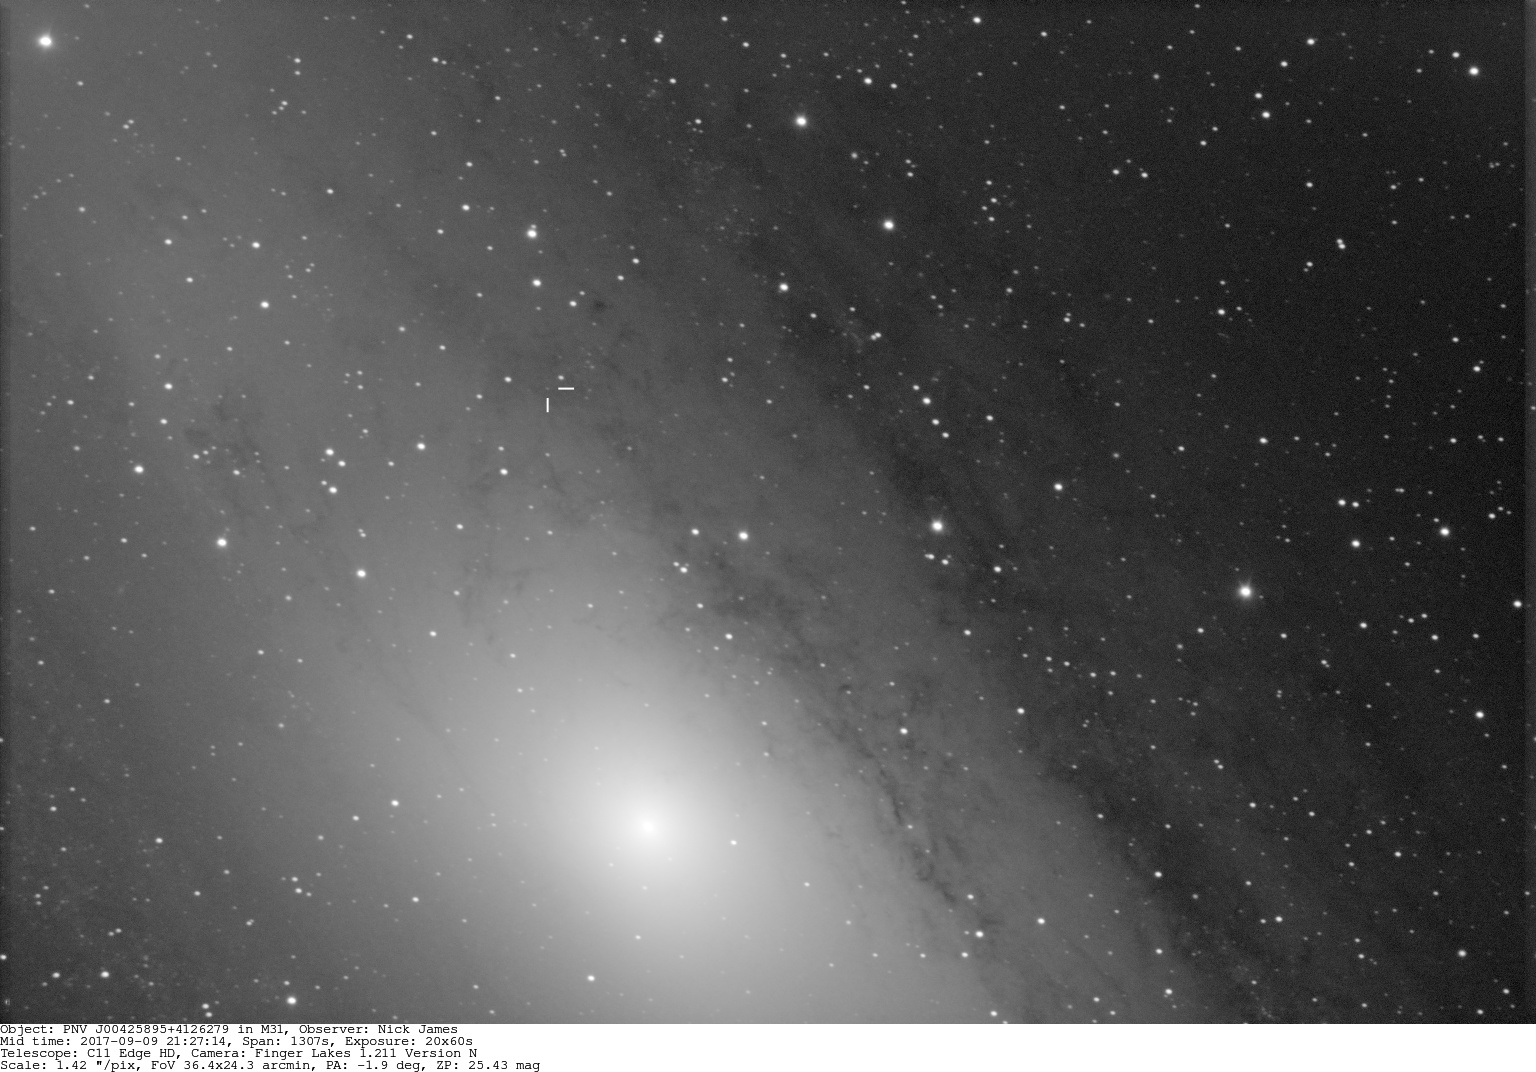
UK observer George Carey has discovered a variable object in M31 (see the TOCP report). I imaged it last night and it is currently around 17.0R. We would like to get a spectrum to confirm whether it is a nova. Is this too faint for amateur spectroscopy?
Nick.
Attachments:
10 September 2017 at 6:56 pm #578536 Robin LeadbeaterParticipant
Hi Nick
In good conditions, mag 17 is just within range at very low resolution (R~130) with my modified ALPY 200 and I don’t know anyone operating fainter currently but the contrast against the galactic background does not look high based on your image so it could be very tough. I have noted it to have a look but no promises, particularly as there are no clear skies forecast here for the week ahead currently
Cheers
Robin
11 September 2017 at 6:36 am #578538Nick JamesParticipantThanks Robin. If you do get a clear slot it would be worth a try. George imaged it again last night and the object has brightened to around mag 16. Richard Miles has a spectrograph job on the 2.0-m FTN which is currently scheduled for this morning.
11 September 2017 at 10:06 am #578540Robin LeadbeaterParticipantGood to hear. mag 16 makes it well within range, possibly with other observers too. I will put out an alert on the ARAS forum
Robin
11 September 2017 at 5:30 pm #578543 George CareyParticipant
More accurate measurements of the nova give a magnitude of 16.6 for 11pm last night.
 11 September 2017 at 6:40 pm #578544Nick JamesParticipant
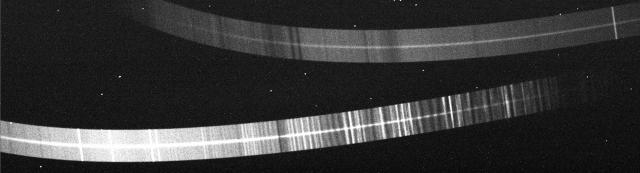
Richard Miles tells me that the 2.0m FTN has acquired a spectrum using the FLOYDS spectrograph. The raw data will be processed after the telescope closes for the night. Richard sent me the attached image showing the raw spectrum which doesn’t mean a lot to me at the moment but presumably will make more sense once it is rectified and calibrated. Many thanks to Richard for arranging this.
There’s an interesting article on spectral confirmation of novae here. Any comments from the spectroscopists on this forum would be very useful.
 11 September 2017 at 9:41 pm #578546Robin LeadbeaterParticipant
Hi Nick,
The author of the article,Francois Teyssier is the resident expert amateur on CV spectroscopy in the ARAS group. He publishes a nominally monthly newsletter on the group’s activities in this area.
http://www.astrosurf.com/aras/novae/InformationLetter/InformationLetter.html
There have been a number of nova confirmations by amateurs recently and followup up spectra tracking the evolution of some targets. We have been getting a lot of support interpreting the data from professional Steve Shore.
I expect the FLOYDS spectrum should settle the matter. It is a rather strange low resolution 2 order echelle instrument though which needs a very specific data reduction pipeline. (looking at the spectrum image, subtracting the sky background should be an interesting challenge !)
Cheers
Robin
12 September 2017 at 7:07 am #578548Nick JamesParticipantWe’ve received the calibrated 2D spectrum which was obtained by Richard Miles using the FTN but can’t make much sense of it. One of the FITS files is attached and if anyone has any insight it would be appreciated. According to the FITS header I think the left hand end corresponds to 474.2 nm and the scale is 0.3511 nm/pix. This would put H-alpha at around X=518 but there is no sign of anything there. I need to delve into the FLOYDS documentation but if anyone has any ideas I’d be very pleased to hear them!
 12 September 2017 at 9:38 am #578547
 Peter CarsonParticipant
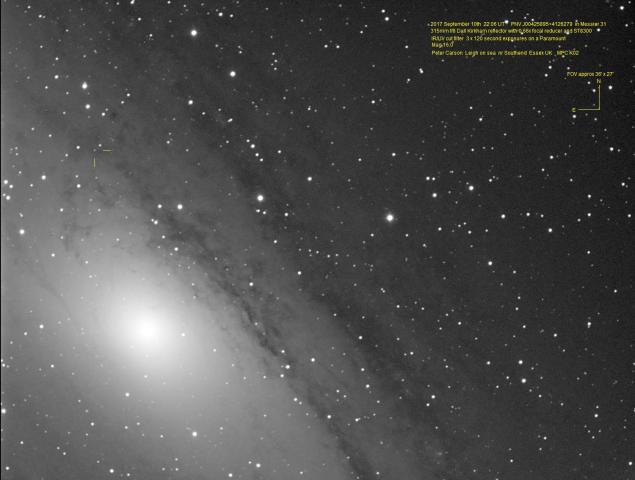
Attached is my image of PNV J00425895+4126279 taken on the night of 2017 Sept 10th at 22.06UT. I measured its brightness as mag 16.0. R UCAC4
12 September 2017 at 11:27 am #578549Robin LeadbeaterParticipantHi Nick,
I’ll have a try at extracting it from the background. I don’t understand where all the emission lines in the sky background come from though. They do not look like galactic lines to me. Do they have an unusual light pollution problem or something or perhaps they superimpose the calibration lamp spectrum?
Robin
EDIT: ok the “emission lines” are actually severe fringing in the IR. I can see the O2 telluric band so should be able to cross check the wavelength calibration.
12 September 2017 at 12:37 pm #578551Robin LeadbeaterParticipant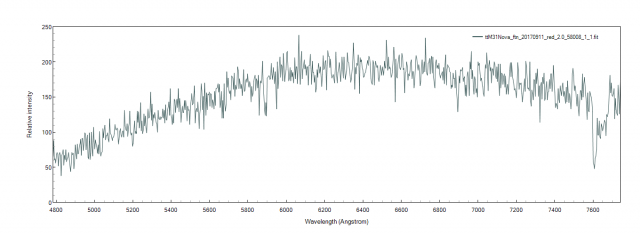 Here is the background subtracted spectrum. (IR end cropped where the fringes dominate). Rather featureless with nothing obvious above the noise (SNR ~15)
Robin
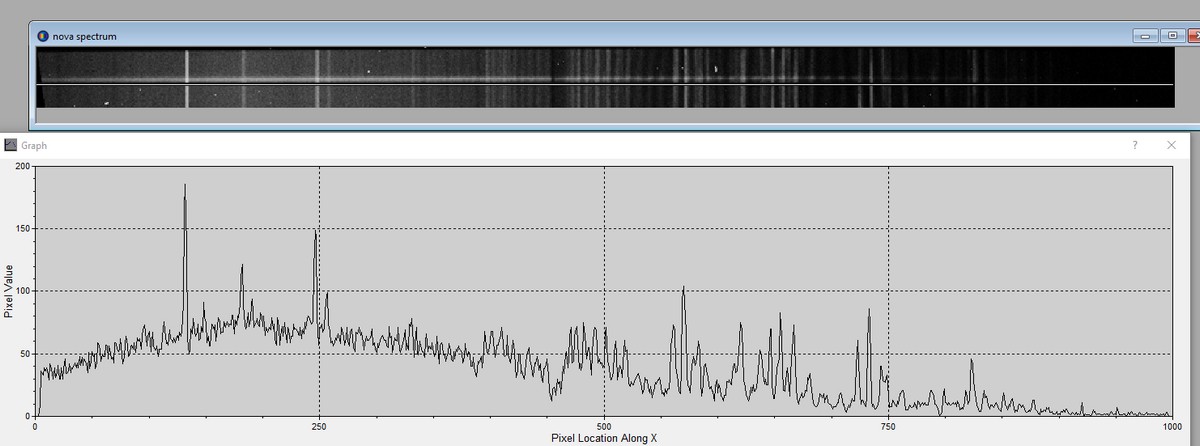
12 September 2017 at 3:35 pm #578553George CareyParticipantI used Maxim to simply draw a profile. Would I be right that the main line on the left is hydrogen?
http://geoastro.co.uk/september2017/nova%20spectrum.jpg
(For some reason I could not attach the image.)
12 September 2017 at 4:27 pm #578554Robin LeadbeaterParticipantHi George,
Your plot includes the sky background (from air glow, light pollution and from M31) which dominates the spectrum. The strong emission lines are airglow and light pollution. To see the target spectrum you need to just select the target spectrum (the narrow band) subtracting the background first. If you look at my sky background subtracted and wavelength calibrated spectrum you can see there is no emission line, including at H alpha (6563A) currently.
Cheers
Robin
12 September 2017 at 4:35 pm #578552 Denis BuczynskiParticipant
Hello all, Here is my image of this extragalactic transient taken lat night (20170911) 23:51 UT. Mag=R 15.8
Denis Buczynski
12 September 2017 at 4:41 pm #578555Robin LeadbeaterParticipantAttached are the spectra with and without sky background subtraction, (pink and blue respectively, to the same Y scale).
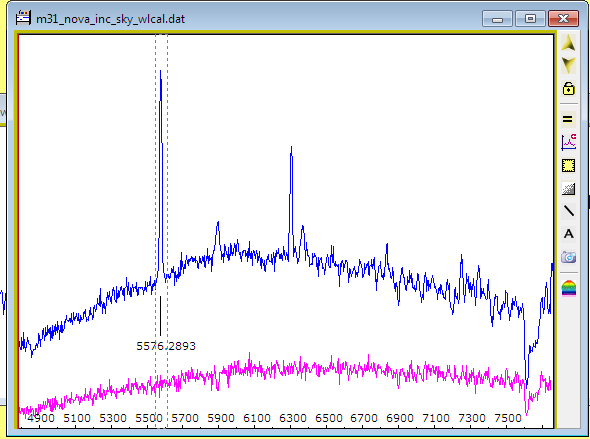
The strongest emission line is the O I airglow line at 5577A. There is also O I emission at 6300A and Na D emission (light pollution ?) at 5900A
Robin
12 September 2017 at 4:50 pm #578556Robin LeadbeaterParticipantThe spectrum beyond ~7700A (~pixel 500) is unusable in its current state because of the severe optical etalon type interference fringes, common in IR spectrographs. A careful flat correction would be needed to remove them.
Robin
12 September 2017 at 5:08 pm #578557Robin LeadbeaterParticipantHere are the target binning (blue) and sky subtraction (green) zones I used in ISIS to extract the spectrum of the PNV (The asymmetric sky background zones were deliberately chosen to avoid the cosmic ray hits)
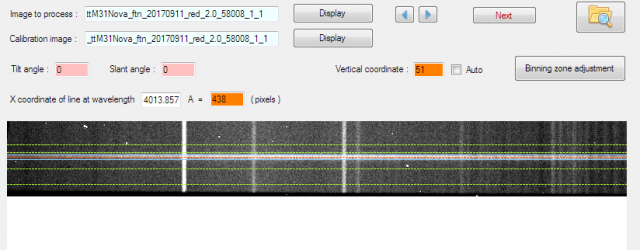
Robin
12 September 2017 at 5:43 pm #578558George CareyParticipantThanks Robin. I am amazed that the skyglow, pollution etc has such a huge component. I would have thought with a 2m mirror there would be bags of data from the nova. The Matt Darnley of the Liverpool telescope indicated that they would have a go at the nova as well. We wait and see…
12 September 2017 at 6:27 pm #578559Robin LeadbeaterParticipantHi George,
It might yet develop features in the spectrum so it will be worth keeping an eye on over the next couple of weeks. In classical novae the H alpha emission lines are relatively strongest after maximum. For example this animation of Nova Del 2013 by amateur Paolo Berardi covering the first week
http://quasar.teoth.it/html/spectra/novadel_15_21.gif
Cheers
Robin
12 September 2017 at 7:15 pm #578560Nick JamesParticipantRobin,
Many thanks for all of your help with this. An interesting result and a very steep learning curve for me!
Nick.
-
AuthorPosts
- You must be logged in to reply to this topic.