› Forums › Spectroscopy › Request for monitoring of X Per
- This topic has 30 replies, 6 voices, and was last updated 6 years, 1 month ago by
 Hugh Allen.
-
AuthorPosts
-
24 November 2018 at 12:07 pm #580280
 Robin LeadbeaterParticipant
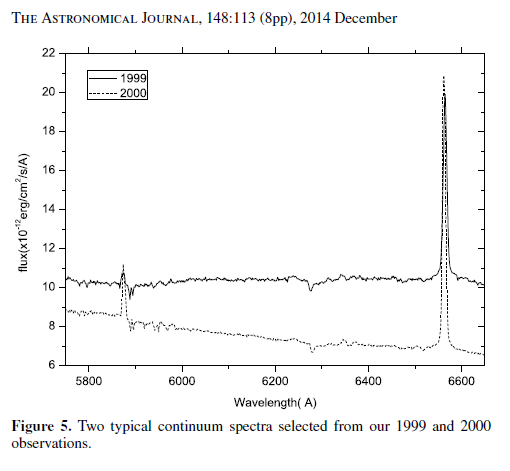
An example from the literature of changes in the continuum picked up in low resolution spectra
 31 October 2019 at 9:40 pm #581546
 Hugh AllenParticipant
Hi Robin,
Paul Roche wrote: “This is an unusual X-ray system, with a slow pulsar (~14 mins spin period) in a wide binary (~250 day) orbit, which exhibits phases where the Be star loses it’s circumstellar disc (characterised by unusally faint periods where the primary fades to V~6.9-7.0). X Per is generally a bright B0e star (V~6.4-6.7), and I’m interested in setting up a long term monitoring project to try and follow the system through it’s next disc-loss phase.”
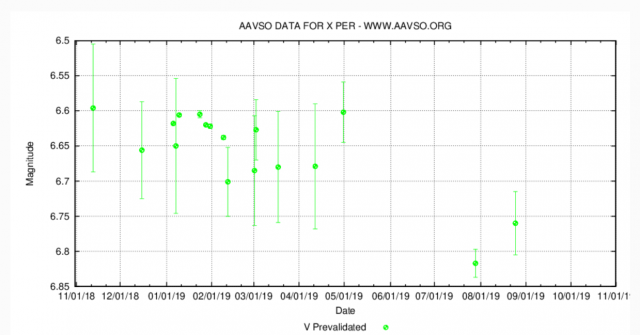
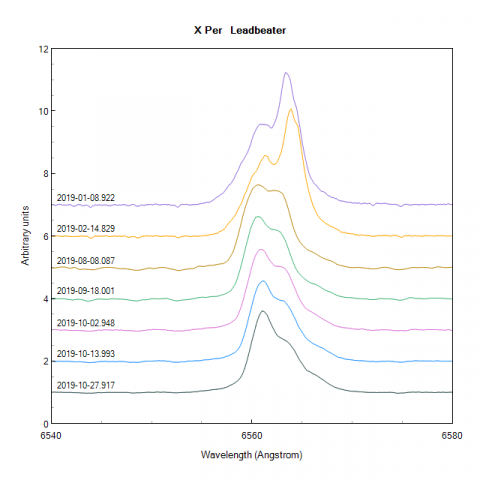
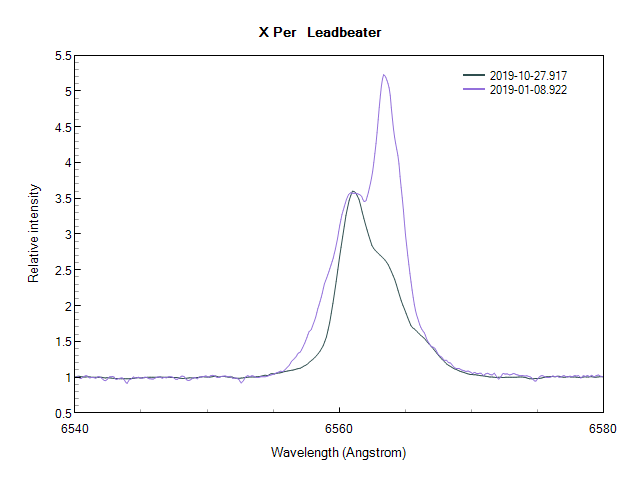
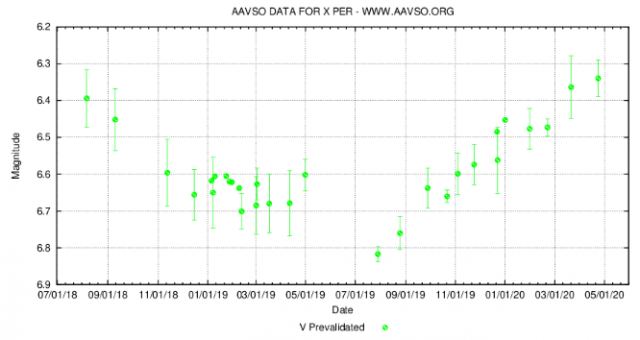
I think a disc-loss phase may be underway. On a murky night a few days ago, I captured a rather noisy X Per spectrum of which I normally wouldn’t be proud, but with the poor weather I’ve had little opportunity this last couple of months! But it’s good enough to see a significant fade in the intensity of all of the emission lines from the disc since my last spectrum on 28th March. I also attach what Vmag data there is from the AAVSO website in which a significant dip in magnitude is also apparent.
Cheers
Hugh
 1 November 2019 at 2:48 pm #581548Robin LeadbeaterParticipant
Hi Hugh,
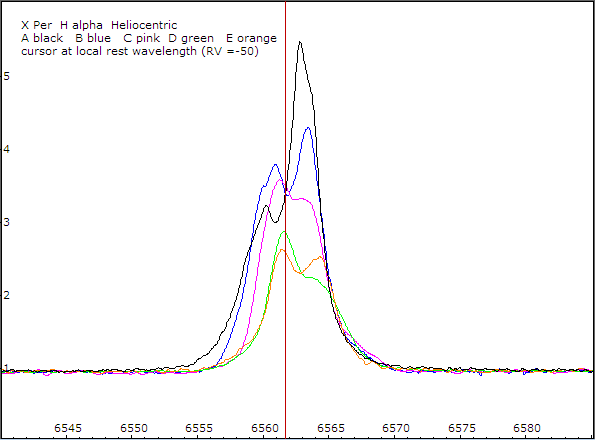
The high resolution H alpha shows that the red edge of the line has been steadily dropping over the year (most obvious during the summer in close season) but the blue component has stayed more or less constant which confims the drop in intensity you are seeing. I contacted Paul about it in August when I noticed the change over the summer but your post has reminded me that I did not get a reply so I had better try again. Something is obviously happening but I have no idea what !
Robin
 1 November 2019 at 6:26 pm #581549Robin LeadbeaterParticipant
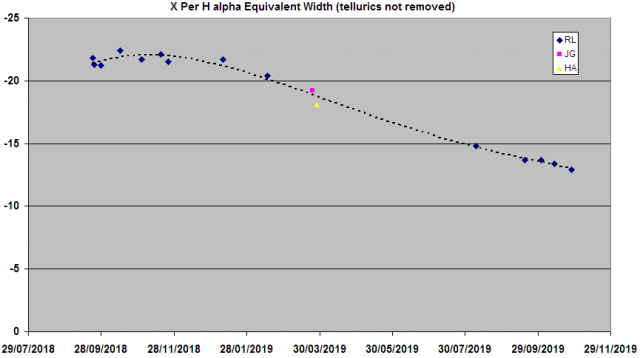
There has been some loss of flux on the blue edge too
I’ve made a quick plot of EW. It looks like the drop started in January and is continuing
 20 November 2019 at 10:36 pm #581624Robin LeadbeaterParticipant
Here is some feedback from Paul Roche concerning the drop in V mag and evolution of the H alpha emission line. Please keep an eye on the spectra in the BAA database and if there has not been an observation for a week or two consider taking one.
Thanks!
———————————————————————————
Feedback from Paul Roche 20-11-2019
It certainly looks like behaviour similar to that prior to previous disc-loss events (weakening H alpha, fading V mag). It would be interesting to see if system is becoming bluer as well, as tends to happen when the red circumstellar disc dissipates. I’d be particularly interested in any infrared observations (I band, or even JHK bands – although that’s getting very tricky!), as that’s another good probe of the extent of the circumstellar disc.
There’s nothing much happening in X-rays at the moment as far as I can see, but I’d like to keep an eye on as many wavelengths as possible as we typically see an interaction between the neutron star and the disc material if the disc expands/moves outward and reaches the (wide) NS orbit eventually (assuming the disc material is being expelled outwards from the star… if it “collapses inwards”, we won’t see any interaction and the NS will continue it’s gradual spin-down).
It’s hard to predict when the H alpha emission will disappear (if it does…) and the normal B-star absorption becomes visible again, but weekly observations are fine for now. If it appears that the decrease in H alpha EW is accelerating, it would be worth trying to increase cadence to every couple of days to capture those final stages.
4 December 2019 at 9:22 pm #581699 john simpsonParticipant
I realise the interest is in photometry & spectroscopy, but noticed in P.Roche paper [1] that some polarisation measurements were referenced, so thought I’d try a few measurements. The table gives the calculated normalised intrinsic polarisations [%].
Band
18/11/2018
14/11/2019
19/11/2019
U
–
–
0.44 +/-0.12
B
–
0.54 +/-0.10
0.51 +/-0.08
V
0.63 +/-0.07
0.59 +/-0.09
0.60 +/-0.07
Rc
–
0.62 +/-0.08
0.58 +/-0.08
The attached figure shows these in relation to results referred to in ref.[1] as Extended Low and Fading stages. The calculated average circumstellar disc polarisation angle is 173.2 +/-4 deg compared to ref. [1] value 171 +/-0.7 deg.
[1] Observations of the recent disc loss in X Persei Astronomy & Astrophysics 322, 139-146 [1997]
#EDIT corrected uploaded image & table !!
4 December 2019 at 11:33 pm #581700Robin LeadbeaterParticipantInteresting. Your values match nicely the levels when the disc was present. It could be another way of monitoring disc loss. I will point Paul to this and see if he has any comments. Meanwhile the V mag appears to have now returned to the same level it was a year ago. The H alpha EW is still continuing its steady fall though.
12 June 2020 at 3:35 pm #582636Robin LeadbeaterParticipantThere are now over 230 spectra in the BAA spectroscopic database. Thanks to all contributors ! Continuing monitoring on a nominal 2 week basis during the next season is requested. The following is a quick analysis of a selection of the available spectra.
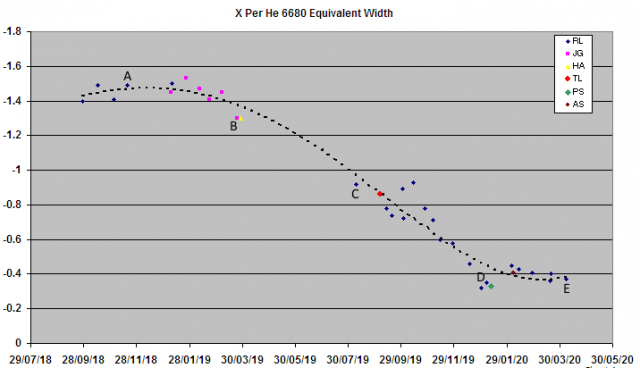
The fall in EW of both the H alpha and He 6680 lines plateaued during January 2020 and remained constant up to the last recorded spectra on 2020-04-06 so there was no complete loss of the disc, though the He line in particular became very weak at just -0.4A EW
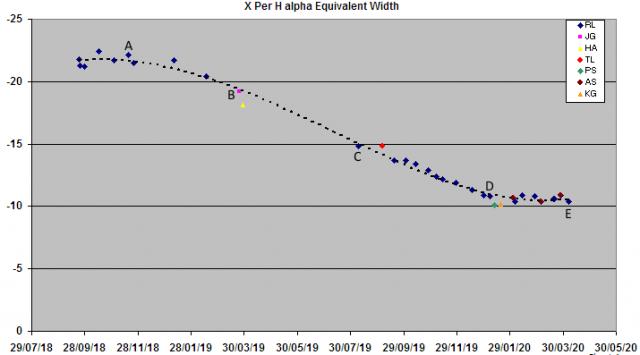
A snapshot of 5 heliocentric corrected line profiles during the monitoring period (marked A-E on the EW plots) shows the complex evolution of the lines and although the EW was approximately constant from Jan to April 2020, the line shape continued to evolve.
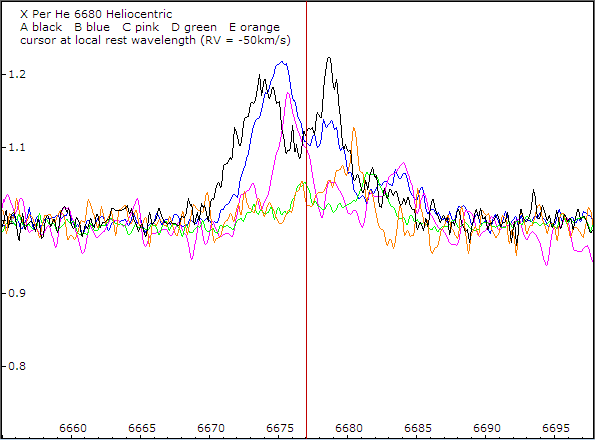
Although noisy due to the weakness of the line, there are significant differences in the He 6680 line profile compared with the H alpha line with higher radial velocity features particularly on the red edge.
Here is the AAVSO V mag light curve for the same period. There is no obvious correlation
Cheers
Robin
14 June 2020 at 11:07 am #582637Hugh AllenParticipant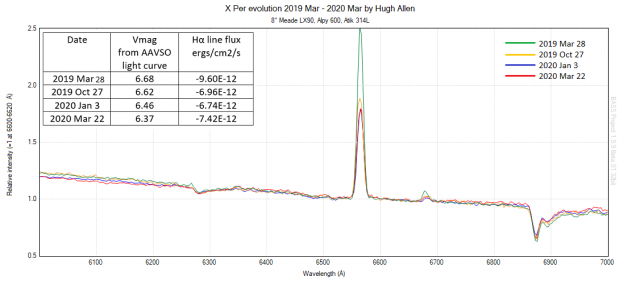
Hi Robin,
Based on the relative peak intenstity of the Hα emission I saw the same trend. The relative intensity plateaued during the first 3 months of this year after falling during last year. However, when I convert to absolute flux using the Vmag measurements in the AAVSO database then the Hα flux looks to have increased a little in my last spectrum at the end of March this year, but probably with a significant error margin.
Cheers
Hugh
14 June 2020 at 11:53 am #582640Robin LeadbeaterParticipantHi Hugh,
Time to place our bets on which way it will go next season !
A comment from Paul Roche in January:-
“It’s not obvious what’s going on here, as the declining EWs for H alpha and HeI suggest a diminishing disc, but the AAVSO photometry seems to suggest the opposite. We’ll have to keep an eye on things for the rest of the “X Per season” and see if it makes sense when we have a bit more data. It will be interesting to see how the (B-V) and (V-R) colour of the system is behaving, that might reveal a little more about the state of the disc”
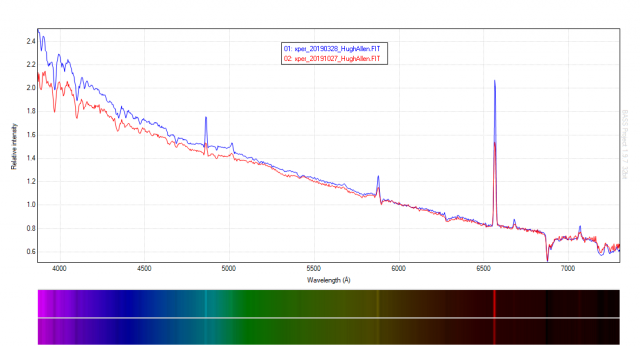
There is very little data in other bands in the AAVSO photometry data. Does your continuum data show any colour trends ?
Cheers
Robin
14 June 2020 at 5:29 pm #582641Hugh AllenParticipant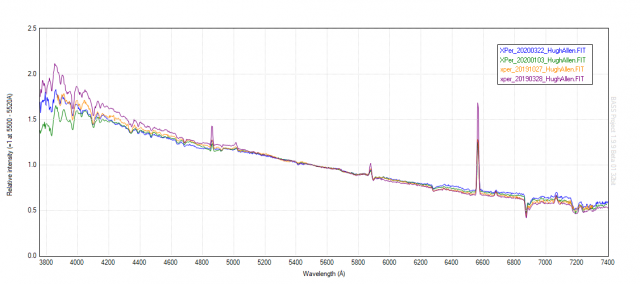
Maybe a slight reddening as the Hα emission has declined
-
AuthorPosts
- You must be logged in to reply to this topic.