Forum Replies Created
-
AuthorPosts
-
 Gary PoynerParticipant
Observations from last night and this morning (Oct 3-4) show very little change in the brightness of GK Per, so the outburst announcement which appeared on various VS mailing lists MAY have been a little premature. However an outburst is due sooner rather than later, so please keep your eyes on it.
Gary
Gary PoynerParticipantHi Robin,
I think it probably was LL And. I have a pre-print of a paper written by Taichi Kato in 1993 and printed in PASJ, which suggests that the 1979 Nova was indeed LL And (there were positional issues with the 1979 report). In it Kato-san writes (about the 1979 event)…
This supposed identification, which was later confirmed by the detection of a new outburst in 1993, of a relatively bright (19 mag) quiescent counterpart naturally suggested the dwarf nova-type classification. This information was quickly relayed to observers through the international alert networks (e.g. VSNET) and the object has been continuously monitored since then. The long-awaited next outburst finally occurred in 1993
I know I was observing it for a long time before the 1993 outburst, and was thrilled to see it for the first time then, confirming Tonny VanMunsters original detection. Indeed Tonny (in Belgium) and I were discussing the outburst on the telephone whilst looking at it through our telescopes! We did this several times in the 1990’s during rare outburst detections. Sadly those days are now gone – as has some of the fun of it.
Gary
Gary PoynerParticipantLL And was first seen in outburst in December 1993, and the last confirmed outburst occured in December 2008. One other outburst was observed in June 2004 (although there have been three unconfirmed sightings visually since 2013)
LL And was fainter than 17.9CV on September 10 2021.
Nice find Jeremy.
Gary
Gary PoynerParticipantI’ve just seen it visually at mag. 12.0 on Jly 16.948 UT, It’s a very red field, so poor comparison choices (high B-V).
Gary
EDIT July 18: With the release of the AAVSO sequence, the above magnitude of 12.0 should be revised to 12.3. Fortunately the AAVSO selected the same comparison star I used, but with a slightly fainter value.
Gary
Gary PoynerParticipantI recorded it at 10.51CV on a SLOOH image on Jly 16.158 UT.
There is a close 151 star a couple of arc seconds away, so my measure was of a blended object. Very difficult at minimum visually to get a good measure.
Gary
Gary PoynerParticipantCG Dra currently in outburst …
Jly 04.909 16.77CV; Jly 05.951 15.98CV; Jly 06.695 15.89CV
About 20d since previous (long) outburst.
Gary
Gary PoynerParticipantTim,
This is the orbital period (Porb) of the system.
Gary
Gary PoynerParticipantIt appears that the slightly overdue outburst of CG Dra has finally started…
June 16.895 UT 15.87CV (SLOOH)
Gary
Gary PoynerParticipantObserved with 10x50B and a 5 degree chart drawn with VSP using the 61 star, I get 6.2 on June 12 at 22h 06m UT.
Gary
Gary PoynerParticipantNick,
Nope. Thought long and hard but decided not to apply for tickets. I would never have got my small Dob in anyway 😉
Gary
Gary PoynerParticipantSolar Eclipse. Breaks in cloud. TMS with tea and digestive biscuits.
Life is sweet..
Gary
Gary PoynerParticipantCG Dra has been slowly rising to outburst over the past couple of nights…
May 10.06UT 17.06CV
May 12.01UT 16.88CV
May 12.98UT 16.15CV
May 13.95UT 15.90CV
Uisng both the OU COAST and SLOOH 2
Gary
Gary PoynerParticipantStewart,
ER UMa at 12.4 visual on May 05.063UT. My previous observation was 14.6 visual on May 01.965UT
Gary
Gary PoynerParticipantHi David,
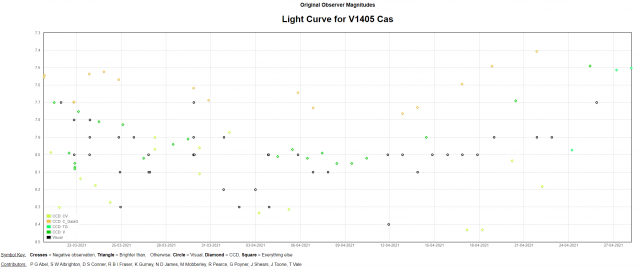
It seems the BAAVSS database has not combined the alias ‘Nova Cas 2021’ with the correct designation V1405 Cas. The latter shows visual and other photmetric data – which also shows the rise in brightness.
Gary
 Gary PoynerParticipant
Brought a tear to my eye…
Gary
Gary PoynerParticipantMartin Mobberley produces excellent photometry with iTelescope.
Gary
Gary PoynerParticipantHappy New Year everyone.
Observing statistics for 2020, with 2019 in parentheses. Birmingham!
2020 proved to be my clearest year since my records began in 1978, beating the previous best in 1995 by 3 nights. 1995 had many more totally clear nights than 2020 however. The excellent Spring helped, with 50 observable nights in March, April and May alone!
Clear nights (less than 50% cloud) 44 (29)
Partially clear nights (50% or more cloud) 95 (61)
Total observable nights 139 (90) with 67 of these nights having Moonlight interference. I made observations on 134 nights.
Total hours at the telescope 296.92 hrs (189.8)
Best month May with 24 nights (12 partially clear and 12 clear). (August 12)
Worst month February with 6 nights (5 partially clear and 1 clear) (November 4)Birmingham Met office gave incorrect information on cloud cover for 79 nights during 2020
Total visual VS observations for 2020 is 10,717, an increase by 3,897 on 2019. CCD single measures using remote telescopes COAST, SLOOH and the AAVSO SRO-50 are 1,909 for 2020 against 1,903 for the previous year.
Gary PoynerParticipantI’ve seen a number of ‘dust dips’ over the years, and 6 weeks in low state seems to be a fair average time before a rise sets in again in the very obvious ones. There are exceptions – for example, V2362 Cyg (Nova 2006) faded 4 mags from 8-12 before a 16 week plateau set in, then rebrightened to mag 10 before a very rapid decline followed by a gradual fade to quiescence. This was a dusty Nova, but the hot dust was probably confined to the inner region of the system. Going on the quite unusual behaviour so far seen in V1391 Cas, it will be interesting to see what happens next over the coming months.
Gary
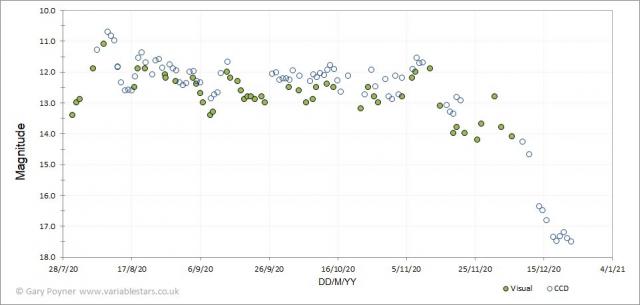
Gary PoynerParticipantThis classic DQHer dust dip started slowly in late November and increased in mid December. Here is my plot so far…
Gary
 Gary PoynerParticipant
Wonderful news. Many congratulations Jonathan.
Gary
-
AuthorPosts