Forum Replies Created
-
AuthorPosts
-
 Robin LeadbeaterParticipant
In this case since it is a particular campaign with specific goals I would probably look to the PI for guidance.
In general though the processing (including combining) of data for submission to databases where the end use is unknown (and in this case potentially may not be known until all of us are long gone) is an ever present dilemma. I faced this in real life for example concerning databases storing vast quantities of process control and quality time series data from a continuous process (a paper machine) where (similar to astronomy) variations over several orders of timescale (from milliseconds to years in that case) are potentially of relevance. Ultimately, storing the data from every exposure and letting the final user make the decision would be ideal (aided perhaps by tools in the database to allow the casual user interrogating the database to view the filtered data). Andy (like our paper mill IT manager at the time) might baulk at every exposure being measured and stored individually indefinitely though! An alternative approach could perhaps be based on examining the data prior to submission to look at what point when combining data the variation if any becomes significant compared to the uncertainty, thus preserving the maximum information while storing the minimum of data.
Cheers
Robin
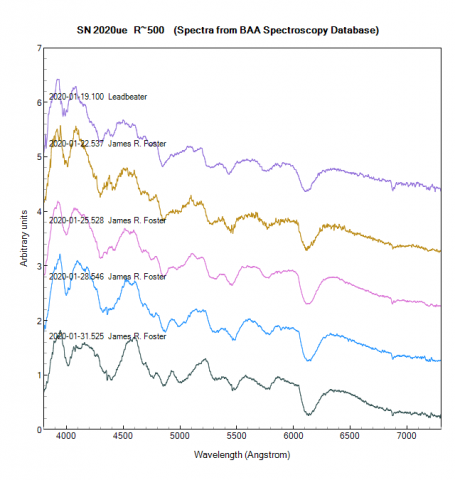
Robin LeadbeaterParticipantFrom the AAVSO light curve it looks like it reached maximum (~12.3 CV) on 25/26th Jan.
No chance to observe here for 2 weeks straight now (Even the odd clear spell has been bracketed by rain showers) but James Foster managed to get a few spectra and added them to our database.
 Robin LeadbeaterParticipant
https://twitter.com/planet4589/status/1222667505505722369
looks like they missed or at least no head on crash !
Robin LeadbeaterParticipant“Nonetheless, I am willing to tolerate pedants who think otherwise.”
🙂
There is indeed no point swimming against the tide on this one but don’t you find a decade lasting 9 years even a little unsettling 😉
Robin LeadbeaterParticipant01-01-21. Same as with the new millenium. Since the first day of the Common Era was 1st Jan 0001 the 3rd millenium began 1st Jan 2001 but you probably will not convince the billions who celebrated the year before or similarly convince them that the new decade starts next year
Robin LeadbeaterParticipantHere is the latest Atel on the subject
http://www.astronomerstelegram.org/?read=13410
“The recent changes defined by our V-band/Wing photometry seem best explained from changes in the envelop-outer convection atmosphere of this pulsating, unstable supergiant. If these recent light changes are due to an extra-large amplitude light pulse on the ~420-day period, then the next mid-light minimum is expected during late January/early February, 2020. If Betelgeuse continues to dim after that time then other possibilities will have to be considered. The unusual behavior of Betelgeuse should be closely watched.”
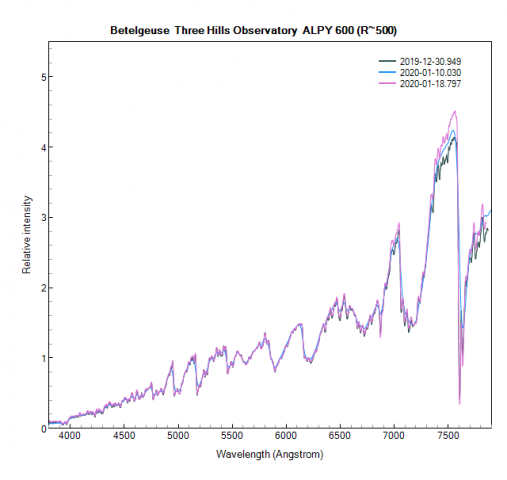
Robin LeadbeaterParticipantI am now picking up some evolution in my spectra since the start of the year. The relative flux around 7500A has been increasing compared with that at 5500A. This is consistent with the brightness in V dropping more than in the IR
 Robin LeadbeaterParticipant
These could perhaps be a source for content for the more general articles on the website or worked up into articles or even peer reviewed papers for the Journal, a sort of informal BAA arXiv ?
Robin LeadbeaterParticipantThanks Andy,
I was thinking it might be interesting to use the personal page like a blog, text images and graphics covering particular topics. (Similar to the BAA articles but in the personal pages.) A combination of the quick post and the image submission functions which don’t quite fill this need individually. Opening up the quick post function to include graphics would do this I think. Is this something that might be considered for the future?
Cheers
Robin
Robin LeadbeaterParticipantI notice there is no direct access to member pages from the website when not logged in but they are accessible if the link is known eg
https://britastro.org/profile?id=146
https://britastro.org/node/20453
Is this intentional or just the way it works ?
Robin
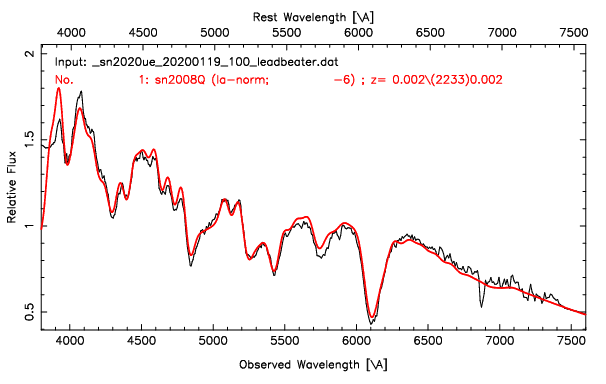
Robin LeadbeaterParticipantFinally a clear night last night so was able to take a low noise spectrum at R~500 using the ALPY 600. Using SNID gives an exquisitely good detailed match to several Ia supernovae still a few days from maximum (black is my spectrum red is best match from SNID
Cheers
Robin
Robin LeadbeaterParticipantA low resolution spectrum from last night. Mainly scattered sunlight but once divided by a nearby G2v solar analogue star spectrum the emission features can be identified. CN at 390nm in the UV is particularly strong.
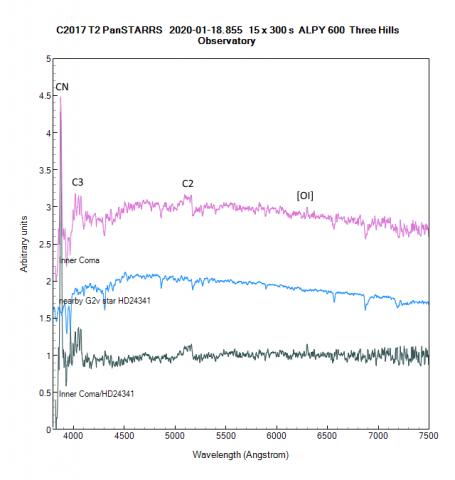
The raw spectrum image can be seen here
https://britastro.org/node/20453
Cheers
Robin
Robin LeadbeaterParticipantCurrently mag 12.8 as measured by Itagaki compared with his 14.9 discovery magnitude
Robin LeadbeaterParticipantYep that was my starting point of course but they are outside the spectrograph guider field.
Cheers
Robin
Robin LeadbeaterParticipantI don’t do anything currently. I visually examine each exposure and cannot recall seeing anything that I could put down to a satellite. The satellite will not spend long in the slit though so the contribution could be too small to be obvious, just contributing to the uncertainty. They would be more likely to appear in the wider sky background subtraction zones so hopefully the median averaging across the zone deals with them there.
Robin LeadbeaterParticipantThe potential effect on spectroscopy is an interesting one as unlike photometry where trails will be obvious in the image, the cumulative contamination from the trails briefly crossing the slit during say a 20 min exposure, either within the binned or background subtracted regions may not be so obvious.
Robin LeadbeaterParticipantI did some years ago with a simple setup
http://www.threehillsobservatory.co.uk/astro/spectra_20.htm
but these days in the BAA at least Bill Ward would be the guy to talk to eg
Robin LeadbeaterParticipantIt does indeed seem the fading of Betelgeuse has indeed been greatly exaggerated
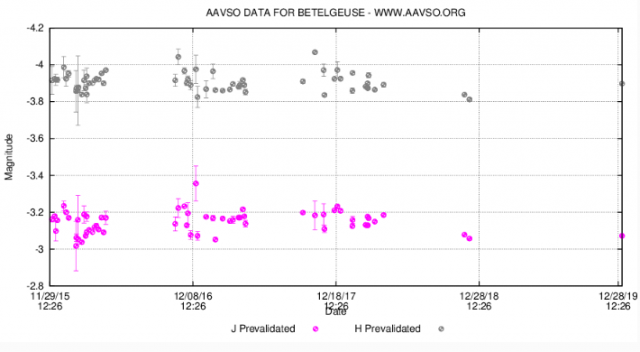
I see there is now a recent H,J point in the AAVSO database (The first for over a year)
It shows that Betelgeuse is not fading in the IR where most of the flux is so it does suggest there has not been any significant drop in bolometric luminosity, just a small drop in temperature which has produced an exaggerated effect at V mag, a region sensitive to changes in the depth of the molecular absorption bands.
Cheers
Robin
Robin LeadbeaterParticipantThe latest Atel from the team who originally announced the dimming has some figures on photosphere temperature changes based on IR Wing band filters. They seem to tally reasonably with our estimates from the spectrum change
Robin LeadbeaterParticipantHi Andy,
Good point. The V (and R) band does seem to sit in a region which is particularly sensitive to the degree of molecular band absorption which in turn is sensitive to temperature. That additional absorbed flux has to end up elsewhere in the spectrum, most likely in the IR so changes in V mag probably do overestimate the change in total flux as you say.
-
AuthorPosts