Forum Replies Created
-
AuthorPosts
-
 Robin LeadbeaterParticipant
Hi Paul,
It has not maxed out yet so if it follows the normal Ia light curve will likely be around mag 16 in a month’s time so still an easy imaging target.
Note my original comment on mag 18 being out of range for amateurs referred specifically to spectroscopy, not imaging. With my ALPY 200 the target has to be about 6.5 mags brighter for spectroscopy than for a conventional photometry image. The big advantage with slit spectroscopy though is most of the sky background is kept out by the slit so you can get away with much higher levels of light pollution. My limiting spectroscopic magnitude is ~17.5 which corresponds to mag 24 for photometry. I would need much darker skies to do photometry that deep in a conventional image though.
Cheers
Robin
Robin LeadbeaterParticipantAnd of course you can also use your DSLR with your Star Analyser to do some simple spectroscopy that you asked about
https://britastro.org/node/16809
There are some tips on how to do this on Christian Buil’s page here
http://www.astrosurf.com/buil/staranalyser/obs.htm
(Don’t worry about the wedge prism or focal reducer he uses there, just screw the Star Analyser on the front of the nosepiece adapter)
Robin
Robin LeadbeaterParticipantHi Garion,
DSLR are very popular for astrophotography and it is possible to produce some stunning deep sky images with a DSLR used at prime focus (eg using a T ring and eyepiece adapter in place of the lens and mounting the camera in place of the eyepiece)
eg this website picked at random from the many out there
http://ried-sternwarte.de/dslr-galerie.html
You ask if it will work with your reflector and there are two potential issues that you will need to check with your particular setup.
If you plan to use it at prime focus, you will need to check that you can reach focus. (This can be a problem with Newtonians and DSLR as you might not be able to wind the focuser in far enough to place the camera sensor at the telescope focal plane) You can add a Barlow lens to get round this but this increases the focal length, making the stability and tracking capability of the mount more critical.
You will need to test the stability of your mount and how well it will track. You might struggle with your Meade Polaris 130MD with its EQ3 mount and simple motor drive, but the best way to find out is to try it.
Cheers
Robin
Robin LeadbeaterParticipantI see this website which plots the VIIRS satellite data also accepts SQM readings, though they are rather sparse
https://www.lightpollutionmap.info/#zoom=6&lat=7401398&lon=-432104&layers=B0FFTFFFFFT
The string of readings up the M6/A74 is interesting. Perhaps I should mount a one on the roof of the car, coupled with a GPS logger.
Robin
Robin LeadbeaterParticipantAbsolutely!
Robin LeadbeaterParticipantYes possibly of not much scientific value unless you can get a large enough number of observers in a given location and over a reasonable length time to beat down the variability (The key to success in citizen science projects) but I suspect this project by CPRE is more about public awareness of the issue and to get a conversation going than the actual quality of the measurement. Hence the use of an instantly recognisable constellation. Interestingly I met a casual observer from a nearby village the other day who had been lent a sky quality meter to monitor their skies by the Friends of the Lake District.
Robin
Robin LeadbeaterParticipantIt depends on your budget and what else you plan to do with the camera really. There is a lot of choice out there. Simple CMOS mono cameras with 1/3 size sensors typically used as guiders work ok with the SA, can be used for simple imaging of planets and brighter deep sky objects and can be bought from around £150-180. If you want a camera which can take spectra and images of faint objects or do photometry though then a camera with a larger size cooled sensor would be better and more versatile but are more expensive, typically ~£800 to the skies the limit. Good value can sometimes be found second hand though as people trade up. I have bought through Uk AstroBuySell for example.
Robin LeadbeaterParticipantIt looks like some extra characters got attached to the spectroscopy section link – fixed now.
perhaps the webmaster can move this thread there ?
The Starshoot might work to get you started but I have heard reports that it goes completely blank on fainter objects (even Saturn!) rather than show a noisy image so it might not work so well. In any case a mono camera would be much better for science (including spectroscopy and photometry) so that could be the way to go if that is where your interests lie.
I see from your own page on here you have a small Newtonian on a driven mount. That will work well with the Star Analyser. For starters, just focus the Star Shoot on Betelgeuse, then screw the SA on the front of the camera nosepiece, refocus slightly to pick up the features in the spectrum and see what you get. (There will be two spectra, one either side of the star image, go for the brighter one and adjust the exposure so it is not over exposed). You should be able to see something like this spectrum of Delta Virginis on my website, though perhaps without the extended range into the IR as your camera probably has an IR blocking filter built in. The broad bands are from TiO molecules which form in the atmosphere of cool stars.
http://www.threehillsobservatory.co.uk/astro/spectra_14.htm
Good Luck!
Robin LeadbeaterParticipantHi Garion,
Do you have any astro-imaging equipment ? I developed the Star Analyser as a simple way for people to get their feet wet in this field so pretty much any equipment can be used to get started.
There is also a section here specifically devoted to spectroscopy
https://britastro.org/forum/143
Cheers
Robin
Robin LeadbeaterParticipantAlso the manual can be downloaded from the Paton Hawksley website which has some advice on suitable equipment in the FAQ
Robin LeadbeaterParticipantThat’s pretty serious QRP DX. How does that compared with Voyager ?
Robin LeadbeaterParticipantSome spectra have been taken and no more are needed at this stage. See ARAS thread for more details
Robin LeadbeaterParticipantI remember that too, though I think I saw it in the physics department. (I was a physics undergrad there at the time)
Robin LeadbeaterParticipantHi Hugh,
Digging out the report I see Aldebaran was recorded at 45 deg altitude
I dont think scintillation effects are directional are they ? I would expect the effect to be independent of the slit orientation. Orientating the slit vertically relative to the horizon (the paralactic angle) will help with atmospheric dispersion problems though which can give systematic errors due to selective sampling by wavelength at the slit.
Cheers
Robin
EDIT: Actually thinking about it a bit more, I think there are two potential effects here.
Movement of the star image coupled with selective sampling at the slit due to atmospheric dispersion which could be reduced by orientating the slit
Distortion of the spectrum due to scintillation which is seen even in the absence of the slit (eg in Star Analyser spectra) and is seen visually as apparent colour changes in the star
Robin LeadbeaterParticipantThe slit normally defines the location of a given wavelength in the spectrum but if the slit is wider than the star image then I guess there could be some wavelength shift between exposures due to scintillation. To avoid scintillation problems (and uneven coverage of the slit due to guiding errors) I normally accumulate at least 1 min total exposure time for a spectrum (which for bright targets at low resolution can be in shorter sub exposures), though this is not based on any scientific analysis.(I see I only used 30 sec for eps Tau in this particular exercise)
https://britastro.org/sites/default/files/attachments/ALPY600_MILES_tests_20161105.pdf
Robin LeadbeaterParticipantI see campaign announcements and requests for spectra coming from many directions with varying degrees of formality. (The ARAS forum for example has specific areas for campaigns and alerts). I have relayed details of some of them on this forum that I have either received direct or seen elsewhere but they can tend to get lost as they eventually scroll off the bottom of the page.
A sticky post which would stay at the top of the spectroscopy section of the forum that anyone could add to if they come across campaigns might work. (Andy and I did try this with my post on target results for ALPY observing and data reduction but it seems to have come unstuck). Adding information about a campaign announced elsewhere would not oblige the poster to coordinate it or follow it up unless they wanted to take on that responsibility. It would be up to the individual contributor to do that with the PI concerned.
Here are a few examples from me on this forum
https://britastro.org/node/16683
https://britastro.org/node/15540
https://britastro.org/node/11637
https://britastro.org/node/11372
also some run by Ernst Pollman eg
https://britastro.org/node/10809
https://britastro.org/node/10613
https://britastro.org/node/10539
Cheers
Robin
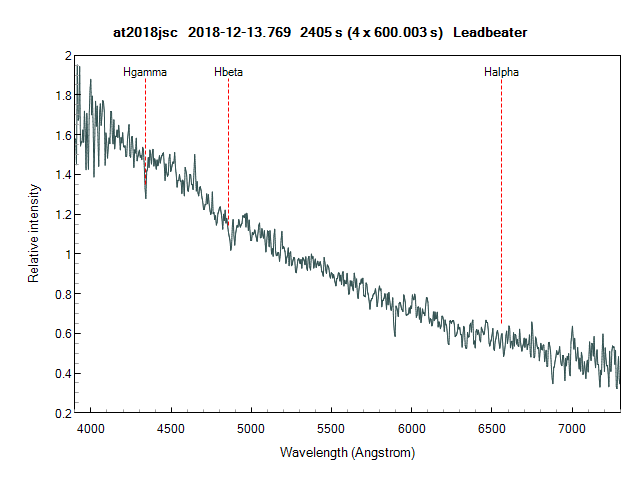
Robin LeadbeaterParticipantAn ALPY 600 spectrum in poor conditions (thin cloud) shows a blue continuum, weak H beta and gamma in absorption and no detectable H alpha
 Robin LeadbeaterParticipant
Thanks Nick,
Just to finally put this one to bed, I checked the reflectance spectrum in a 3 arcsec window at the centre where the nucleus would be if it were detectable and compared it with the region between 5-10 arcsec from the centre where the reflectance component is still strong but outside the nucleus. They both show the same trend of decreasing reflectance towards the blue so there is no evidence of the nucleus in the spectrum. I am a bit surprised about the dust reflectance spectrum though. I had expected perhaps the opposite trend with enhanced scattering in the blue.
Cheers
Robin
Robin LeadbeaterParticipantI’ve found this reference for a measurement of the nucleus by the HST
http://adsabs.harvard.edu/abs/1998A&A…335L..25L
“ The color of the nucleus is moderately red with a gradient of 10% per 1000 Angstroms at optical wavelengths”
which is consistent with my measurement of the reflectance spectrum of the inner region. This is not proof that we are seeing the nucleus of course but the similarity is interesting
Robin
Robin LeadbeaterParticipantHi Nick,
A figure I have seen for the diameter of the nucleus is 1.2km so a quick back of envelope calculation using the brightness of the moon as a reference and assuming the same albedo suggests that the naked nucleus would have a brightness of ~ mag 12 currently.
(distance ratio)^2 ~1000. x (diameter ratio)^2 ~10^7 = 10^10 = ~ 25 mag + mag -13 = ~ mag 12
(corrected)
which is in the ball park of what I would have guestimated it to be from the guider image. I suspect you are right though and the nucleus is indeed hidden from view by dust.
That green channel profile includes a lot of Swan band emission. Here is a vertical slice through the spectrum in a region devoid of emission lines.
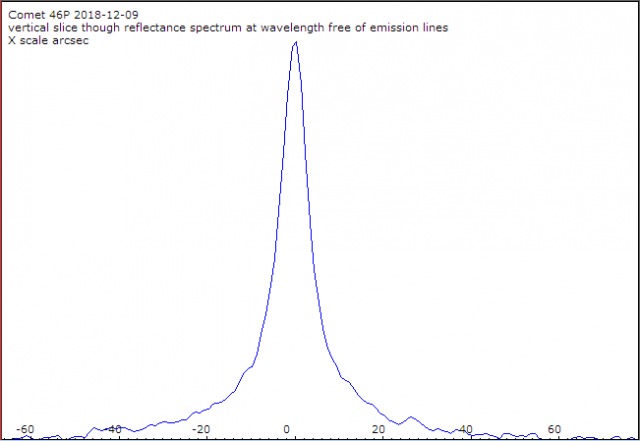
It is much narrower with the reflected/scattered component mostly confined close to the centre in a region with FWHM ~ 8arcsec. There is some spread, presumably dust, but approximately 30% of the total flux comes from a region similar in width to that produced by a star in the spectrograph which with my setup is typically ~5 arcsec FWHM (wider than a normal image due to astigmatism in the spectrograph optics and guiding errors)
Cheers
Robin
-
AuthorPosts