Forum Replies Created
-
AuthorPosts
-
 Robin LeadbeaterParticipant
Note that although an early spectrum of sn2019np was taken by the Li-Jiang telescope, the official confirming spectrum was actually taken several hours earlier using Faulkes Telescope North and uploaded to the Transient Name Server (As it happens 4 minutes before the Atel #12374 was issued, though since 2016 the TNS has been the official IAU system for recording supernova discoveries and confirmation)
https://wis-tns.weizmann.ac.il/object/2019np
There are also three amateur spectra of this SN in the BAA Spectroscopic database
and more spectra on the ARAS forum here covering the evolution up to currently 17th Feb
http://www.spectro-aras.com/forum/viewtopic.php?f=38&t=2205
Cheers
Robin
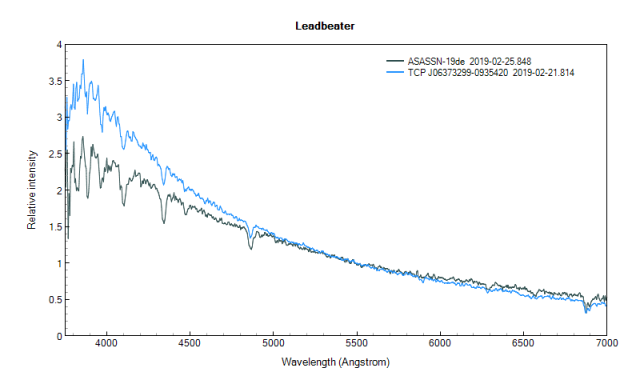
Robin LeadbeaterParticipantAnother spectrum last night. It has cooled significantly (to ~15000K) and the Balmer absorption lines are more pronounced
Robin
 Robin LeadbeaterParticipant
Hi David,
I’m afraid I am not enough of an expert to interpret spectra of CVs, beyond being able to tell the difference between the spectrum of a classical nova and one of a dwarf nova. This is a typical spectrum of a dwarf nova in outburst. In this case a large amplitude outburst of a star with no previous history of outbursts so a likely WZ Sge (UGWZ) type (I am reliant on Patrick Schmeer for this classification)
The source of the additional flux is impressively hot. The continuum fits to a ~35000K Planck curve, like an O star
Robin
Robin LeadbeaterParticipantI thought this was a BAA meeting
Robin LeadbeaterParticipantI’ve just seen there is now a revision to the path noted at the bottom of the page. (The original track was calculated based on the position of the centre of mass of the A-B system rather than Sirius A !
I hope you have not already made your travel plans !
Robin
Robin LeadbeaterParticipantJust spotted this on the S&T website
https://www.skyandtelescope.com/observing/will-sirius-disappear
“Monday night, February 18th. That evening around 10:30 p.m. MST (5:30 UT February 19th), there’s a good probability that the 17th-magnitude 4388 Jürgenstock will occult the sky’s brightest star for up to 1.8 seconds.”
The event is not visible from the UK but anyone on the narrow path though North America could get (very a brief) view of Sirius B free from the glare of its bright companion. (Sirius is predicted to be totally eclipsed for just 0.2sec !)
Robin
Robin LeadbeaterParticipantI’ve not done any scientific measurements but when I made mine I read that most dew shields are too made short and they should be 3x the aperture. This does look rather long though and gives problems with the mount in a breeze.
I first saw the newspaper trick on a small refractor at a sky party in Denmark. Most people who did not have heaters were struggling with dew but not this guy. (I think perhaps he changed it once during the night when it got too soggy)
Robin
Robin LeadbeaterParticipantAs an aside, dew is less of a problem in breezy conditions as the airflow is constantly removing the cooling boundary layer of air over the surface where dew is forming. (Which is just as well as my dew shield acts as a sail !)
Robin LeadbeaterParticipantDew forms on a surface when the temperature of that surface falls below the dew point. A surface exposed to the clear night sky cools by radiating heat out into space which is only a few degrees K (This is an over simplification of course as the atmosphere blocks the radiation at some wavelengths but you get the idea). A dew shield works by limiting the angle over which the heat can be radiated away. Cooling still takes place but more slowly. There may be other effects. For example some people swear by rolled up newspaper or other absorbing material which perhaps preferentially absorbs the moisture in the air close to the optics.
Cheers
Robin
Robin LeadbeaterParticipantHi Eric,
If you were transmitting you might want to tune it more precisely to provide a better match to the transmitter but a 3 element yagi antenna tuned for 144-148MHz should work ok at 143MHz for receiving. (It would be difficult to retune in any case as you would need to increase the length of the elements slightly). For example there is an article on the BAA radio astronomy website showing a 7 element yagi centred on 143 MHz with a flat response over +-7MHz bandwidth, fig 2.9 on page 8 here
https://www.britastro.org/radio/projects/Antennas_for_meteor_radar.pdf
Robin
Robin LeadbeaterParticipantHi Eric,
Is this specifically using the Graves transmitter on 143MHz ? If so a small 2m amateur band yagi could be a good choice. Like these perhaps
https://www.radioworld.co.uk/hygain-2m-3-el-beam-500w—vb-23fm
https://hamradiostore.co.uk/cushcraft-a148-3s.html
Cheers
Robin
Robin LeadbeaterParticipantHi George,
The fits file is 2 column data table (wavelength and flux) not an image so Maxim does not understand it. You can view the data in a free general fits data viewer like NASA’s fv for example or alternatively download the dat file version and view it in notepad, excel etc. Better though is to view it in a free dedicated spectroscopy program like Visual Spec or ISIS etc. I have also loaded it into the BAA spectroscopy database so you can view it there too.
https://britastro.org/specdb/data_graph.php?obs_id=3607
Cheers
Robin
Robin LeadbeaterParticipantHi George,
There is another one classified by me last October which was then also confirmed by professionals
https://britastro.org/node/15857
but I dont know of any others.
It would be nice to have a higher SNR spectrum to confirm the presence of other features (eg Fe curtain or He, N lines) but that would need a larger telescope. The spectroscopic evolution of an initial blue continuum with a strong H alpha emission emerging over time with around this velocity is characteristic of a nova though.
Cheers
Robin
Robin LeadbeaterParticipantThe spectrum has now developed sufficiently to attempt a classification.
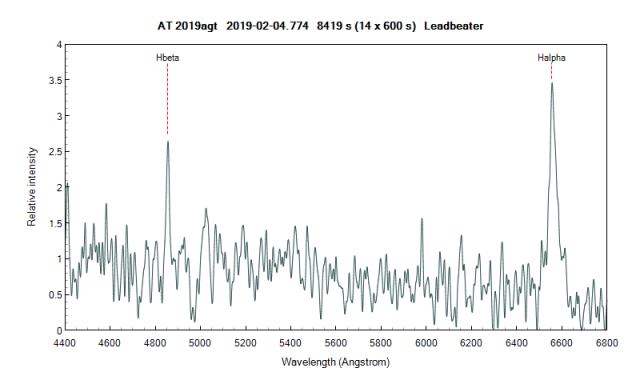
It shows a clear broad (~1600km/s FWHM ) Ha alpha emission line and an H beta emission line at the expected radial velocity for this region of M31 so in the absence of any professional spectra, I have classified it as a Nova in TNS.
Robin
Robin LeadbeaterParticipantI spent 2 more hours on the spectrum last night but no better. (The “light pollution” from the galaxy is just too much. The sky background in the slit is ~8x the star signal) so no spectroscopic confirmation yet I am afraid. If there is still no confirming pro spectrum I might try again in a few days when any characteristic spectral features should have developed more.
Robin
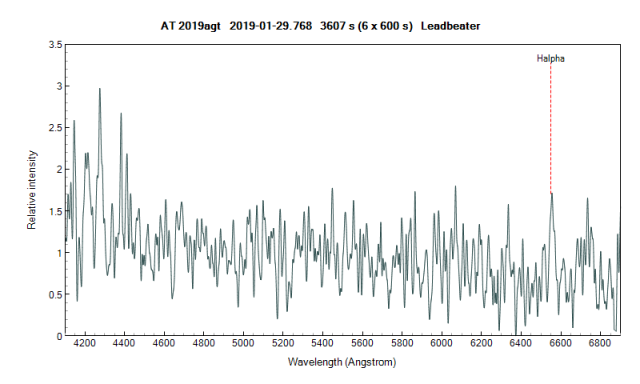
Robin LeadbeaterParticipantVery noisy at an SNR of just ~3-4. A blue continuum with no obvious features (though they would have to be very strong to show at this SNR) There is an emission feature at H alpha at the expected local velocity (-500km/s) but it could equally well be just noise.
Robin
 Robin LeadbeaterParticipant
On it now with the ALPY 600. It is there but barely above the background. Perhaps a hint of broad H alpha. Rain is due in 10 mins so an hours worth is all I am going to get tonight.
 Robin LeadbeaterParticipant
Nice find George/Nick !
I saw this pop up on my TNS alert yesterday but the skies had just clouded over. You are probably right though unless it brightens a bit. mag 17 is extremely marginal for me for a spectrum with enough resolution for a firm confirmation (ALPY 600) and as you say, the bright background wont help. It is on my list though. (I am starting to look at the potential to confirm M31 novae spectroscopically so if you like, you can contact me direct for a confirming spectrum if you find something interesting. The M31 season is probably closing for this now though as I need at least a couple of hours fully dark and at good altitude)
Cheers
Robin
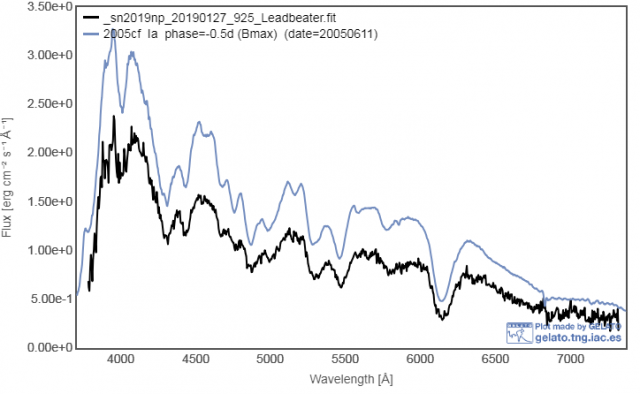
Robin LeadbeaterParticipantA spectrum from last night with the ALPY 600 compared with a best match type Ia near maximum from GELATO
 Robin LeadbeaterParticipant
Peter Somogyi has now posted an amateur spectrum on the ARAS forum using an ALPY 600
http://www.spectro-aras.com/forum/viewtopic.php?f=38&t=2205#p12098
He has also posted a spectrum of sn2018hna which I classified as a type II when discovered back in October 2018 at mag 16 but strangely has been rising steadily since it was discovered and is currently mag 13.7
http://www.spectro-aras.com/forum/viewtopic.php?f=38&t=2214
The differences in the spectrum between the two (Ia and IIP) are very obvious
Cheers
Robin
-
AuthorPosts