Forum Replies Created
-
AuthorPosts
-
 Robin LeadbeaterParticipant
Planetary imaging with an undriven mount is very hard work because of the rate of drift at the high focal length used to get good resolution.
Robin
Robin LeadbeaterParticipantThere are now 2 pro spectra confirming it as a supernova, type 1c
Robin LeadbeaterParticipantHi Martin,
Thanks for the update. That is bad luck. I think in Ron’s position I would have reported it on TNS as a possible SN noting there that it appears to be coincident with SN2010ct. If it was SN2010ct, that would mean that it was not classified correctly originally so it could have been an SN this time. It is still only a possible though so far of course until a spectrum is taken. Only 18% of possible SN submitted to TNS were confirmed last year.
I have had a look at the original confirmation CBET for SN2010ct. I must say the description of the spectrum does sound convincingly like a type II SN and not an LBV outburst.
http://ned.ipac.caltech.edu/cgi-bin/ex_refcode?refcode=2010CBET.2323A…1S
Cheers
Robin
Robin LeadbeaterParticipantI see the Zwicky Transient Facility spotted it 9 days ago but only reported it on TNS today.
https://wis-tns.weizmann.ac.il/object/2019cda
There are not so many unique amateur discoveries these days with all the robotic surveys. I am starting to see the same with my spectroscopic confirmations as more dedicated pro spectroscopic capability comes on line. Initially when I started in 2016, most of mine were stand alone confirmations but now most of them eventually get a second pro followup spectrum.
Robin LeadbeaterParticipantHi Paul,
I posted it here because it is time critical (The BAA meeting on Wednesday)
Cheers
Robin
Robin LeadbeaterParticipantHi Dominic,
I would agree that follow up is likely to be more productive but you underestimate the determination of the amateur. It has already been done
https://arxiv.org/abs/1804.05551
The issue is not so much the precision of amateur photometry or lack of untouched sky to explore but the numbers game. You have to spend an awful lot of time looking at an awful lot of stars to find one transiting exoplanet candidate and even then you need luck. You would need a survey on the scale of the one run by Stan Waterman for example who found a fascinating gamut of variabilty in his “Kepler before Kepler” survey but no planets as far as I recall
http://www.stanwaterman.co.uk/variablestars/
Cheers
Robin
Robin LeadbeaterParticipantThere’s another returning supernova impostor (An LBV in NGC4559) which might be in range currently (It was mag 17.5 a couple of weeks ago.)
http://www.rochesterastronomy.org/sn2012/lbvn4559.html
Robin
Robin LeadbeaterParticipantHi Bill,
Well I had to guess as you have not revealed “where the experts went wrong” 😉
Robin LeadbeaterParticipantHi Bill,
I remember reducing some photographic spectra for Ed Majden some years ago. Not sure what he did with the results though.
You can get variations in dispersion across the field in objective grating spectroscopy due to geometric distortions caused by the lens optics (eg pincushion/barrel etc) though I am guessing this was not the problem here. It is possible to characterise them (though not so easy retrospectively) by moving a check star spectrum around the frame (This technique also useful for characterising flat field effects which are very difficult to correct for otherwise in slitless spectra)
Cheers
Robin
Robin LeadbeaterParticipantHi Andy,
I suppose it depends on exactly what happens at the point of merger or perhaps just before. We do know that there are double degenerate systems with a total mass well beyond the Chandrasekhar limit eg
https://arxiv.org/abs/1609.00178
Although we do not have good independent distance measurements, the tight correlation between redshift and Ia maximum brightness (after correction for the light curve shape) does not suggest two obvious populations.
A mix of single and double degenerate progenitors giving different luminosity supernovae could be problematic for cosmological models though as the ratio of single and double degenerate systems might be dependent on the look back time. This has been even used in an argument supporting the double degenerate model as being the dominant mechanism.
https://academic.oup.com/mnras/article/417/2/916/983573
Cheers
Robin
Robin LeadbeaterParticipantHi Paul
Since you have plenty of photons such that stochastic precision is not a problem it could be worth considering a choice of filter to minimise the systematic errors which are likely to dominate at the mmag level. Bruce Gary’s on line book has some suggestions
http://brucegary.net/book_EOA/EOA.pdf pp 28-29
Cheers
Robin
Robin LeadbeaterParticipantYes the white dwarf merger scenario for Ia supernovae is still very much alive and I believe is suspected by many to the the primary mechanism. The empirical relationship between Ia supernova distances and other measurements of distance still seems to hold though regardless of the mechanism. It is worrying though that we are relying on a standard candle without a clear understanding of the mechanism.
A shameless plug here – studies of SN2018oh, which I classified, contributed to this Ia mechanism controversy though without any clear conclusion.
https://arxiv.org/abs/1811.09635
Robin
Robin LeadbeaterParticipantRobin LeadbeaterParticipantHi Tony
Yep they are Relco 480 starters, though I believe Shelyak sort them, probably based on trigger voltage. Their power supply is also designed to prolong their life (constant current ?)
I have some notes on this that Francois Cochard published somewhere. I will dig them out
Cheers
Robin
Robin LeadbeaterParticipantFrancois Teyssier on the ARAS forum is a good amateur contact for information on spectroscopy of symbiotics. He produces a regular Eruptive Stars Spectroscopy Newletter which includes regular comentaries by Prof Steve Shore and is now listed on ADS, unusual for an independent amateur publication
http://www.spectro-aras.com/forum/viewtopic.php?f=33&t=2254
Back issues are also available here
http://www.astrosurf.com/aras/novae/InformationLetter/InformationLetter.html
Cheers
Robin
4 March 2019 at 8:40 pm in reply to: Calibration of Lhires spectra with impoverished calibration spectrum #580798Robin LeadbeaterParticipantHi Kevin,
With the manual dispersion function in ISIS you double click either side of each line in the uncalibrated (combo) spectrum and ISIS calculates the exact pixel position of the centroid of the line and enters the value in the table. You have to tell it to look for either an emission or absorption line within the two clicked positions though (buttons at the top of the window) so you would need to click “absorption” before measuring the water line positions and “emission” before measuring a lamp line.
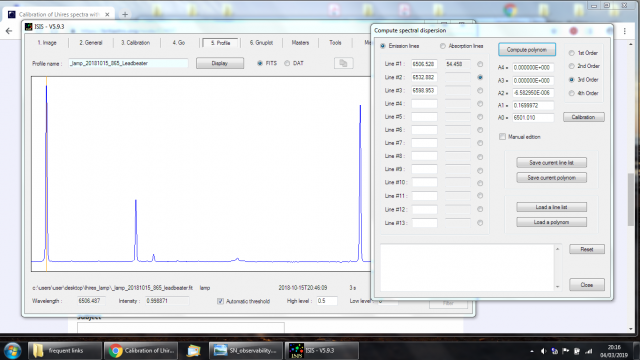
Yes, if you set the reference line to 0,0 it just uses the predefined dispersion equation but if your dispersion was measured on a reference star with the telescope pointing in a different direction to the target, this can be out by a constant shift due to flexure so adding a reference point using a lamp spectrum corresponding to the target will correct for this. (correcting the constant in the polynomial)
Robin
4 March 2019 at 2:54 pm in reply to: Calibration of Lhires spectra with impoverished calibration spectrum #580793Robin LeadbeaterParticipantHi Kevin,
It should work ok provided you don’t see any fixed offset between water and lamp lines. (You would see this for example at H alpha if you always need to make a consistent correction using the water lines.). Don’t forget to switch between absorption and emission for the specific line you are measuring in the dispersion calculation tab. I would suggest calculating the dispersion just on the reference star where the SNR in the water lines is likely to be higher and then using this calculated dispersion on the target with one of the neon lines as a reference point to correct for any flexure offsets.
Alternatively have you tried a long exposure with the Ne lamp to see if you can see any weak Ar lines to use instead of the Ne lines? (I could see some with my Ne lamp but they are more obvious now I have upgraded to the NeAr lamp)
Cheers
Robin
Robin LeadbeaterParticipantNote that the dedicated 1:1 duplicators designed for use with full frame SLR will crop slides when used with DSLR with smaller sensors so you might need to modify them eg with an extension tube. I think you can get versions with 0.6 reduction for DSLR though
Robin LeadbeaterParticipantIf you have a digital camera with a macro lens you could rig up something like this.
https://www.scantips.com/g4/p1230510.jpg
from this page
https://www.scantips.com/es-1.html
I have used this sort of setup in the past using the sky as a light source and a cardboard tube to keep the light out but the results depend on the quality of the lens (Star fields tend to show up any deficiencies, like pincushion etc)
Cheers
Robin
Robin LeadbeaterParticipantI see today that S&T prefers Godzillas
https://www.skyandtelescope.com/astronomy-news/pluto-charon-missing-small-craters
Robin
-
AuthorPosts