Forum Replies Created
-
AuthorPosts
-
 Robin LeadbeaterParticipant
For those of us further north it can sometimes be more interesting looking in the other direction 😉
 Robin LeadbeaterParticipant
Looking forward to seeing how faint the TRAGOS might go. It could potentially be a nice alternative to the modded ALPY 200 for supernova work. (I have had some interest but copying it has been thwarted due the the unavailabity of the 200l/mm grism) What resolving power will your TRAGOS give ?
Robin
Robin LeadbeaterParticipantIt is not down to social media though. Unfortunately this originates and is spread throughout the main stream media
From USA today
To the evening Chronicle
Robin LeadbeaterParticipantNow we have the date for maximum, we can compare the velocity in the Si II 6355 line with other type Ia supernovae. It does appear this one is indeed towards the high end, similar to sn2002bo for example.
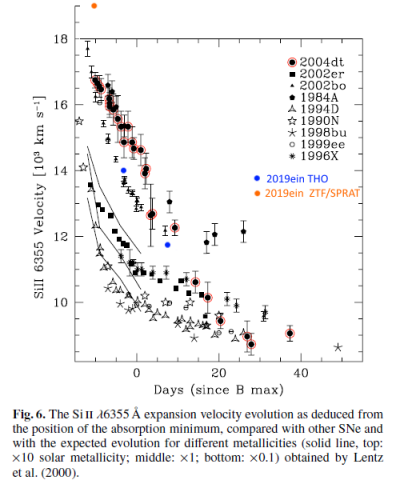
Robin
Robin LeadbeaterParticipantIt looks like maximum (g mag) was reached 2019-05-15 according to the ASAS-SN light curve
https://asas-sn.osu.edu/light_curves/078780dd-d80f-495e-95d6-d32d31ed2523
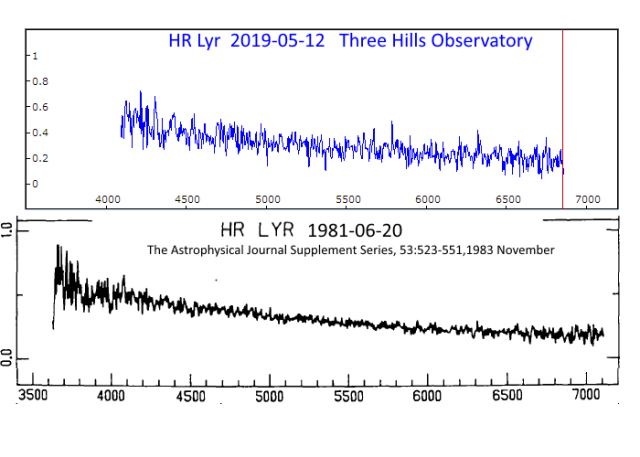
Robin LeadbeaterParticipantA very noisy low resolution ALPY 600 spectrum (It should be possible to do better) is similar to a low resolution 1981 spectrum from the literature.
It shows a blue continuum with no obvious emission lines, though there is a hint of some small features common to both spectra
Cheers
Robin
Robin LeadbeaterParticipantAssuming it does not get any brighter, the magnitude is about right for a Ia at the distance of NGC5353, perhaps a little faint but I think it is particularly tricky to measure redshift from Ia supernova spectra. Unlike type II where at least you have H alpha emission unshifted by the explosion velocity, you just have broad absorption lines blue shifted by the explosion, the velocity of which reduces with time. If I understand correctly how SNID for example estimates the age and redshift, it attempts to simultaneously fit these two parameters, comparing with other spectra in the library. It can be significantly out at times though. It is possible that the explosion velocity is higher than usual as suggested by the original classifiers, which could then throw out the redshift estimate. Also the published redshift of NGC5353 is probably for the nucleus and this SN is in the outer regions where the radial velocity might be different. The light curve should eventually give the age though which perhaps will pin things down better.
Cheers
Robin
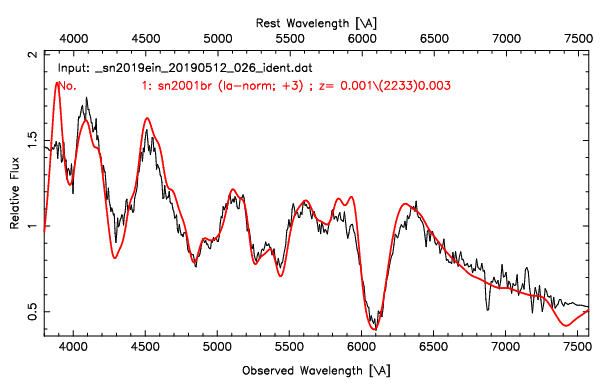
Robin LeadbeaterParticipantAt last some decent clear skies !
An ALPY 600 spectrum from 20190511 (black) overlaid on the best fit from SNID (red). A typical type Ia near maximum
Robin
 Robin LeadbeaterParticipant
Now reported mag 13.5
Robin LeadbeaterParticipantYes I noticed that too. I guess we don’t have our own mm wavelength capability (eMerlin works down to 1cm I think) though we must have a small share in ALMA through ESO I suppose.
Robin
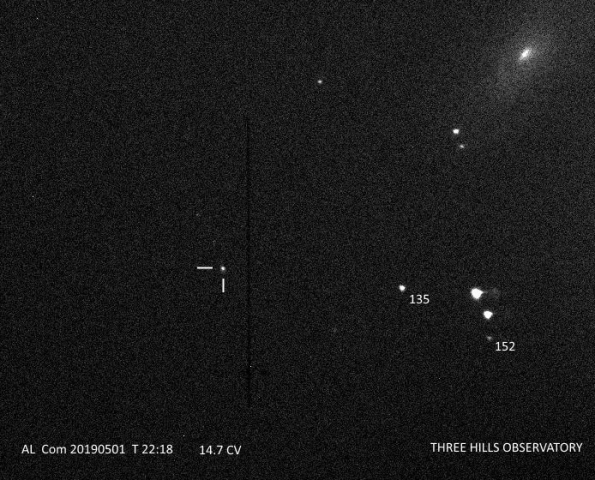
Robin LeadbeaterParticipantA rough magnitude estimate off the spectrograph guider (20s exposure) gives 14.7 CV
 Robin LeadbeaterParticipant
Rather late to the party but here is a spectrum from 2019-05-01 using the ALPY600.
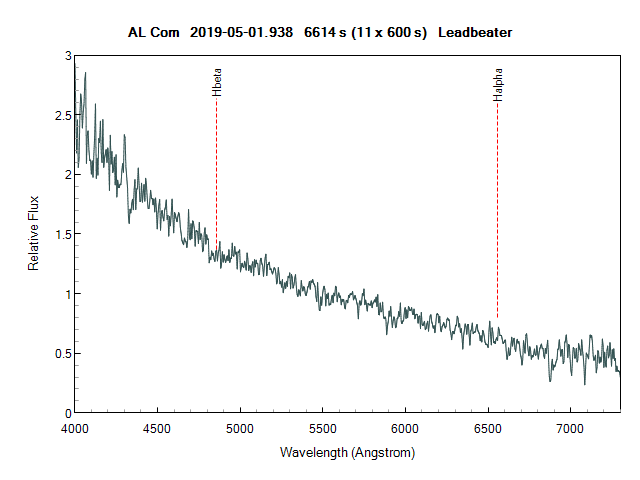
Typical of a dwarf nova in outburst. I’ve marked H alpha, beta but there is nothing obvious there above the noise (max SNR~30, deteriorating towards the ends) at this resolution.
Cheers
Robin
Robin LeadbeaterParticipantAccording to VSX, EF Cep is an eclipsing variable type W Uma with a period of 0.606072d which if Wikipedia is correct makes it a type A and should consist of two stars of type A-F which from the look of the spectrum I would say is correct. (A quick overlay of Pickles spectra suggests a type F2iii is a pretty good match for example)
Robin
Robin LeadbeaterParticipantHello Jack,
I think the HD43378 in the filename refers to the reference star used (a MILES star). The spectrum is of EF Cep which does not even appear in Brian Skiff’s huge database of published spectral types so yes this might well be the first published spectrum of this star.
Cheers
Robin
Robin LeadbeaterParticipantThanks Andy,
I wonder how compact the emission line source is compared to the region shown in the radio image. (unfortunately the spectrum was not very well focused at H alpha so the extent is not clear in my spectrum)
Robin
EDIT this image and spectra from HST suggests the main emission region region extends around 1 arcsec or so across
http://www.rpi.edu/dept/phys/courses/79205/Pics/HST95/diskM87Data.gif
Robin LeadbeaterParticipantHi John,
I have added links to the AAS article on the radio image (just 50 micro arcsec across !) and the source of the 2008 comparison professional spectrum.
Cheers
Robin
Robin LeadbeaterParticipantAh SPC, Western Electric Rules etc. I remember that became the thing at work after my boss made a trip to Japan. I then pointed out the various places in the paper mill where I had effectively already implemented it (though not by name) !
Robin LeadbeaterParticipantHi Andrew,
If you are working in the first order there is no overlap at the UV end so no need to use an IR cut to get the UV part of the spectrum. The response of the Star Analyser rolls off quite rapidly at the UV end though. Note that the zero order has a rather odd spectral content. (Effectively the inverse of the grating response, so predominantly contains the blue and red ends with the central wavelengths missing.) An IR cut filter before the grating might therefore be useful to enhance the sensitivity of the zero order to changes specifically in the blue without affecting the spectrum as the IR part of the 1st order spectrum would be invalid in any case without an order filter to cut the overlapping 2nd order blue end. I’ll see if I can dig out the raw spectra for you to play with
Cheers
Robin
Robin LeadbeaterParticipantAn interesting idea Andrew.
For anyone interested, there is a more in depth analysis of that event here (2:28-12:30)
https://britastro.org/video/13862/14769
I was indeed lucky and spent a few more nights without catching anything. An auto system should determine how common they are. What do you plan to trigger on?
Increase in total (or wavelength specific eg blue) flux relative to other field stars ? (Might still be triggered by cloud movement at high cadence)
Increased temperature – flux(blue)/flux(red)? (Should be relatively insensitive to clouds which are ~grey and slow changes due to extinction)
Change in H alpha flux ? (Does H alpha generally change during these events? In this case the excess flux did appear to show some additional H alpha/beta emission). Andy Wilson’s speciality I think
Robin
Robin LeadbeaterParticipantHi Ron,
I don’t have much experience in planetary imaging but in slit spectroscopy the sky background, measured above and below the target spectrum, is similarly subtracted from the spectrum image. When this is done however it is important that the software preserves any negative pixel values that are generated (due to noise in the image). If the negative values are clipped to 0 you do not get the correct total flux values. I think the same will apply here. Are the two images in your document before any sharpening ? If so I would say there is clear signs of clipping. (You could perhaps check by taking a profile through the two images before sharpening . The brightness of the planet limb should merge smoothly into the background due to the finite resolution of the imaging system). It depends to what use the image is going to be put but if there is any clipping, I would expect any measurement of total flux or diameter for example not to be reliable.
Robin
-
AuthorPosts