Forum Replies Created
-
AuthorPosts
-
 Robin LeadbeaterParticipant
I have now approximately subtracted the emission component from the spectrum of the central 6 arcsec and divided it by the solar spectrum to produce a reflectance spectrum.
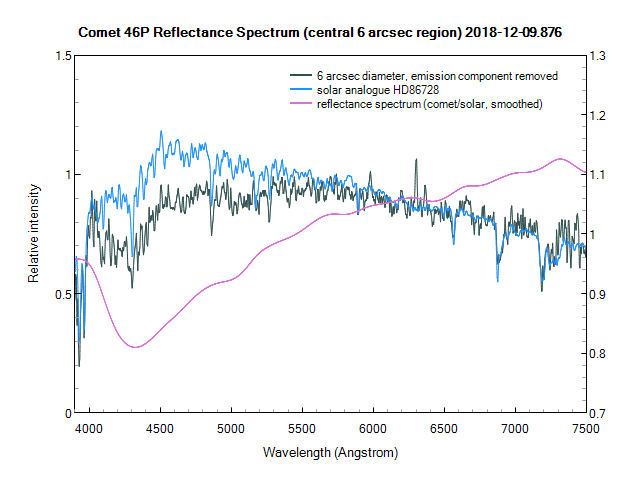
It looks similar to some asteroid reflectance spectra. Since the central region is so condensed and from images there does not appear to be much dust is it possibly representative of the comet nucleus albedo or is it just scattering from dust of a particular particle size distribution? Does anyone have a feel for how bright the nucleus would appear in reflected sunlight at this distance if not active?
Robin
Robin LeadbeaterParticipantHere are my reduced spectra.
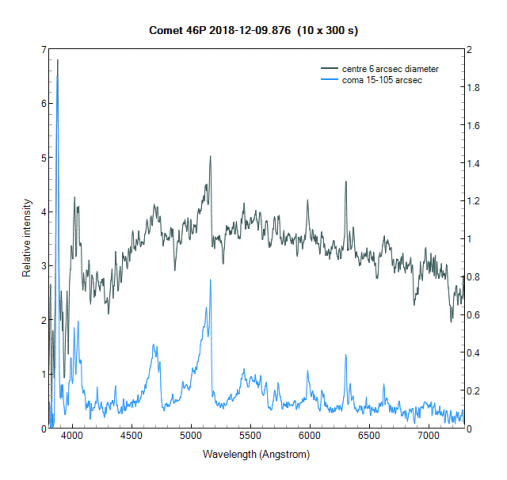
The diffuse coma integrated along the slit above and below the bright condensed region between 15 and 105 arcsec from the centre. Since the coma extended beyond the length of the slit the sky background was measured separately and subtracted. All the usual molecular components are there (CN is particularly intense in the UV) but no obvious Sodium.
The bright central region (6 arcsec diameter), again with the separately measured sky background subtracted showing the same emission components seen in the outer coma superimposed on a continuum spectrum with absorption lines.
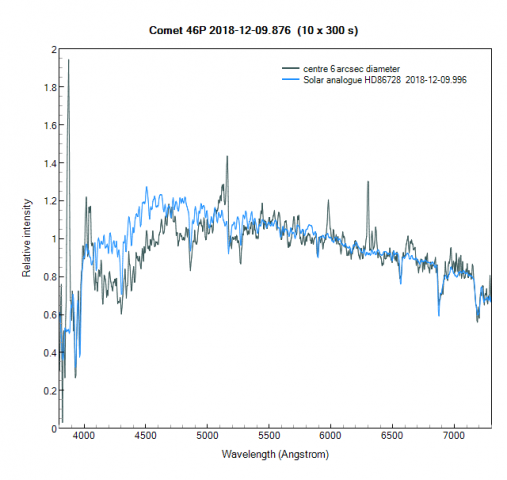
The overall shape of the continuum and the absorption features match that of the solar spectrum (here compared with a solar analogue star taken the same night), though there appears to be a lack of flux from the comet around 4000-5000A ie the reflected light from the comet is deficient in the blue part of the spectrum
Robin
Robin LeadbeaterParticipantI cast it to my TV and wound up the volume. It was almost like sitting at the back of the theatre. Thanks to all who made this work
Robin LeadbeaterParticipantAnyone see the link ?
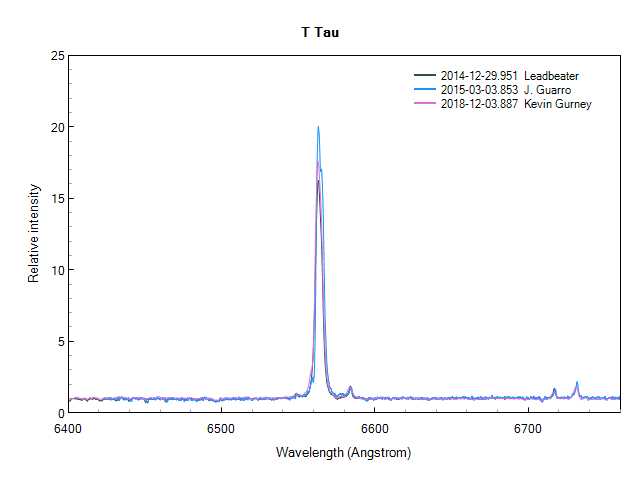
Robin LeadbeaterParticipantHere are some comparisons from the BAA database. (quick and dirty, no helio or telluric or continuum corrections)
 Robin LeadbeaterParticipant
“But on the ARAS databse…..the link for T Tauri is greyed out, and the direct link from the home page goes to a broken link..?”
Yes I noticed that. I have put a note on the thread asking it to be fixed. A timely reminder to everyone to mirror their results in a reliable long term database like the BAA one ! (mine and GJF are in there)
Cheers
Robin
Robin LeadbeaterParticipantSome of the emission also comes from a nebula surrounding T Tauri see my spectrum image here for example
http://www.spectro-aras.com/forum/viewtopic.php?f=5&t=1033&start=10#p4659
so perhaps what you see in these forbidden lines depends on how tightly you set the binning and sky background regions and how the slit is orientated
Robin
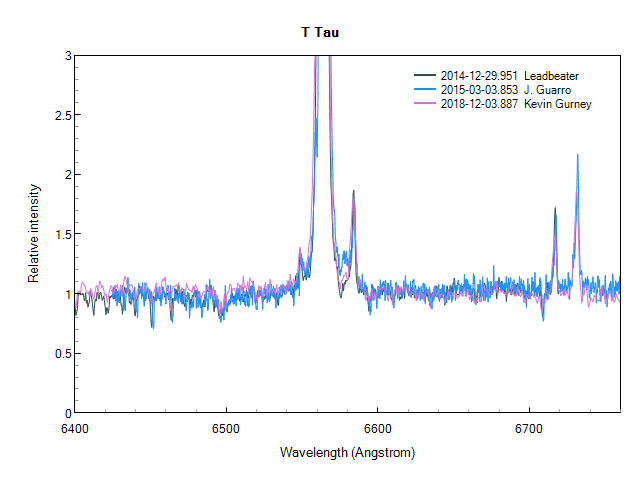
Robin LeadbeaterParticipantHi Kevin
There is a series of around 35 spectra of the H alpha region from me and Joan Guarro Flo covering December 2014- March 2015 in the database. (I think taken as part of a Pro-Am project but I forget exactly what, I will look it up) How does yours compare ?
Robin
EDIT they were taken as part of this project (I actually made a note on the spectra in the database, seen if you tick to see all fields)
requested by Hans Moritz Guenther http://www.spectro-aras.com/forum/viewtopic.php?f=5&t=1033
Robin LeadbeaterParticipantA nice looking instrument Tony.
I like the idea of a high(ish) resolution version. Like the LHIRES, the chromatic aberrations should be less of an issue. The foot of the lamp lines look rather broad though. Do you think this is down to the quality of the optics? (I think I remember seeing something similar with a batch LHIRES which had poor quality doublet lenses, seen as an “elephant’s foot” shaped lines) . What focal ratio are you running ?
Did you see the results Terry Bohlsen recently posted from his version at similar resolution (presumably also with an 1800 l/mm grating) on ARAS ?
http://www.spectro-aras.com/forum/viewtopic.php?f=5&t=2172#p11890
Cheers
Robin
Robin LeadbeaterParticipantHere is the reduced spectrum. (red, filtered to R~300 resolution)
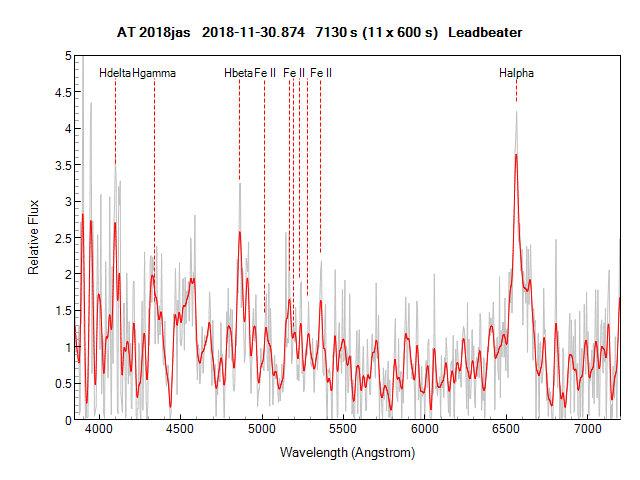
mag ~17 is the faintest target I have attempted with the ALPY600 setup and the SNR is very low. The broad H alpha line is obvious though and other Balmer lines are present too. I have also marked the Fe II curtain lines though they are only marginally detected above the noise.
Cheers
Robin
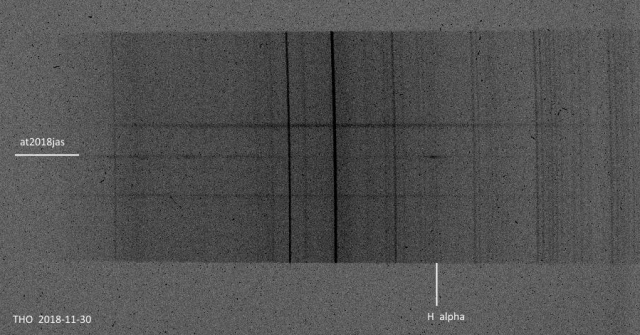
Robin LeadbeaterParticipantHere is a raw spectrum image from tonight (ALPY 600, 6600s total exposure.) It is very faint but the broad H alpha emission is clear. I will try to reduce it to see what else I can pick out
Robin
 Robin LeadbeaterParticipant
Went for a spectrum last night with the ALPY 200 but found that a series of power cuts during the storm yesterday had corrupted the observatory computer drive. 15.6 is bright for an M31 nova so definitely worth trying for even with a standard ALPY and novae spectra still show strong emission features later on even when they start to fade in measured brightness.
Robin
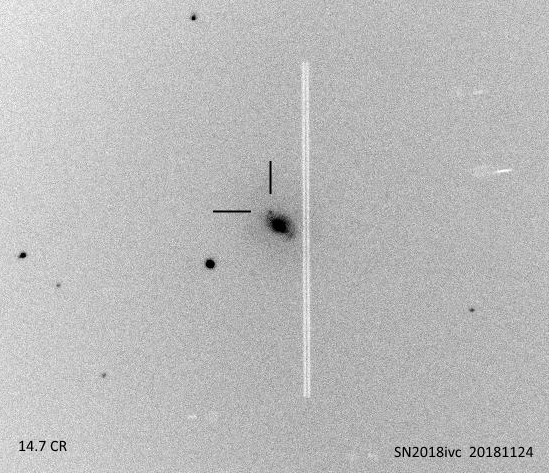
Robin LeadbeaterParticipantHi James
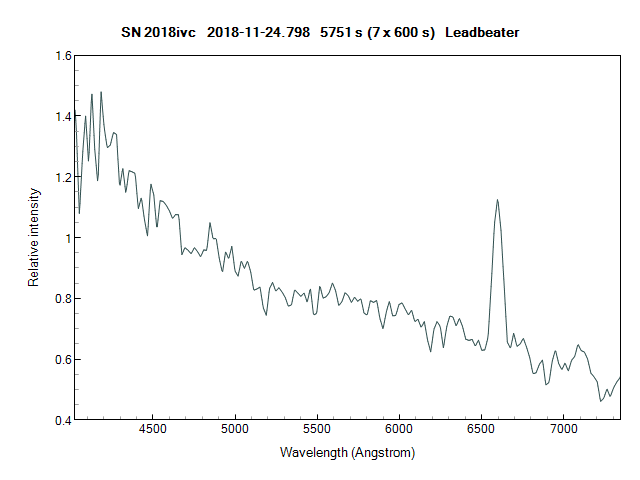
That is nice image of SN2018ivc I took a spectrum on 24th and found it quite tricky to separate it from the galaxy core. Here is what it looked like in the spectrograph guider, and a low resolution spectrum showing H alpha emission at the galaxy redshift, characteristic of a core collapse supernova (It was already too low for me when it was announced the night before so I was beaten to a classification for this one by professional teams in Japan who got there a few hours before me)
Cheers
Robin
 Robin LeadbeaterParticipant
Hi Kevin,
Are you emailing Francois Teyssier direct ?
http://spectro-aras.com/forum/viewtopic.php?f=16&t=804
(The on line system was innundated by spambots I believe)
Cheers
Robin
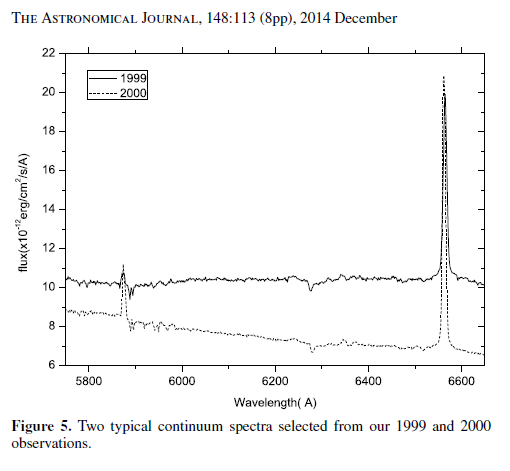
Robin LeadbeaterParticipantAn example from the literature of changes in the continuum picked up in low resolution spectra
 Robin LeadbeaterParticipant
Here is the trend in H alpha line strength (EW) since the disc loss episode in 1988 to ~2015, from fig 1 in this paper
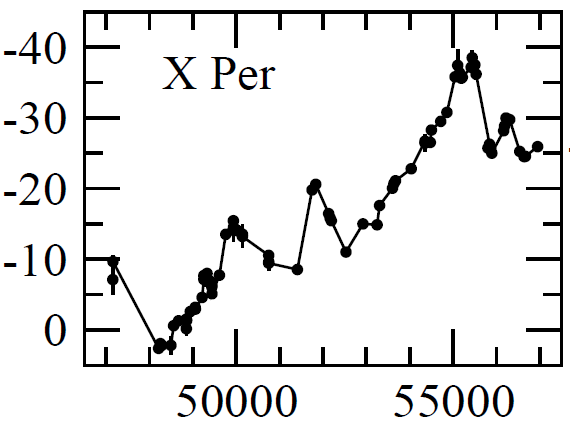
The EW currently is ~20 A so a continuing downward trend currently
Robin LeadbeaterParticipantThis paper shows examples of the long term variation (1987-2001) at H alpha and He 6678 including an episode where the disc was completely lost in 1988 and cyclic changes with periods 0.6-2 yrs
https://www.aanda.org/articles/aa/abs/2001/47/aa1796/aa1796.html
The variability that Kevin highlighted (and confirmed in the other spectra) shows small scale variations in the line profiles at much shorter timescales though
Robin
Robin LeadbeaterParticipantAs I understand it from Paul Roche’s comments this is a long term project (with a timescale of years), primarily to alert when there has been a change in the disc state, indicated by changes in the H alpha line so similar to typical Be star monitoring. Though this would likely change if something significant is seen. High resolution H alpha spectra will probably show more subtle changes first but a low resolution spectrum would also pick up significant changes in emission line strength so I would suggest an occasional look say once every few weeks or so, particularly if you see in the BAA database (where most of the campaign spectra are being stored) that there has been a significant gap since the last observation.
Cheers
Robin
Robin LeadbeaterParticipantHi Jack,
I use PHD2 but I find it can oscillate as Kevin describes. (It has some features useful for slit guiding like a virtual slit graticule and guiding on a specific location but does not have a specific algorithm to deal with a split star image)
I know Astroart has a specific slit guiding algorithm, though I have not tried it.
I think Prism is quite popular among the French spectroscopists. For example Olivier Thizy uses it with scripts to automate his observing
https://observatoire-belle-etoile.blogspot.com/2018/08/otzauto-finally-some-automatic.html
Cheers
Robin
Robin LeadbeaterParticipantHi John,
OK so comparing with the errors you had at the start of the thread it looks like you now have a good calibration across the range, including at H alpha where ISIS only uses lamp lines. We still do not understand why the lamp gives increasing errors towards the blue end but I think we should probably accept this as a win for now !
Cheers
Robin
-
AuthorPosts