Forum Replies Created
-
AuthorPosts
-
 Robin LeadbeaterParticipant
Hi Kevin,
Yes I believe the Zolner was indeed a direct vision spectrograph using a grating. (It may actually have been a grism) The cylindrical lenses were used to widen the spectrum to make the lines more visible. I think it was mounted after an eyepiece, making effectively a collimated design with the eyepiece acting as the collimator and the eye as the camera lens so perhaps more like a forerunner of the ALPY operated slitless. The basic price works out at around £200 in today’s money
Robin
Robin LeadbeaterParticipantHi John,
If something is moving in the spectrograph, you should see this in the lamp spectrum ie calibrating the lamp spectrum using an earlier lamp spectrum should show an error. The spring in the core module is there to hold the collimator lens in position, To hold the grism in position, the allen head grub screws should have been retightened after adjusting to make the lines perpendicular to the dispersion direction.
Cheers
Robin
Robin LeadbeaterParticipantHaving said that, comparing the line profiles of both the narrow lined star I used and the internal lamp, they have the same FWHM within 5% and there is no sign of asymmetry in line profiles across the spectrum in either case (dominated by the slit width) so it looks like this is not the cause.
Robin
Robin LeadbeaterParticipantHi John,
Don’t throw out your calibration module just yet !
There is a just detectable systematic difference between my ALPY internal lamp and the Argon “Filly Cross” lamp mounted at the edge of the telescope aperture in line with the slit but it is small (Calibrating the Filly lamp with the ALPY lamp gives +1A error around 7000A, 0 error around 5000A and -0.7 around 4100A).
Cheers
Robin
Robin LeadbeaterParticipantThe errors are within the FWHM of the slit image so I wonder if it could be something distorting the line profile eg :-
Coma from the ALPY camera lens distorting the line shapes more at the edges, which will depend on the f ratio of the incident light and appear as a variation in dispersion.
On stars, some sort of chromatic aberration in the telescope optics producing a wavelength dependent asymmetry in the psf of the star which alters the distribution of light across the slit and hence the line profile.
Cheers
Robin
Robin LeadbeaterParticipantHi John,
Your wavelength error trend using just the lamp lines seems similar to mine qualitatively eg post #37. Your variable offset as shown at H alpha is different to what I see though. My calibration is consistently good at H alpha.
I now have some data for the Filly lamp (I used the “cross” lamp which is just Argon) There does appear to be something subtly different. I will report back when I have figured out what is going on.
Cheers
Robin
Robin LeadbeaterParticipantOK, I have now manually calibrated using:-
The standard set of lines used by ISIS for the automatic fit (lamp lines only)
The same set with the 3946 line removed
The set of lines used for Hugh’s calibration in post #36, less the H alpha line which I do not see in my spectrum
The calibrated star spectra were identical every case with errors the same as those in my post #37, within the fit uncertainty of +-0.5A, even down to 3750A
Lamp spectra calibrated using these fits showed no significant wavelength errors so the problem, in my case at least, appears to be caused by some systematic difference in the way the spectrograph sees the internal calibration lamp compared with the star. The error is wavelength dependent rather than a simple offset so is going to be difficult to correct for.
I think my next step will be to check what my “filly dot” lamp, which is mounted over the telescope aperture, gives.
Cheers
Robin
Robin LeadbeaterParticipantHi Andrew,
Yes I was planning to do a manual run without that line (and will still do, and I will also try Hugh’s line set, which uses that line but also other different lines) though after looking at Hugh’s errors which are good past that wavelength and mine which deteriorate before then, I now suspect that may not be the problem. I also had a closer look at this line. As I said,it is a triplet and therefore suspect but in Richard Walker’s atlas the 3946.1 line of the triplet is significantly stronger so I doubt the error in that line is more than 1A at most.
Cheers
Robin
Robin LeadbeaterParticipantHere are my errors using the ISIS automatic calibration on lamp lines only (Heliocentric and RV corrected). It confirms what I have generally been finding with low errors at the red end increasing at the blue end. As expected the lines in the lamp spectrum are in exactly the right place (to better than +-0.5A). I also had a look at Hugh’s lines in my calibrated lamp spectrum and where different lines are used they are still exactly in the right place so it does not seem to be dependent on the lines used. (Note I could not use the 6562.85 lamp line (H alpha) as the Hydrogen has all leaked from my lamp which is a few years old now)
Cheers
Robin
lamp lines HD206165 ALPY calib wavelength error 7383.98 7065.2 -0.1 7147.04 6678.2 0.2 6506.53 6562.8 -0.3 6266.49 5875.7 0.2 5852.49 4921.9 -0.5 5400.56 4861.3 -0.7 4965.08 4387.9 -0.6 4764.87 4340.5 -0.5 4657.9 4101.7 -1.0 4545.05 4026.2 -2.3 4510.73 3970.1 -3.0 4158.59 3888.6 -2.8 3946.1 3835.4 -3.6 3797.9 -4.0 3770.6 -4.0 3750.1 -4.2 Robin LeadbeaterParticipantHi David
“Including the 3946.097A line gives a considerably worse fit at the blue end.”
I have had a look at the high resolution echelle spectrum of the lamp that Shelyak use in Richard Walker’s atlas. (plate 98 order 57) The 3946.097 Ar line that ISIS uses for a lamp line fit with the ALPY is in fact a close triplet 3946.097, 3947.505, 3948.979 so definitely incorrect. I don’t think this is connected with what John is seeing but I suspect this may be the cause of my increasing error towards the blue using just the lamp calibration.
I took a spectrum of MILES star HD206165 last night to experiment with. It is a B2i star so lots of narrow H and He lines which hopefully should show up any errors
Cheers
Robin
Robin LeadbeaterParticipantA good point. Buil seems to have done a reasonable job of selecting evenly spaced lines for the fit just using the lamp though and the fit residuals are much smaller than the errors seen. The use of a 4th order fit though does make me slightly nervous that we might be “fitting elephants” .
lamp lines used (EDIT 2018-11-02 Note these are the fit values, not the published wavelengths )
3946.331 4158.342 4510.673 4544.769 4657.878 4765.023 4965.325 5400.742 5852.471 6266.287 6506.282 7147.661 7383.626 Robin LeadbeaterParticipantHi David,
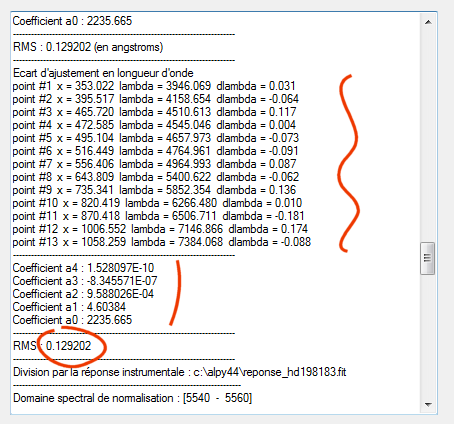
The ALPY calibration module has always had the NeAr lamp. The link I posted was specifically for calibration the ALPY. The first line used in the ALPY calibration is 3946.1 and the calibration deteriorates below there. eg
http://www.astrosurf.com/buil/isis/guide_alpy/calibration/fig_fr22.png
What is the first line you use with the LISA? (note some lines which might be resolved at the LISA resolution could be blends with the ALPY so not useable)
When calibrating the ALPY with the NeAr lamp, ISIS definitely reports the fit values not the published values. You can see examples on the page linked. For example
http://www.astrosurf.com/buil/isis/guide_alpy/calibration/fig_fr19.png
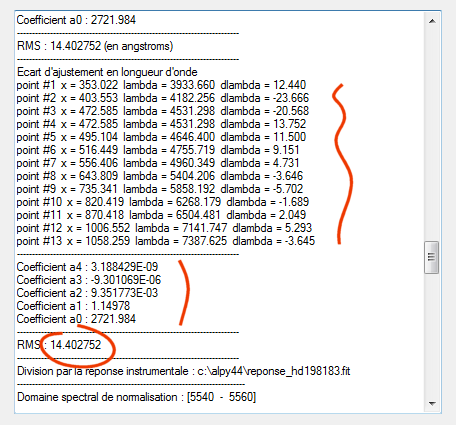
and for a bad calibration
http://www.astrosurf.com/buil/isis/guide_alpy/calibration/fig_fr23.png
Cheers
Robin
Robin LeadbeaterParticipantI like Andrew’s idea of calibrating using the lamp and then ofsetting the spectrum to match the star lines. This is similar to what is done with the LHIRES where telluric lines at H alpha are used to correct for any offset. You would have to consider the RV of the star though and for highest accuracy perhaps the Heliocentric correction.
Cheers
Robin
Robin LeadbeaterParticipantYes I only use the lamp lines. The fit does deteriorate below 3900A though. (The lowest line ISIS uses) which is why Buil added the mixed star and lamp option
http://www.astrosurf.com/buil/isis/guide_alpy/resume_calibration.htm
see comparison of methods 2 and 3
Cheers
Robin
Robin LeadbeaterParticipantHi John,
I wouldn’t hold back from submitting spectra. (You could have a look in the databases for other ALPY spectra to see how their calibration looks.) I think a wavelength calibration accuracy of ~1/4 the resolution is still good (At the end of the day my ALPY spectra using just the lamp lines are no more accurate. The errors are just at the other end of the wavelength range). There is still something niggling to do with the difference in how the ALPY sees the lamp compared with the star to nail down here but I suspect it will turn out to be something common to ALPYs in general.
Dont refocus to sharpen up the lines in the far red to the detriment of the blue end. The ALPY performance is biased towards the blue end where it actually outperforms the LISA
I think ISIS is finding the lines OK so exposing more probably will not make much difference but exposing for the brightest line that ISIS uses is a good idea and if you want to try going further you can sum several exposures to increase the signal/noise in the faint lines in the same way as summing flats works (I used to do this but the results using just one well exposed lamp exposure seemed to work just as well.)
Cheers
Robin
Robin LeadbeaterParticipantHi John
“Last night’s specrum of Pi Andromeda (HD 00369) was still about 3 A out at H alpha but very accurate from H beta to epsilon. “
I presume this was using the mix of lamp lines and Balmer lines for calibration?. If so, the Balmer lines from H Beta down will always be in exactly right the right place because ISIS used them for calibration.
Similarly if you just used the lamp lines for calibration and produce a spectrum of the lamp, I suspect you will find that the lamp lines are in exactly the right place (within the accuracy of the fit ~+-0.5A)
The problem arises when we use lamp lines to calibrate star spectra. There is a shift somewhere between the star spectrum and lamp spectrum. Based on the latest result this does not seem to be a stability problem.
There are differences between the optical paths for lamp and star which could produce small systematic shifts. We may have found the limit of absolute accuracy of using the internal lamp for calibration. (note this is a systematic error, not a lack of precision/repeatability so not a problem when studying changes in wavelength eg in radial velocity measurements of binary stars.)
To take this further I would say we would first need to compare results from other ALPYs to determine if it is a limitation of the instrument or if this particular example is worse for some reason. Since I am seeing signs of similar size errors in star lines with my ALPY when using just the internal lamp, I suspect it could be a limit in absolute accuracy. In which case there is no need to be overly concerned but longer term there may be some modifications that could be made to the ALPY or the calibration technique to improve the calibration accuracy further.
Using a mix of lamp and star for calibration confuses the issue. I would say The definitive test would be for ALPY owners to take a spectrum of a star with known reliable RV, Calibrate just using the internal lamp and look for errors in the star lines.
This could be a good project for the workshop
Cheers
Robin
Robin LeadbeaterParticipantHi John,
“I’ve processed the calibration image as is if were a star, of course I had to use the same image to calibrate it. The result was odd, but the neon 6965 line was incorrectly calibrated.”
The spectrum plot looks odd. Did you tick “sky not removed” If you don’t do this it subtracts the lines from them selves, leaving almost nothing behind)
Robin
Robin LeadbeaterParticipantHi David,
Ah sorry, I see the wavelengths I posted (and listed by ISIS in the reports) are the values calculated from the fit, not the true values.
There does not seem to be a problem with the quality of the fit to the lines, at least within the range of lines used. (RMS ~0.2-0.3A seems typical for the ALPY.) The issue is apparent systematic differences in wavelength up to 3A between the lamp and the star)
Cheers
Robin
Robin LeadbeaterParticipantHi Andrew,
The extrapolation is into the red not the blue ?
Do you have the residuals for the blue points for the different fits? Particularly how much improvement in the fit is there going from 3 to 4 ?
Robin
Robin LeadbeaterParticipantOk the reflector position looks ok. ( I was concerned that the reflector might not be rotating to the correct position. It can be adjusted by operating the switches in a particular sequence) Not sure what any offset in the lamp might do (The asymmetry in the lamp internally is normal) and I cant see mine at the moment as it is mounted on the scope but is probably best not to change anything until you have checked the calibration with lamp spectra taken at the same time as the star spectrum.
I have been having a look at some of my past calibrations and I am also seeing wavelength errors between lamp and star (I use just the lamp without the star Balmer lines) In my case H alpha is spot on but there is an increasing error towards the blue to around 2-3A by 3900A where the lamp lines end, so errors of this order might be typical. What are other other ALPY users seeing?
We might be seeing a fundamental limitation in the calibration accuracy using the internal lamp. At this level (~1/4 the slit width) effects such as the position of the star on the slit and subtle differences in line shape due to optical aberrations come into play.
Cheers
Robin
-
AuthorPosts