Forum Replies Created
-
AuthorPosts
-
 Robin LeadbeaterParticipant
The sun is not automatically included in the list of targets for safety reasons. You need to set it up first. Here are some instructions, yours may be similar
“Note that to include the Sun in the list, you must first access the Menu button (UNDO back to the “Press ENTER to begin alignment” prompt), select Utilities and then Sun Menu. This is a one-time setting and will be stored for future use. ”
from
http://www.nexstarsite.com/Book/Updates/SolarSystemAlign.htm
Dont forget to keep the main scope and finderscope covers on of course !
Cheers
Robin
Robin LeadbeaterParticipantStability can be designed in though. Looking at the ALPY for example, the design cleverly transfers the load of the camera round the key (very light weight) optical components, leaving them carrying no load which means no measurable flexure.
Robin
Robin LeadbeaterParticipantDon’t forget thermal stability either. The coefficient of expansion of ABS is about 4x that of aluminium.
I think 3D printing is a great prototyping tool but after using spectrographs with rather poor and excellent stability (LHIRES and ALPY respectively) I look for the highest stability possible in the design and construction of a spectrograph.
Cheers
Robin
Robin LeadbeaterParticipantNo. Whichever direction you look in, you are seeing the universe as it was at an earlier time. This is true for all observers regardless of their location. (ie the aliens are seeing us as we were, not as we will be.) There is also no evidence that the universe has an edge or a directionality such that we could be “looking out or in”.
31 January 2018 at 2:11 pm in reply to: Why are PST and other solar scopes still so expensive. #579028Robin LeadbeaterParticipantMost of the component cost will be in the etalon but of course the cost of components is only a small part of the cost of running a sustainable business. The PST does seem to have gone up disproportionately though (I think they used to be around half that price new when I bought one second hand for £250 a good few years ago. The pound was much stronger against the dollar back then mind you) Imagine how much the warranty claims to fix all those PST with deteriorating coatings must have cost them though!
Robin
Robin LeadbeaterParticipantThanks Bill,
The reason I asked was that I was surprised to see that for the Geminid for example, the continuum has the same value across the wavelength range, given that it would be expected to be the product of the typical instrument response and the presumably black body curve of the thermal contribution to the spectrum. This continuum would also be expected to vary in shape for the different speed meteors depending on the temperature.
An alternative approach would be to plot the flux calibrated spectra with the continuum component subtracted which should show the relative intensity of the emission lines directly
Cheers
Robin
Robin
Robin LeadbeaterParticipantHi Bill,
These appear to be relative to a “continuum” equal to 1 are they normalised relative to some measured continuum or has the continuum just been applied to the uncorrected emission spectra as an offset ?
Robin
Robin LeadbeaterParticipantI have just got round to watching David’s Sky Notes which I missed as I had to catch my last train north.
SN2018gj imaged there by David Swan and Peter Carson is interestingly another supernova discovered and confirmed spectroscopically by amateurs. (Patrick Wiggins and Etienne Bertrand respectively)
Patrick Wiggins first put the news of his possible discovery out on the supernova discussion forum where he was advised to upload it onto the Transient Name Server post haste !
https://groups.yahoo.com/neo/groups/isn_chat/conversations/messages/1047
I was clouded out but realised it was potentially bright enough to be recorded spectroscopically using a standard ALPY 600 so I put an alert out on the ARAS forum which Etienne picked up.
http://spectro-aras.com/forum/viewtopic.php?f=5&t=1938
The confirming spectrum was taken just 9 hours after the discovery
Robin
Robin LeadbeaterParticipantHi David,
I’ve just spotted your latest results on your personal page. These are really nice, The H alpha emission line in Gamma Cas shows up very well
Cheers
Robin
Robin LeadbeaterParticipantYes that was a good result on SN2018gj at mag 14.5 by Etienne Bertrand using a standard ALPY. I see there is now a professional confirmation of type II too
http://www.astronomerstelegram.org/?read=11172
Looking at the weather forecast my next clear spell is likely be Saturday evening when I am down at Burlington House talking about…. supernova spectroscopy ! If it had been a type Ia it would probably have got pretty bright, perhaps mag 12 but as a type II, maximum will be less certain and probably lower.
Cheers
Robin
Robin LeadbeaterParticipantHi David
There’s no substitute for good seeing to get decent resolution with the Star Analyser but with bright targets you can try using short exposures and select, align (on the zero order or sometimes better on a prominent line if the stacking program will lock onto it) and stack as the planetary imagers do. This helps with dynamic range when using video type cameras as well as generally improving sharpness of the spectrum but the problem is that that the variations are wavelength dependent. (hence the twinking colours seen with bright stars in bad seeing) so the spectrum can still end up blurred.
Cheers
Robin
Robin LeadbeaterParticipantHi Hugh,
The SA 100 should be more linear than the SA200 because of the lower dispersion angle but I think the wavelength errors you are seeing may be more to do with the zero order not quite being in the expected place (ie at 0 Angstroms) ie it is more of an offset error than a non linearity. I have seen this to a greater or lesser extent from time to time and never really managed to nail down the cause. (Something to do with atmospheric dispersion perhaps ? What does a linear fit between the shortest and longest wavelength Balmer lines look like for example ? At the end of the day though wavelength calibration of a slitless system and the transfer of that calibration to other targets is always going to be somewhat approximate.
Cheers
Robin
Robin LeadbeaterParticipantJim Ferreira’s website also has some nice examples of Star Analyser targets to whet your appetite while we wait for the skies to clear
http://www.lafterhall.com/spectroscopy.html
Cheers
Robin
Robin LeadbeaterParticipantSome additional words from the master. No not me! but Christian Buil who’s work with a simple school lab diffraction grating got me into this game.
The theory and early experiments.
http://www.astrosurf.com/buil/us/spe1/spectro1.htm
Star Analyser review and tips
http://www.astrosurf.com/buil/staranalyser2/evaluation_en.htm
http://www.astrosurf.com/buil/staranalyser/obs.htm
http://www.astrosurf.com/aras/staranalyser/userguide.htm
(Dont worry at this stage about the wedge prism he uses, it is available as an accessory but only improves the resolution of the SA100 slightly and makes life more complicated for the beginner.)
Robin
Robin LeadbeaterParticipantHi Kate,
Large variations between sub exposures can be a result of a seeing/scintillation affecting the guiding. (The star is jumping in and out of the slit). Guiding on very bright stars can be problematic. You need a well exposed (ie not saturated) star image to guide on but to avoid saturation the exposures end up being very short. The guider then makes too frequent adjustments on seeing variations. PHD is also prone to hunting about the slit position when guiding using the overspill from the slit. (PHD tends to lock onto the brightest half of the split star image rather than the centre of the star) Using one of the alternative algorithms in PHD eg hysteresis or slow pass filter can sometimes help in these cases.
Cheers
Robin
Robin LeadbeaterParticipantHi Kate,
How do the pixel ADU counts in the raw spectrum images compare ? ie are the counts in the spectrum image much lower in the noisy spectra? If so we can discount some sort of problem with data reduction.
If the counts in the noisy spectrum images are lower, are they lower in all the sub images or is there a lot of variation between images?
Cheers
Robin
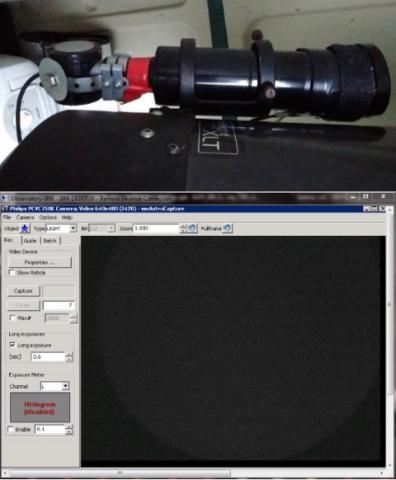
Robin LeadbeaterParticipantMy “cheap and cheerful” electronic finder. A Philips webcam mounted afocally on the back of the C11 finderscope, displayed in WXastrocapture and viewed remotely via remote desktop
Cheers
Robin
 Robin LeadbeaterParticipant
I have a similar setup though the guide camera sensor is a bit bigger (ICX 415AL) I have the C11 on an EQ6 mount on a tripod running EQMod and CdC and the alignment/pointing is pretty poor to be honest. However I use a webcam clamped on the back of the standard guidescope which allows me to see stars to ~mag5. (Ihave a little red LED hanging in front of the finder to illuminate the cross hairs). If I centre the finderscope on one of these near to the target, it easily places them in the guider field where I recentre and sync. I then slew to the target which should be visible (for faint targets or crowded fields I use a DSS image for reference) If not, I sync more nearby bright stars so EQmod can triangulate or occasionally have to star hop in from the bright stars using CdC and the guider image. I also use the same system successfully at f10 with the LHIRES where the guider field is even smaller.
Cheers
Robin
Robin LeadbeaterParticipantHi Kate,
I have one but have not used it “in anger”. To produce a spectrum calibrated in absolute flux, two sets of spectra are taken, one as normal in the narrow slit, and one effectively “slitless” using the wider part.
The narrow slit spectrum has the fine detail and accurate wavelength calibration but only includes the fraction of flux which happens to pass through the slit so cannot be used to measure the absolute flux. The wide slit spectrum has lower resolution and poorer wavelength calibration but includes the total flux from the target. By combining the two a fully flux calibrated spectrum can be produced with accurate wavelength and good resolution. Christian Buil’s page here shows how to do this using ISIS.
http://www.astrosurf.com/buil/calibration2/absolute_calibration_en.htm
and an example of it in use (in French)
http://www.astrosurf.com/buil/alpy600/photometric_slit.htm
The conventional photometric brightnesses can then be calculated by integrating the spectrum over the wavelength range of the standard photometric filters.
More commonly in the amateur realm, the reverse is done ie a spectrum is produced as normal using a narrow slit and then calibrated in absolute flux using brightness measurements obtained using photometric filters.
EDIT added a link
Robin LeadbeaterParticipantHowever…. I have just discovered an apparently undocumented feature (ten years late!) that on the 350D if you select mirror lock up AND self timer mode, only one press is needed. (Mirror goes up, 3sec delay, exposure starts) so a standard intervalometer should do the trick even on the 350D (and perhaps other models too?)
-
AuthorPosts