Forum Replies Created
-
AuthorPosts
-
 Robin LeadbeaterParticipant
Hi John,
That’s interesting. On my 350D the mirror stays down after an exposure so always needs a double press of the shutter release at the start of each exposure. Perhaps it is connected with live view which the 350D doesn’t have. I rarely use my DSLR for astronomy but have just written a little program to do this for my BBC microbit, mainly for fun.
Cheers
Robin
Robin LeadbeaterParticipantI’ll see if I can dig out the program but it ran on XP via USB to the camera and ISTR there was no support for that when I moved to Win 7. Yep a couple of 555s would probably have been my choice back in the day. (a quick pulse to flip the mirror up then a couple of seconds delay to let things settle before starting the main exposure) but Arduino, Raspberry Pi, BBC microbit etc feeding a relay or optocoupler would do the job. I am surprised the cheap after market remote timers dont have a lock up facility but the ones I had a quick look at don’t seem to eg
https://www.amazon.co.uk/Neewer%C2%AE-Shutter-Release-Hasselblad-PowerShot/dp/B004FKYBJM/
Robin LeadbeaterParticipantI had a program on the laptop that operated the shutter automatically on a sequence including mirror lockup each time so did not need to manually operate it. It should not be too difficult to make up a little battery operated circuit to do the same thing though, closing the shutter remote contacts in a sequence
Robin LeadbeaterParticipantHi Bill,
My venerable 350D has mirror lock up so I suspect the 1000D will have. (buried in the setup menu,first press of the shutter moves the mirror,second press operates the shutter). It depends on focal length of course but the vibration was very obvious at 300mm fl when I forgot to enable it. Though so as you say unlikely to be the cause here unless the meteor was right at the beginning of the exposure.
Robin
12 December 2017 at 11:29 am in reply to: New generation cameras a game changer for meteor spectroscopy? #578847Robin LeadbeaterParticipantWow £11k is certainly a lot of money for something that does not exist. I wonder if they accept bitcoin 😉
Robin LeadbeaterParticipantHi Hugh,
(The same answer as Andrew but with a bit more detail,read and forget if you like!)
Your measurements are showing nice qualitative trends but you have to be a bit careful when interpreting the EW of emission lines.
EW works well as a measurement of absorption line strength because absorption is normally just a proportion of the continuum, so provided you can decide where the local continuum is, the EW gives you a good measurement of the line strength. (eg even if the star changes in brightness, if the absorption is constant, the EW stays the same.)
Emission lines are different as they normally come from a different source than the continuum so are independent of it. This means the EW value of an emission line makes less sense as we are measuring it relative to something not connected with the emission line. This is OK provided we know that the continuum flux is constant (or at least how it is changing, so we can correct the EW to give a true measurement of the line strength) Otherwise the EW results can be deceiving. Classical novae are a good example. If you plot the EW of H alpha as the nova evolves it looks like the line is continuously getting stronger. In fact though this is mainly due to the continuum falling away and for much of the time the actual line strength is constant and even decreasing at times.
If we look specifically at your VV Cep spectrum, the hot star is now fully eclipsed so the continuum is that of the cool star photosphere and the emission comes from somewhere else (possibly an extended region (disc?) associated with the hot star but there are many possible sources). The variations in the continuum around the emission line will be due to a blend of the many absorption lines in the cool star spectrum and we don’t see the true continuum at this resolution (It will likely be somewhere along the high points of the spectrum). The reference points you have chosen will be somewhere in the absorption lines so will only be fixed during totality, assuming no variations in the cool star spectrum. Outside totality, the reference points will rise closer to the continuum level as the hot star reappears and the cool star absorption lines lose their relative strength. The continuum flux will also increase to that of the two stars combined. Both these will affect the EW measurement even if the emission line strength actually remained constant.
All is not lost though if you want to make an absolute measurement of the way the emission line flux is varying, as all the necessary information is available.
What we would first need to do is to convert the spectrum to absolute flux. This could be done using the available measurements of photometric brightness around the time of the spectrum. Once that has been done, we can work in absolute flux rather than relative to some poorly defined and varying continuum.
The next step would be to remove the cool star component. We could try this now by subtracting a reference spectrum of a star of the same type, adjusting it to match the intensity of the absorption lines, but probably the best way to do this would be to wait to around mid eclipse when the hot star and any circumstellar material should be hidden and use this as a template. Once this is subtracted, we should be left with the flux calibrated spectrum of the uneclipsed components, probably dominated by Balmer emission lines with their actual intensities measurable directly.
Cheers
Robin
Robin LeadbeaterParticipantI’ve only really measured EW manually but found it very sensitive, particularly in noisy spectra, to deciding exactly where the continuum goes (linear, spline fit, what order to use ? etc) and where the line meets the continuum for the integration limits. How does IRAF do this? In your screenshot it looks like it is fitting gaussians to separate merged line components. ( I remember something similar in SPLAT) Is this part of the EW measurement?
Robin
Robin LeadbeaterParticipantYes there are a few 3D printed spectrograph designs floating around, (though none for a high resolution Littrow that I can recall) The current one generating interest on the astronomical_spectroscopy yahoo group is Paul Gerlach’s LOWRES
https://groups.yahoo.com/neo/groups/astronomical_spectroscopy/conversations/messages/13914
https://www.thingiverse.com/thing:2455390
Christian Buil has also been dabbling with 3D printing for his experimental UVEX spectrograph
http://www.spectro-aras.com/forum/viewtopic.php?f=8&t=1773
Robin
Robin LeadbeaterParticipant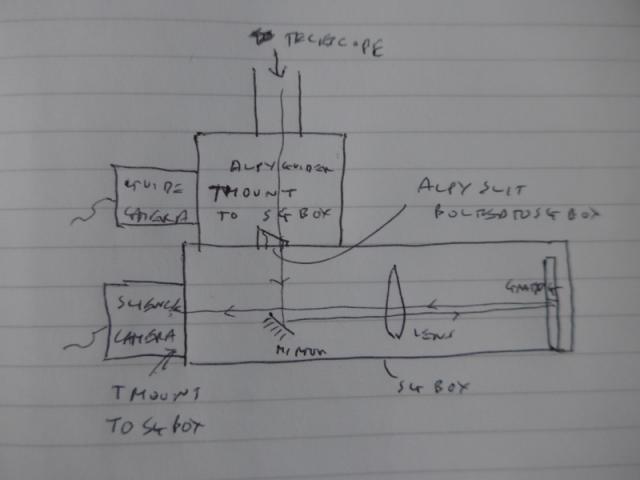
The spectrograph is just a rectangular box with grating, mirror and doublet lens mounted inside. The ALPY slit is bolted to the box and the ALPY guider and science camera are coupled to the box with T mounts. The slit should be positioned to correspond to the positon in the ALPY (The slit is in same plane as the front face of the guider I believe). The distance from slit to doublet via the mirror and doublet to camera = focal length of the doublet. make position of doublet and science camera adjustable. (Collimate by pointing a camera focused at infinity through the end of the box with the grating removed and adjusting the doublet to give a sharp slit image)
No guarantees, I will leave the detail to you 😉
Robin
EDIT corrected distances (to doublet, not grating) – suggest using LHIRES III dimensions and position of elements
Robin LeadbeaterParticipantIf you are building a high resolution Littrow specifically for monitoring H alpha for Be stars, as the LHIRES was originally designed for, then even the grating holder can be simplified as once set up on H alpha, it can be fixed in position. (I believe Ernst Pollmann originally had a similar setup)
Robin
Robin LeadbeaterParticipantHi Tony,
As Bill says (and of course you already know from your ALPY experience), the guider is important. With a bit of ingenuity and machining skills though it should be possible to incorporate the guider and mirror slit from the ALPY into your Littrow design making the grating holder and rotating mechanism the only difficult part. (This is a critical part and has to be designed and manufactured well if unwanted movement is to be a voided)
(I do rather enjoy modifying existing equipment where most of the hard work has already been done and I have vague plans to take the components of an ALPY and turn them into a universal setup with a range of grisms/filters mounted in a filter wheel between the collimator and camera lens, similar to that often seen on professional telescopes.)
Alternatively the mirror slit used in the L200 is still available from the manufacturer Ovio and is significantly cheaper than the Shelyak ones. I will see if I can find the reference.
Robin
Robin LeadbeaterParticipantHi Tony
I remember a few early design L200s coming as people upgraded to the LHIRES (The early L200s had some issues, eg no guider, crude adjustable slit). The commercially manufactured version appeared to address those issues and was priced way below the LHIRES but probably too low as the company involved soon pulled out of this area so I am not sure if many were ever delivered. Also the L200 could not reach the higher resolution of the LHIRES using a 2400l/mm grating due to the mechanical design.
If I remember correctly the original LHIRES kit of parts cost around 1500 Euro with two gratings in 2006. The cost of a LHIRES today is much higher and I expect without factoring in your time you could make one cheaper as the commercial price includes the assembly costs and there have been various improvements made over the original design and of course it has to carry its share of the costs of running a sustainable business and future developments. (AFAIK Francois and Olivier are not sailing big yachts and driving around in Ferrari’s!)
Cheers
Robin
Robin LeadbeaterParticipantHi Tony,
I dont know anyone who has built a replica LHIRES III from scratch but Ken Harrison’s L200 which was also available as a kit initially and then was briefly offered commercially has a lot in common with the LHIRES design.
The history of the LHIRES is an interesting one and explains why the full details are available.
It came out of a pro-am conference in France where the usefulness of amateur measurements of Be stars was discussed. A spectrograph with higher resolution than was currently available to amateurs would be needed though. An amateur team (Including Christian Buil, Francois Cochard, Olivier Thizy and many others) got together to design one and in 2006 arranged for the manufacture of a kit of parts on a not for profit basis though the Aude amateur astronomy group. They expected to make perhaps a dozen but got orders for over 70 ! (I have kit #29). Requests for the kit kept coming in after the first batch so Francois Cochard and Olivier Thizy formed Shelyak Instruments to make it commercially and the rest as they say is history.
Robin
Robin LeadbeaterParticipantHi Tony,
The LHIRES III is fully documented if you fancy machining the parts
http://www.astrosurf.com/thizy/lhires3/index-en.html
Robin
Robin LeadbeaterParticipantNice image David. (I had to put the waterproof on to put the bins out tonight over on this side of the country !) Definitely much brighter than on Saturday. If it is a normal Ia and ignoring any extinction in the host galaxy it could theoretically top out around mag 12.8 at this distance.
Robin
Robin LeadbeaterParticipantThanks Andrew,
I have got a bit of a routine going now. There are plenty of potential targets at the moment but with no prospect of any clear skies. I just tend to go after them every now and then but I reckon a dedicated setup from a decent site could perhaps bag a hundred or more a year and the ALPY would be a nice instrument to automate.
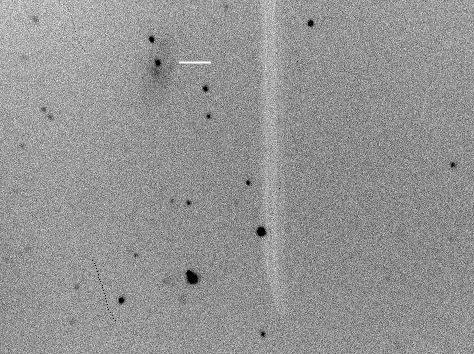
Robin LeadbeaterParticipantHere is how it looked in the guide camera (19x20s.South is up)
 Robin LeadbeaterParticipant
Hi Peter,
I agree with Andy. The multiple images of the zero order means there is movement between the individual images. This is normal in unguided images. When stacking unguided images you need to align them to remove blurring due to drift. ISIS has a tool for doing the alignment (“Tools”, “Image Processing 3”, “Register”) But with the Star Analyser, the various programs that are typically used by the planetary imagers are more commonly used to produce an aligned and stacked image before extracting the spectrum. (You can use the zero order for the program to lock onto)
These programs also allow you to select the sharpest images and just align stack these which is another trick we can borrow from the planetary imagers to get a sharp noise free image when using the Star Analyser.
How much improvement stacking gives depends on the noise in a single exposure. In this case the features are already clear in a single exposure so stacking may not make that much difference.
Cheers
Robin
EDIT:- just seen John’s post which came in while I was typing. Two techniques to try in ISIS 🙂
Robin LeadbeaterParticipantEach part of this project is a signficant accomplishment. The whole must be unparalleled in spectroscopy at an amateur level.
I take my hat off to you sir!
8 November 2017 at 1:43 pm in reply to: UK Location of best number of clear nights and seeing #578734Robin LeadbeaterParticipantWhat a great film. It is a long walk to the beach from the pub though.
-
AuthorPosts