Forum Replies Created
-
AuthorPosts
-
 Robin LeadbeaterParticipant
North West Cumbria. Clear skies are like hen’s teeth around here and once again have coincided with near full moon 🙁
I did not notice any aurora visually, though there was a photo on the local weather showing it low in the north. The spectrograph is very sensitive to this line though which is always present at a background level even when there is no aurora.
Robin
Robin LeadbeaterParticipantHi Nick,
It is not something I follow but I think bright ones away from the galactic centre are very rare. (I remember the 2006 event in Cassiopeia was a big surprise to everyone).
There are surveys looking for them in the galactic bulge which are followed up by amateurs through the MicroFun project
http://www.astronomy.ohio-state.edu/~microfun/
Cheers
Robin
Robin LeadbeaterParticipantIt looks like it has hit peak brightness and (barring any kicks from exoplanets) is now on its way back down
http://www.astronomy.ohio-state.edu/~assassin/followup/TCPJ05074264_2447555.pdf
My estimated F5v spectral classification is confirmed by a high resolution spectrumCheersRobinRobin LeadbeaterParticipant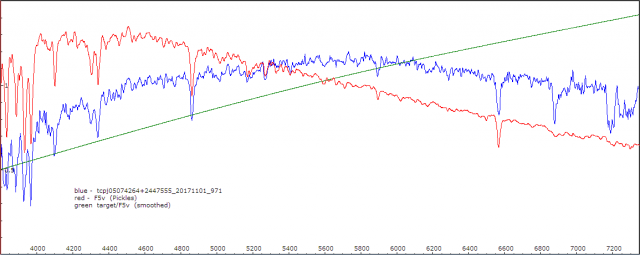 Here is the spectrum (ALPY 600 at R~500) measured last night, shown in blue. The features match those of an F star (F5v shown in red) but the continuum is significantly redder (smoothed ratio of measured/ Pickles f5v in green)
The full size version is in the attachment
Cheers
Robin
Robin LeadbeaterParticipantHi Nick, (and Nick)
Indeed. I took a spectrum last night and thought similar eyeballing the guider image. Not the anticipated steepening climb. David Boyd reported it steady at Vmag 11.50 last night so only slightly brighter than the last point on the ASAS-SN light curve.
Robin
Robin LeadbeaterParticipantHi John,
If specifically for an ALPY then as Paul says, the 414 is a good choice. Be aware though that the 414 is best avoided if you think you might want to use it at high resolution with a LHIRES for example where severe (cover glass originating) fringes can be produced with cameras using this CCD. (Strangely the earlier generation 314 did not have this problem) The 460 (and its smaller brother the 428) is free of fringes at high resolution but does show some waves in the spectral response at low resolution (due to the CCD internal layers) with the ALPY, though these are not severe (still better than the Kodak KAF CCD for example in this respect) and are effectively dealt with by the flat correction.
Cheers
Robin
Robin LeadbeaterParticipantHi Hugh,
I typically use 30 pixels either side which is one of the ISIS defaults. I believe ISIS then uses the median value (to remove the potential effect of outliers). It is an interesting question as to what the optimal value is.
Very wide zones would minimise the additional noise from the subtraction but the background regions chosen potentially become less representative of the background where the spectrum is. (IIRIS, the forerunner of ISIS had various interpolation techniques to better predict the background where the spectrum is but these seem to have been dropped in ISIS). The effective removal of narrow lines (eg NaD, auroral lines etc) also becomes more difficult as the geometric correction (the correction of the slant and curve of the lines) has to be more accurate. (In any case narrow sky lines often tend to leave some artifacts after background subtraction).
What we should be aiming for it is the additional noise from the background subtraction operation to be small compared with the actual noise generated by the background present in the spectrum. I will have to go away and think about that calculation !
At the end of the day I suspect the main influence on background noise in the spectrum is the width of the spectrum binning zone. By making that as narrow as possible (while still including all the signal) we can keep as much background out as possible. (There are various clever optimal binning algorithms used by the professionaIs and ISIS has an option though I have not personally seen any significant improvement over choosing the zone manually)
Cheers
Robin
Robin LeadbeaterParticipantI live in a reasonably dark rural village but have half a dozen street lamps (a mix of LP sodium, metal halide and now LED), none of them are well designed, with very poor cutoff, even the LED (I suspect they went with the cheapest. The LED lamps probably do not even cut off the blue/UV spike that I believe decent models have these days. ) The pollution is significantly worse than when they were all LP sodium but sky background subtraction still deals with this very well, removing man made pollution and natural airglow/moonlight even when the sky is many times brighter than the spectrum eg
http://www.threehillsobservatory.co.uk/astro/spectra_46.htm
Robin
Robin LeadbeaterParticipantAh, I see what the problem probably was. The original link is to the attachment in the stargazerslounge forum. You have to be a member and logged in to view it there. (I happened to be still logged in there so it worked for me)
Robin LeadbeaterParticipantIt works for me (attached)
Robin LeadbeaterParticipantHi Hugh,
Strictly speaking resampling and filtering are different operations, though the end result is similar.
With resampling you are combining adjacent sample bins (eg pixel columns) to produce a spectrum with a different bin size. Unless resampling using a whole number of bins, this involves some degree of interpolation eg in ISIS, bilinear or spline. This happens to some extent in the background in any case to match the bins when overlaying the differently sampled measured and reference spectra)
With filtering you preserve the original sample bin size but smooth the differences between adjacent bins using some algorithm (eg boxcar, low pass, spline, gaussian etc)
In general it is better to filter rather than resample as resampling can produce artifacts compared with filtering. (Interestingly ISIS actually up samples spectra (ie interpolates to a smaller bin size) before wavelength calibration to minimise these effects )
Cheers
Robin
Robin LeadbeaterParticipantHi Hugh,
If there is a big disparity between the resolution of the measured and ref spectra I find it is useful to apply a (typically spline) filter one of them to match the resolution before doing the division as that (along with slightly wavelength shifting them as necessary) makes editing any remaining artifacts out of raw instrument response easier. It did not work perfectly in Peter’s case as typically the Star Analyser resolution varies along the spectrum but attached is an example of the division with and without filtering with my very low resolution ALPY 200 and the MILES reference spectrum. It is also useful in high resolution spectra using the LHIRES where the line profile of a ref star like Vega for example can take up most of the width of the spectrum. Here I did the smoothing manually in VSpec but the response function in ISIS has both filtering and offset adjustment capability built in to the response function calculator.
Cheers
Robin
Robin LeadbeaterParticipantHi Peter,
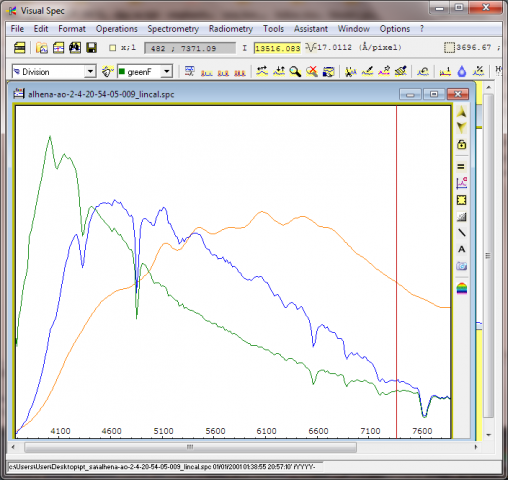
The spectrum profiles you attached have a problem with the wavelength calibration which the graphs you posted do not so I went back to your spectrum image and recalibrated that in wavelength first. I then calculated the instrument response and applied it to the raw spectrum to produce a final instrument response corrected spectrum. You can see below the raw spectrum (blue), the instrument response (orange) and the final result (green).
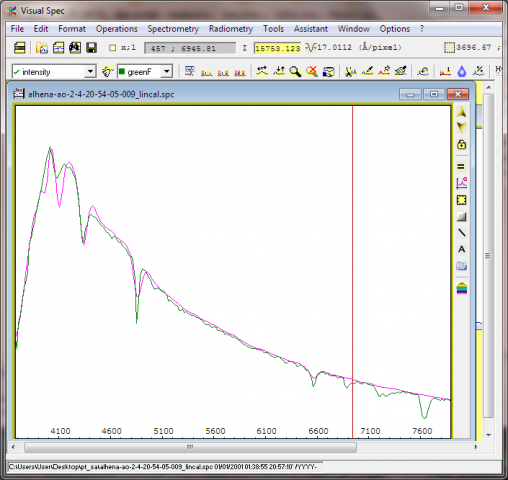
As a check I also compared the final result (green) with the reference spectrum (pink) which I filtered to match the resolution of the measured spectrum. You can see the good agreement in the shape of the continuum which confirms the instrument response is working correctly.
I have attached the steps I took to produce the final spectrum in the attached pdf. I used Vspec as it is easier to see the individual steps but you can use any software package to produce the same result.
I hope you can follow this ok
Robin
 Robin LeadbeaterParticipant
Hi Peter,
You are definitely making progress and are almost there with this result. The wavelength calibration is good and the instrument response is approximately right but there are a couple of improvements you can still make.
If you compare your final response corrected spectrum (blue in the last graph) with the library spectrum (purple),there are some humps in your spectrum between 500-5400A which do not appear in the library spectrum. The continuum at the short wavelength end agrees well but at the long wavelength end, your spectrum drops below the library spectrum.
Can you post your uncorrected and corrected spectra fits files (blue in the top and bottom graph) as attachments (change the extension from .fit to .fits so the forum accepts them). and I will have a closer look at where the problem might be.
Cheers
Robin
Robin LeadbeaterParticipantHi Nick,
Yes the Fermi coordinate uncertainty left a lot of sky to search but one of the papers in Gary’s reference describes how this was managed by one of the teams.
http://iopscience.iop.org/article/10.3847/2041-8213/aa8edf/meta
Remarkably the combined data from the three operational GW detectors constrained the location considerably (and more accurately) compared with just the Fermi data. (fig 1 in the above paper). The DLT40 supernova survey team then prioritised imaging their 20 target galaxies which fell in that region.
Robin
Robin LeadbeaterParticipantAbout 10 years ago I was interested in trying to image a Gamma Ray Burst optical counterpart and subscribed to alerts from the Gamma-ray Coordinates Network (GCN) Circulars. Having caught one I then lost interest. http://www.threehillsobservatory.co.uk/astro/astro_image_81.htm
I’ve just had a look in the GCN circular archives around the time of this GW event and there was a lot of chatter there about it eg https://gcn.gsfc.nasa.gov/gcn3/21505.gcn3 so that could be a good place to monitor for future events.
Robin
Robin LeadbeaterParticipantInterestingly the detection by several pro supernova survey teams of the optical transient was submitted to the Transient Name Server, (which generates alerts for possible supernovae and which I monitor it for potential candidates for spectroscopic classification.)
https://wis-tns.weizmann.ac.il/object/2017gfo
It was mag 17.3 at discovery which would have been just bright enough for a spectrum with my setup. The TNS submissions and subsequent spectrum which showed it to be something unusual, was embargoed for 2 months though so it only appeared on TNS today giving no chance to observe it. Had an amateur picked it up in the meantime though (eg as part of a supernova patrol) and posted it on TNS, they would have been credited with the discovery as IAU recognise the first to publish as the discoverer.
Robin
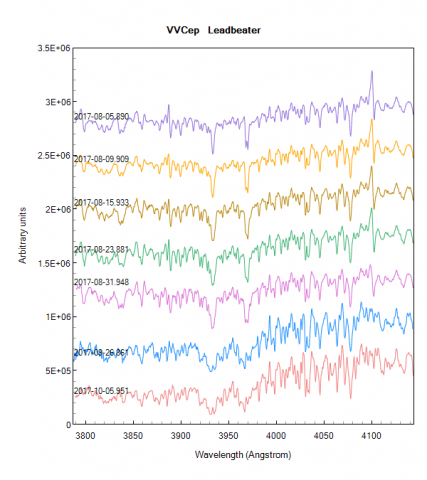
Robin LeadbeaterParticipantHere is an updated plot including the latest spectrum from last night. There has been no further change in the past 9 days so it seems likely that the ingress phase is now complete at this wavelength.
Robin
 Robin LeadbeaterParticipant
Hi Kevin,
For supernovae I use a specially modified ALPY with a lower dispersion GRISM which allows me to get down to ~mag 17.5 compared with ~mag 15.5 with the standard ALPY with my C11
http://www.threehillsobservatory.co.uk/astro/spectroscopy_20.htm
Cheers
Robin
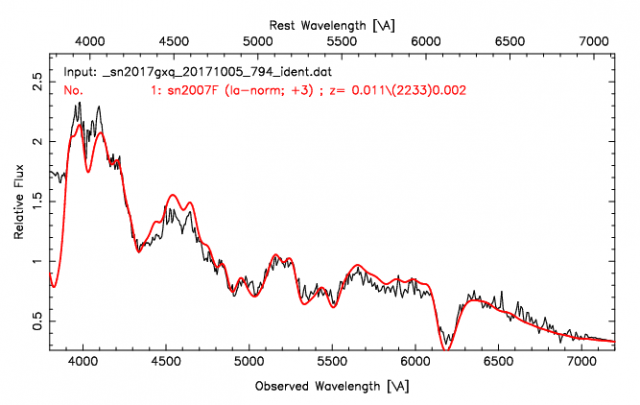
Robin LeadbeaterParticipantsn2017gxq was bright enough for the ALPY 600 last night despite the full moon. Here is the spectrum (black) overlaid on the best fit according to SNID
https://people.lam.fr/blondin.stephane/software/snid/
which predicts it is now just past maximum.
Robin
-
AuthorPosts