Forum Replies Created
-
AuthorPosts
-
 Robin LeadbeaterParticipant
Thanks Paul,
Cold wet winters I am familiar with but long hot summers are just nostalgic childhood memories for me 😉
Robin
Robin LeadbeaterParticipantHi Paul,
That’s interesting. I have never changed the desiccant in my cameras and I am not sure how to, though I notice that my latest camera ATIK 428 does have an externally removable plug. My ATIK 314 is 6 years old and the ATIK 16IC-S is about 10 years old now. Perhaps it is a climate thing ?
Robin
Robin LeadbeaterParticipantHi Jack,
There are various manufacturing techniques, either mechanically ruling the lines to produce a master. (The gratings you can buy are then cast replicas reproduced from the master) or generating them photographically using holography. The free Richardson “diffraction grating handbook” is a good reference
http://www.gratinglab.com/Information/Handbook/Handbook.aspx
(they will send you a hardback copy or a google search thows up an (unofficial) on line pdf version for edition 6)
though it does not cover volume phase gratings for example where the “grooves” are actually variations in refractive index in the material, again produced using photography and holography
https://www.noao.edu/noao/noaonews/jun98/node4.html
Robin
Robin LeadbeaterParticipantYes the Sony ICX825 in the ATIK 414 etc shows severe ripples in high resolution spectra but perversely is the best CCD for low resolution work in this respect, even better than the CCDs used in the ATIK 460/428
Robin
Robin LeadbeaterParticipantNote also that that the ALPY optics are specially optimised for the violet end and the sharpness deteriorates noticeably in the red/IR in any case due to chromatic aberrations. (The early ALPY’s had an IR blocking filter to stop people operating in this region until it was removed after I pointed out the effect the terrible ripples in the passband of the filter had on the instrument response)
Robin LeadbeaterParticipantHi Paul,
I’ve not seen this problem with any of the atik cameras I have used but I think rotating the camera 180 deg should quickly show if that is the problem. A similar effect can produced if the CCD is not mounted precisely square (ISTR some cameras having an adjustment) or the camera adapter out of square, though that would not normally be a progressive deterioration and if this is the case it would still be possible to focus well at any particular wavelength, just not everywhere at the same time.
Cheers
Robin
Robin LeadbeaterParticipantThat’s great David, topping the brightness charts currently. It is easily bright enough for the standard ALPY 600 now. Let’s hope the promised clear skies turn up on Thursday.
Robin
Robin LeadbeaterParticipantHi Kevin,
I have just seen that the iPTF team have now classified it (type 1a) so no need to go for it, unless you want to of course.
https://wis-tns.weizmann.ac.il/object/2017haf
Interestingly the “SED machine” spectrograph they use is even lower resolution than mine. They are definitely a rival 😉
The location looks spot on to me in CdC if I overlay the DSS image so probably an epoch issue. (The TNS coordinates are J2000). It is quite close to the galaxy core though so separating it from the galaxy could be a problem.
Cheers
Robin
Robin LeadbeaterParticipantI think VSnet takes the photometry data but you can submit an image with or without a magnitude directly to David Bishop,(at least that what I used to do !)
dbishopx at gmail.com
Robin
Robin LeadbeaterParticipantNice image David. Photometry could be useful. Do you plan to submit it to David Bishop’s website? there are no measurements or images for this SNe there yet.
http://www.rochesterastronomy.org/snimages/
Only clouds and bands of rain on this side of the country tonight unfortunately.
I suspect it is close to maximum now and since it is a type 1a I had a go at estimating how bright it should get to at maximum.
According to NED http://ned.ipac.caltech.edu there are no redshift independent distance measurements for ngc4964 but based on the redshift the distance would be ~36Mpc. (Though for a relatively nearby target like this the errors could be high)
Using 36Mpc and an absolute V mag of -19.3 at maximum for type 1a SNe gives an apparent V mag at maximum of ~13.5 (not taking into account any extinction) so your mag 14 guestimate seems reasonable.
Robin
Robin LeadbeaterParticipantThanks !
I have got quite adept at swapping between the LHIRES and ALPY now. They have separate cameras (Currently the ATK 314 and a stellacam on the LHIRES and ATK428 and ATK16ic-s on the ALPY) and are all wired up so I just have to physically swap them over. The one not in use sits in a box next to the scope. I have even got duplicate 200/600 modules for the ALPY now as well which can be changed over without needing readjustment other than aligning the camera angle. I tend to stick with one setup on any particular night though.
@ Paul,
Sure, no problem. Let me know if you need any specific graphics, images etc
Cheers
Robin
Robin LeadbeaterParticipanthttps://wis-tns.weizmann.ac.il/object/2017gxq
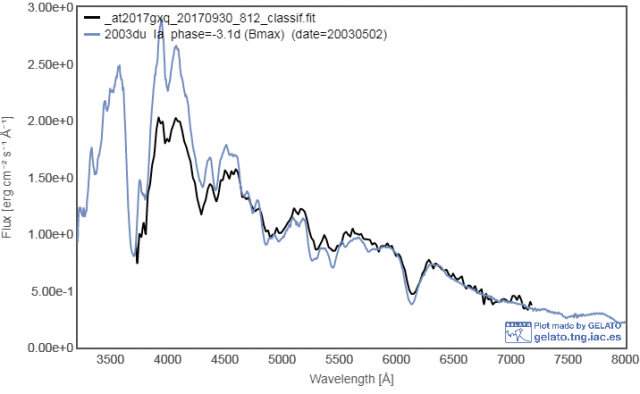
This was discovered by Gaia on 17th at mag 17 and announced on 28th Sept but was much brighter last night (~mag 15 or perhaps brighter) last night when I took the spectrum and is still likely to be a few days from max so would be a good early evening standard ALPY candidate.
Robin
Robin LeadbeaterParticipantJust heard that a follow up by Swift was scheduled based on my classification 🙂
Robin
Robin LeadbeaterParticipantHi Jack
Chromatic Aberration. The inability of a lens to bring all wavelengths to focus in the same plane. The LHIRES uses an achromatic doublet which shows the usual pronounced chromatism in the Violet/UV so the focus varies across the spectrum.
Cheers
Robin
Robin LeadbeaterParticipantI saw the same changes in the similar system AZ Cas in 2012 as it entered eclipse and we lost the spectrum of the hot B star (Though there is no H Balmer emission in AZ Cas)
http://www.threehillsobservatory.co.uk/astro/spectra_43.htm
Cheers
Robin
Robin LeadbeaterParticipantI know the feeling. I’ve been doing astronomical spectroscopy for over 10 years now and the curve has still not tailed off yet !
Note, I suspect the spectrum will not have been corrected for instrument response/extinction so the shape of the spectrum will not represent the actual spectral energy distribution. There may be some spectra of standards around taken on the same night though which could be used to produce a (relative) flux calibrated spectrum to give us an idea of temperature.
Cheers
Robin
Robin LeadbeaterParticipantHi George,
It might yet develop features in the spectrum so it will be worth keeping an eye on over the next couple of weeks. In classical novae the H alpha emission lines are relatively strongest after maximum. For example this animation of Nova Del 2013 by amateur Paolo Berardi covering the first week
http://quasar.teoth.it/html/spectra/novadel_15_21.gif
Cheers
Robin
Robin LeadbeaterParticipantHere are the target binning (blue) and sky subtraction (green) zones I used in ISIS to extract the spectrum of the PNV (The asymmetric sky background zones were deliberately chosen to avoid the cosmic ray hits)
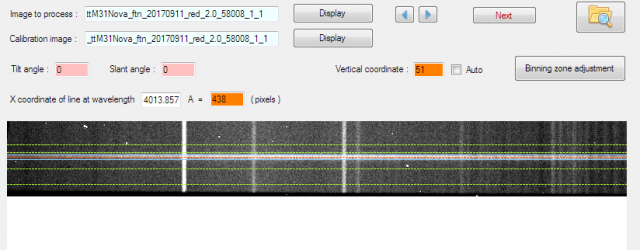
Robin
Robin LeadbeaterParticipantThe spectrum beyond ~7700A (~pixel 500) is unusable in its current state because of the severe optical etalon type interference fringes, common in IR spectrographs. A careful flat correction would be needed to remove them.
Robin
Robin LeadbeaterParticipantAttached are the spectra with and without sky background subtraction, (pink and blue respectively, to the same Y scale).
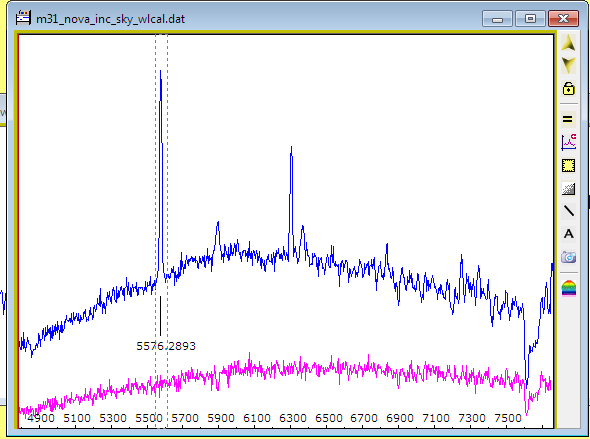
The strongest emission line is the O I airglow line at 5577A. There is also O I emission at 6300A and Na D emission (light pollution ?) at 5900A
Robin
-
AuthorPosts