Forum Replies Created
-
AuthorPosts
-
 Robin LeadbeaterParticipant
That’s good news. I see measurable flexure with my LHIRES even with everything done up tight. It was one of the early kit ones so perhaps I should take it all apart and rebuild it !
Robin LeadbeaterParticipantHi Alun,
Unwanted movement of components is a significant issue in spectrographs and the the tolerances are very small. (1/5 pixel (~1um) shifts are easily detectable.) The LHIRES design is particularly prone to these problems. Have you checked by aiming the spectrograph in different directions (NSEW,Zenith) and watching the position of the lamp lines that your mod is not introducing any additional unwanted instability ?
Cheers
Robin
Robin LeadbeaterParticipantHi Peter,
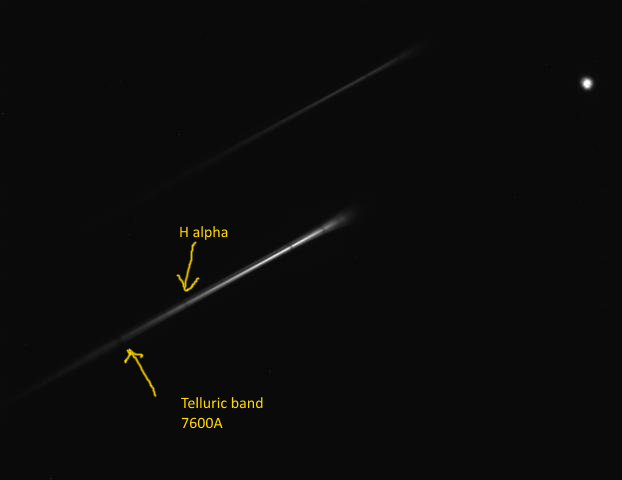
I have marked the O2 Telluric band at 7620A on your image. There is nothing useful beyond that as it overlaps with the 2nd order spectrum. You can fit the spectrum including this line and the zero order horizontally across the image at your current spacing.
Cheers
Robin
 Robin LeadbeaterParticipant
Hi Peter,
If the distance from grating to sensor is 23.5 mm you should be able to easily fit the useful part of the spectrum (0 to 7000A) horizontally across the camera field (If this is a mono camera without an IR blocking filter the spectrum will continue further into the IR up to perhaps 9000A and there will be a faint overlapping second order spectrum beyond that but the part we need is just 0-7000A.)
Cheers
Robin
Robin LeadbeaterParticipantThe best distance of the SA200 from your camera sensor for your setup would be about 30mm but you can use up to 40mm and still fit the spectrum and zero order horizontally. See the attached calculator output. Note that this camera has large pixels for your short focal length which means your images are probably under sampled (~3 arcsec/pixel) This can also give problems with ripples in the spectrum as the thickness of the spectrum may be narrower than a single row of pixels.
Robin
Robin LeadbeaterParticipantHi Peter,
Moving the grating closer to the camera shortens the length of the spectrum. You can calculate the effect using the on line calculator.
http://www.patonhawksley.co.uk/calculator/
You may find that you cannot get the SA200 close enough to the camera sensor when mounted on the camera nosepiece. The SA200 is designed to be used close to the sensor, for example in a filter wheel, not on a camera nosepiece. The best model to use for this application is probably the SA100. You can use the calculator to decide which model is best
Robin
Robin LeadbeaterParticipantI see his re-discovery has been suitably recognised with a certifcate
https://twitter.com/astronomerstel/status/976139340182179841
Robin LeadbeaterParticipantHi Peter,
I suspect the ripples could be because the spectrum is at an angle. (The camera response can also cause ripples but they tend to be broader than what we are seeing here.)
You can orientate the grating with the camera off the scope. Look at the sensor through the grating and rotate the grating until the images of the sensor produced by the grating all line up.
Cheers
Robin
EDIT – Peter, not John. (senior moment!)
Robin LeadbeaterParticipantHi Tony,
If you are interested in building a compact Littrow design using a camera lens you might find this design of Christian Buil’s interesting if you have not come across it already.
http://www.astrosurf.com/buil/us/spa/test.htm
You need a pretty good lens for this short focal length fast f ratio design to work well. He talks about the choice of lens, particularly the need for it to be compact enough to be able to mount the grating close enough to avoid vignetting. He used a Nikon lens (210 Euro in 2002) but perhaps you could try the 50mm f1.8 Olympus lens which was used with the famous Olympus OM1 SLR camera and can be picked up second hand at a good price.
For testing on a simple scope, how about a cheap small aperture Newtonian? Off axis performance is poor but you only need a good image on axis for slit spectroscopy and because there is no chromatic aberrations will be much better than a cheap refractor or camera lens
Cheers
Robin
Robin LeadbeaterParticipantHi Grant.
I also run with a home made dew shield unless it is too windy. This keeps things clear all night except once when the dew shield fell off !
Robin
Robin LeadbeaterParticipantHubble resolved stars in the nearest galaxies and measured their distances using Cepheid varibles in the 1920’s and together with Slypher and Humason established that the universe was expanding in the 1930’s. By 1967 the Big Bang was firmly established as the prevailing theory since the measurement of the cosmic microwave background by Penzias and Wilson in 1964
Robin LeadbeaterParticipantAccording to the spectrum on TNS
https://wis-tns.weizmann.ac.il/object/2018pv
This is a type Ia and ngc3941 has a distance modulus of mag 30.3 so theoretically it should top out around mag 11. The spectrum shows signs of high extinction from the host galaxy though (strong insterstellar Na line) so probably will struggle to reach that
Cheers
Robin
Robin LeadbeaterParticipantBrilliant ! Once you get used to it, it is features like this that make ISIS so nice to use.
Robin
Robin LeadbeaterParticipantI’ve just realised that you have to use a Barlow lens with a DSLR dont you because of the back focus? In that case the 5.2 um pixel size entered in the general tab will definitely not be correct.
Looking at your screenshots Ha alpha is at 3383 and H beta at 1623 so the effective pixel size will be 1.774um which ties in with the 3x magnification factor quoted for the DSLR Barlow in the ALPY instruction manual. I suspect this is the main cause of the problem
Robin
Robin LeadbeaterParticipantHaving accurate geometric corrections can also influence how easy ISIS finds locating the lines. You mentioned a 3 deg tilt but the screenshot shows 1.5 deg. Is this correct? Also is the smile correct? (measured using a strong line in the lamp spectrum)
Cheers
Robin
Robin LeadbeaterParticipantNote that the calibration assistant uses both calibration lamp lines and Balmer lines, which is explained in more detail in method 3 of the above link, so both sets of lines have to be clear in the spectra and identified correctly by ISIS. Checking the individual errors for each line can help with finding which lines are causing the problem.
Cheers
Robin
Cheers
Robin
Robin LeadbeaterParticipantHi John,
Are you using the calibration assistant method described here ?
http://www.astrosurf.com/buil/isis/guide_alpy/tuto_en.htm
If the rms errors are large in the wavelength calibration. It is usually because ISIS is not finding the correct lines in the lamp spectrum. To get this to work correctly the entered pixel size is critical. Because of tolerances in the ALPY this is not identical to the actual pixel size. You can calculate the pixel size to be entered by measuring the distance in pixels between H alpha and H beta in a hot star. The pixel size is then 3123/no of pixels. You may still need to do some fine tuning though to get ISIS to lock onto the lines correctly. Also the lamp spectrum needs to be well exposed and in good focus.
If you are having problems it can be worthwhile taking a step back and not using the calibration assistant but following the instructions here which has more information on the automatic wavelength calibration function and includes information on troubleshooting problems (method is 2 for the calibration module but the whole thing is worth reading to understand what is going on)
http://www.astrosurf.com/buil/isis/guide_alpy/resume_calibration.htm
If fact I generally use this method rather than the calibration assistant
Once set up, I find the automatic calibration reliable and much easier than finding the lines manually but it can be fiddly initially to get the pixel size correct.
Cheers
Robin
Robin LeadbeaterParticipantI am not sure if selecting the sun automatically forces the mount to track at solar speed though. You may need to select this elsewhere in the hand controller menu.
Robin
Robin LeadbeaterParticipantThe sun is not automatically included in the list of targets for safety reasons. You need to set it up first. Here are some instructions, yours may be similar
“Note that to include the Sun in the list, you must first access the Menu button (UNDO back to the “Press ENTER to begin alignment” prompt), select Utilities and then Sun Menu. This is a one-time setting and will be stored for future use. ”
from
http://www.nexstarsite.com/Book/Updates/SolarSystemAlign.htm
Dont forget to keep the main scope and finderscope covers on of course !
Cheers
Robin
Robin LeadbeaterParticipantStability can be designed in though. Looking at the ALPY for example, the design cleverly transfers the load of the camera round the key (very light weight) optical components, leaving them carrying no load which means no measurable flexure.
Robin
-
AuthorPosts