Forum Replies Created
-
AuthorPosts
-
 Robin LeadbeaterParticipant
I see there is a paper published on this already
https://arxiv.org/abs/1805.00994
Note the second author’s name. Unless it is a pseudonym, he/she just had to be an astronomer !
Robin
Robin LeadbeaterParticipantJust seen this paper where they suggest that there was indeed a dip in the light curve around maximum indicating a “super earth” exoplanet
https://arxiv.org/abs/1802.06659
Robin
Robin LeadbeaterParticipantHi Hugh,
OK so I assume your two spectra are scaled relative to the continuum over some common wavelength range? From the AAVSO data however, the V band total flux has reduced by ~0.4 mag between the two dates (I assumed values of 8.3 and 8.7) which means the amount of flux in the emission lines in the later relative flux calibrated spectrum is exaggerated. To calibrate in absolute flux I used a tool in ISIS (“Tools”, “Spectra 3” , “Flux density conversion” ) which integrates the flux in the spectrum over the standard (Bessel) V filter passband and uses the photometric V magnitude (from AAVSO) to rescale the spectrum in physical flux values. (Using the relationship between V mag and physical flux established for the standard star Vega). There are some approximations/assumptions in this method I believe and I think David Boyd has published a more rigorous method somewhere where he uses his own photometric brightness measurements but I think it should be good enough to show the trends.
Cheers
Robin
Robin LeadbeaterParticipantYes, astronomers in particular seem to be a pocket of resistance against the forces of SI.
In my other life in the paper industry, the US measure the weight per surface area of paper in pounds per ream (now generally 500 sheets) where the specified sheet size depends on the type of paper you are taking about. So 20lb newsprint (36×24 inches) is much lighter than 20lb bond paper (22×17 inches) for example !
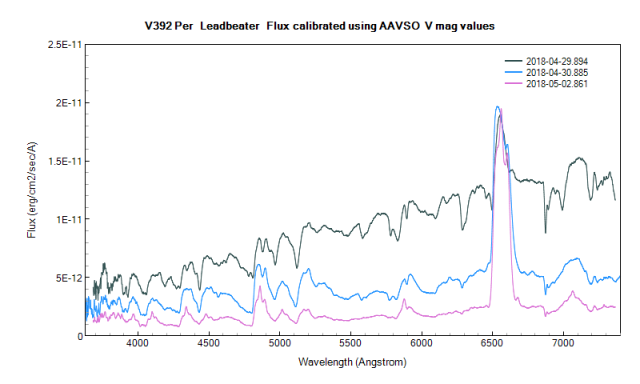
Robin LeadbeaterParticipantTonight’s spectrum (in absolute flux) compared with previous spectra. Although the H alpha line remains strong in the spectrum relative to the continuum, when expressed in absolute flux the line intensity has fallen significantly over the past 4 days.
Robin
 Robin LeadbeaterParticipant
I suspected as much. It looked noticeably brighter in the spectrograph guider but the moment I moved it onto the slit, the mist rolled in so no spectrum last night.
Robin
EDIT: No sign of rebrightening in later data in the AAVSO database though. I am now kicking myself for not grabbing the guider image
EDIT: I see the 7.3mag in VSS was in I. My guider camera is unfiltered and the nova is very interstellar reddened so probably explains why it looked so much brighter to me than the nearby Vmag 9.3 star
Robin LeadbeaterParticipantThe ARAS spectroscopy group have a symbiotic relationship with Prof Steve Shore at the University of Pisa. (We take spectra and he explains what they mean). Today he puts this event into an astrophysical context.
http://www.spectro-aras.com/forum/viewtopic.php?f=5&t=2015&start=30#p10615
Cheers
Robin
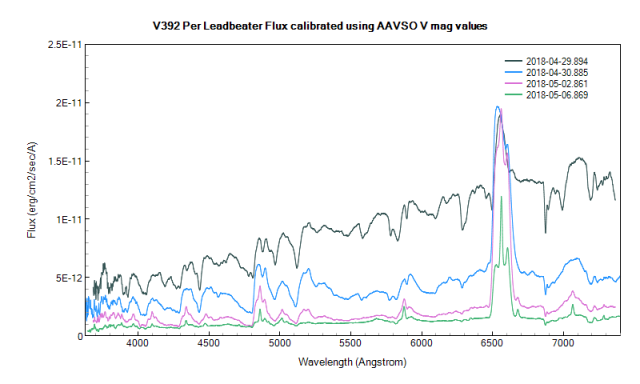
Robin LeadbeaterParticipantHere are my three spectra calibrated in absolute flux (using V mag values from the AAVSO database) rather than relative to the continuum. It is interesting to see how the peak flux at H alpha remains constant as the continuum falls away.
 Robin LeadbeaterParticipant
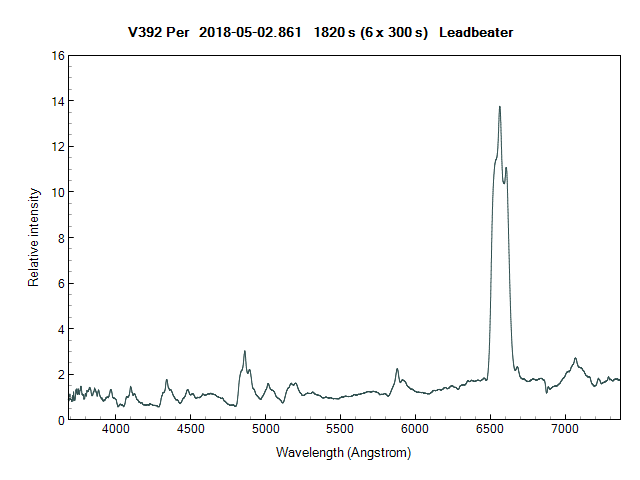
Here is tonight’s spectrum. H alpha is really dominating the spectrum now as the continuum drops away. About 1/3 of the total flux in the visible range is now from H alpha.
Robin
 1 May 2018 at 9:19 pm in reply to: Question: proper motion of star, solar system object, artefact or other? #579408Robin LeadbeaterParticipant
Simbad comes up with LSPM J0443+4722 a high proper motion star for these coordinates – good spot !
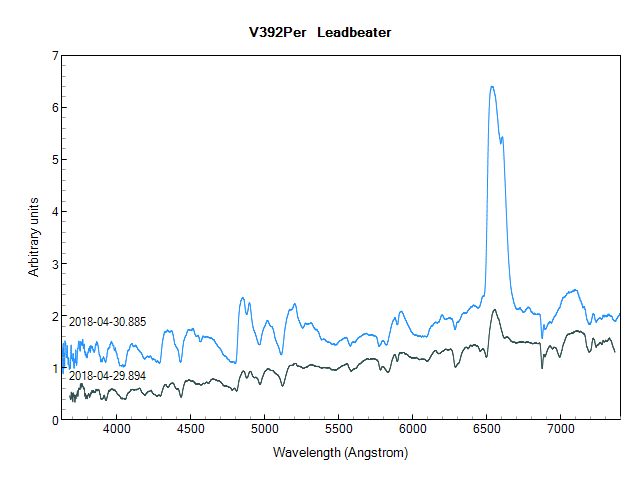
Robin LeadbeaterParticipantSpectra showing evolution between last night and tonight
(ALPY 600 R~520)
Robin
 Robin LeadbeaterParticipant
Chances are your laptop will not have a serial port though so in that case a USB-serial adaptor (sometimes built into a cable) which emulates a serial (COM) port would be needed.
Robin
Robin LeadbeaterParticipantStan Waterman’s Project Cygnus which has been running for many years is an impressive example of an amateur exoplanet/variable star survey of course. No confirmed exoplanets found though as far as I know.
http://www.stanwaterman.co.uk/variablestars/
https://www.britastro.org/vss/Stan%20Waterman%20Winchester%202017.pdf
Robin
Robin LeadbeaterParticipantHi Peter,
Are you on he right page of the manual? This is the one I mean
Select the zero order (with the mouse + left click)
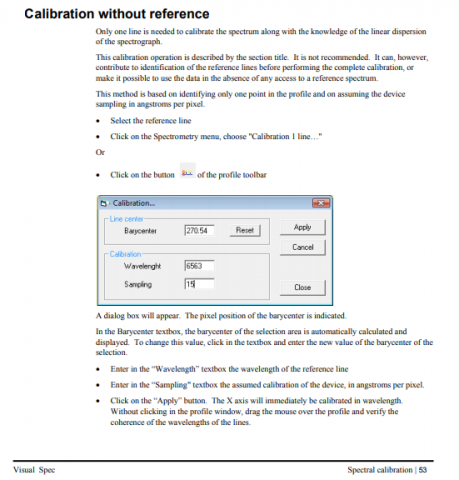
select “spectrometry”, “calibration 1 line”
In the box that pops up:-
enter 0 for “wavelength” (the zero order)
enter the dispersion (A/pixel) that you got from the reference star calibration in “sampling”
Click “apply” and the spectrum of the target star should then be calibrated using the calibration from the reference star
Robin
Robin LeadbeaterParticipantThis video tutorial shows how to do a 2 point wavelength calibration on the reference spectrum
http://astrosurf.com/vdesnoux/wink/calibspectrum_en.htm
(Do not crop the spectrum but use the zero order (entering 0 as the wavelength) and one of the H Balmer lines rather than two Balmer lines as shown there)
You can then use the zero order and the A/pixel dispersion (sampling) to calibrate any other spectrum using the 1 point calibration function. There is not a video tutorial of that but it is described on page 53 of the manual
http://astrosurf.com/vdesnoux/web/help.pdf
Cheers
Robin
Robin LeadbeaterParticipantIf you want to filter the reference spectrum first as i suggested in the tutorial in the other thread “ALHENA WITH A STARANALYSER”
https://britastro.org/node/11586
https://britastro.org/sites/default/files/attachments/Correcting%20for%20instrument%20response.pdf
then the spline filter function in Visual Spec can be found at “Operations”, “Spline Filter”
it is also a good idea to roughly rescale the spectra first before calculating the instrument response so you dont have to deal with very large numbers. You can do this by selecting a region of the spectrum using the cursor (mouse left click and drag), then right click and select “normalize”. The result is the spectrum is averaged to 1 over the selected region
Cheers
Robin
Robin LeadbeaterParticipantHi Peter,
This video on the Visual Spec website goes though all the steps in detail to calculate and use the instrument response
http://astrosurf.com/vdesnoux/video/reponse.avi
Cheers
Robin
Robin LeadbeaterParticipantremove full stop if link does not work
Robin
Robin LeadbeaterParticipantAnother area to look at is the grating holder. I noticed one of mine was much worse than the other. One of the holes in the metal plate that the brass rod ran though was slightly oval and the springs on both of them were rather weak and were probably not taking up all the play in some orientations. I put an extra turn on both of them which improved things. If you have the removable grating type holder, check there is no slack causing the grating to move. (It needs to be just tight enough to clamp the grating but not too tight otherwise you risk distorting the grating which shows up as astigmatism)
I have also heard tell of one case where the mirror came lose (It was stuck with double sided tape in the original kit, not sure if this applies to the factory built versions) Also check that the screws hold the mirror mounting (both the adjusting screw and the pivot) are done up tight too.
Also the position of the neon relative to the slit affects the position of the calibration lines so check it is centred over the slit and comes to the same place each time.
If your calibration lines move back and forth as you rotate the doublet check that the lens is seated correctly in its holder. (The original kit had two fibre washers, one either side of the lens. I removed one so the lens seats directly against the metal holder on one side, Similarly I removed the plastic foot from the micrometer so there is direct metal contact which stopped some cyclic movement in the lines as the micrometer was adjusted.
All this relates to the early kit though and may have been improved in later versions.
Robin
Robin LeadbeaterParticipantI have run this way for over 10 years using cheap second hand computers running XP Pro in the observatory. They die after a few years in the less than ideal environment but I just replace them for little money. (I installed the 3rd one last summer). Recently I have taken to running it on a separate network to the house internet so I can keep the speed up and guarantee security with XP. (It is quite heavily loaded with guidescope camera (1s frame rate), guider (1s frame rate) and spectrograph imaging camera, mount, focuser and spectrograph controls)
Robin
-
AuthorPosts