Forum Replies Created
-
AuthorPosts
-
 Robin LeadbeaterParticipant
As Andy says, BeSS standard practise is to leave the telluric lines in when submitting to the database. When analysing spectra though you will want to remove them and it is quite possible for amateurs to do this.
For high resolution spectra where the individual lines are visible it is quite straightforward using a standard template for O2 and H2O lines which is scaled to fit the magnitude of the lines. Some software eg ISIS Visual spec have this function built in.
For low resolution spectra it is more difficult as the lines blend into broad bands. The same technique can be used though by producing your own low resolution template. This is done by taking spectra of a hot star at two different air masses. If you divide one by the other, the result is the extra atmospheric absorption due to the additional atmosphere. This can then be used as a template to remove the telluric bands. You can see a simple example of using a low resolution template in this poster paper
(This technique of measuring stars at different air masses is used by professionals (and sometimes by amateurs) to correct for all atmospheric effects including extinction rather than trying to match the air mass of reference star as is commonly used by amateurs. Correction for extinction (rather than just the telluric bands) using this technique though needs photometric skies so the atmospheric conditions do not change between the two measurements at different air masses.
Cheers
Robin
Robin LeadbeaterParticipantNote though that the instrument response for a slit spectrograph is only smooth provided a flat has been used otherwise it will have ripples from the camera response.(A good reason for always using a flat). Even then I find that my ALPY instrument response has a kink in it which I believe is quite common. (a combination of the flat lamp and atmospheric extinction curves) You can see it in my MILES star report here for example.
https://britastro.org/sites/default/files/attachments/ALPY600_MILES_tests_20161105.pdf
from this thread
https://britastro.org/node/8153
The acid test to see if your instrument response is correct is to rerun the reduction on the reference star using the instrument response. The result (except for any resolution differences) should perfectly match the reference spectrum (other than the telluric bands)
Cheers
Robin
Robin LeadbeaterParticipantTo mark the occasion I though I would take a spectrum. It looks similar to others found in the literature from the 1980-90s
https://britastro.org/node/14188
Robin
Robin LeadbeaterParticipantSo sad news. It was seeing what Maurice was doing in spectroscopy over 20 years ago that got me and many others into the field. The supernova spectroscopy work I am doing is a direct result of his measurements then and the prophecy he made when president that one day amateurs would be able to confirm and classify supernovae spectroscopically, which he lived to see fulfilled. He was an important champion of spectroscopy, encouraging me and others personally and helping to build the popularity it has today. He will be sadly missed by that community internationally.
Robin
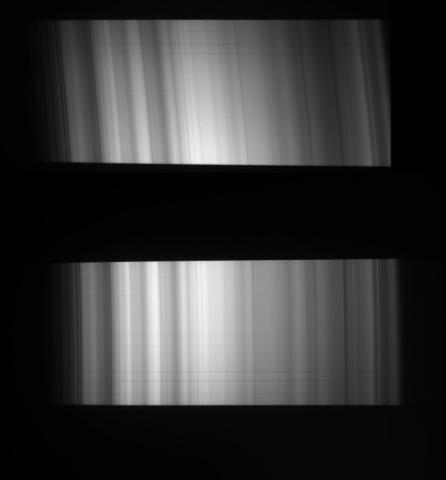
Robin LeadbeaterParticipantI dug out my before and after grism alignment images (spectrum of the sky). The spectrum is horizontal as seen by the lines generated by dust specks on the slit.
 Robin LeadbeaterParticipant
Hi Nick,
My ALPY (one from the first production batch) somehow came with the grism significantly skewed so I fixed it with Francois Cochard’s guidance. (Also I have a habit of taking everything apart to “see how it works” ! ) If it is only slightly skewed then I would not worry about it. The main reason for correcting the slant/smile is so that any lines in the sky background subtract correctly. In ISIS you select a strong lamp or sky line and it automatically measures the slant and curvature and corrects for it. I expect Demetra does something similar.
Spectroscopically I “grew up” with ISIS so I know most of its quirks well and knowing Christian Buil, I had confidence that it would give good reliable results. I was down as a beta tester of Demetra but to be honest there was no pressure for me to change over, particularly as (at least at the time. I have not kept up with its development) it was not as comprehensive and flexible as ISIS so I never really got into it. Similarly with BASS which I have never used.
Robin
Robin LeadbeaterParticipantHi Nick,
Are you saying the spectrum lines in the sky are slanted when the star spectrum is horizontal? It does not matter if it is not too far out as it can be corrected in the software (They will be slightly curved too) Getting the star spectrum as close to horizontal as possible is more important. The slanted lines mean the grooves in the grating are not exactly parallel to the slit. If it bothers you it can be adjusted in the ALPY core module. There are (two?) little Allen headed grub screws which if slackened off allow the grism to be rotated. Only slacken them off a tiny amount though otherwise the whole assembly can spring apart !. You can see the internal construction on page 4 here
http://www.threehillsobservatory.co.uk/astro/ALPY200_VdS_BAAVSS_poster_2014.pdf
Cheers
Robin
Robin LeadbeaterParticipantWere there any recordings of the Newcastle Spring meeting ? (I know it was plagued by sound system problems but the content of the talks was very interesting)
Robin
Robin LeadbeaterParticipantHi john,
Yes the spectra of novae change dramatically with time, particularly during the first few hours or days. I have been adding my spectra to the BAA spectroscopy database which show how it has been changing. They show the same trends as you are seeing. See here for a summary plot
https://tinyurl.com/V392Per-BAASDB-2
The instrument response is difficult to get right because of the high air mass at low elevation. I am now using the nearby star HD29526 as the reference with the A0v Pickles spectrum.
There were Fe emission line curtains in the spectrum but more recently they seem to have disappeared and other lines have appeared. See my posts in the ARAS forum
http://www.spectro-aras.com/forum/viewtopic.php?f=5&t=2015&start=120#p10792
http://www.spectro-aras.com/forum/viewtopic.php?f=5&t=2015&start=130#p10805
The velocities in the H and He profiles are too high to be from a rotating accretion disc so the outer spikes in the profiles must be from the ejected material. It is possible that the central spike is from the disc if it survived. (Narrow emission lines like this are a feature of dwarf novae in quiescence) It is also quite possible though that all the features are from the ejected material. Novae explosions show sigificant asymmetry of various tyes and there are various models which could fit what we are seeing. The profile shape is similar to those seen in the novae reported here for example
https://www.aanda.org/articles/aa/pdf/2014/09/aa24274-14.pdf
See here on the ARAS forum for some discussions on possible models
http://www.spectro-aras.com/forum/viewtopic.php?f=5&t=2015&start=130#p10794
http://www.spectro-aras.com/forum/viewtopic.php?f=5&t=2015&start=130#p10812
http://www.spectro-aras.com/forum/viewtopic.php?f=5&t=2015&start=140#p10840
I rather like the last one, the “double smoke ring” modelled by prof Steve Shore!
Cheers
Robin
Edited to correct a blizzard of typos !
Robin LeadbeaterParticipantThe commentary by Prof Steve Shore to accompany amateur spectra taken of novae Del 2013 is here
http://www.astrosurf.com/aras/novae/Nova2013Del.html
No two novae behave exactly the same though !
Robin
Robin LeadbeaterParticipantHi John,
Glad you found the source of your flexure. If screwed down tight I have found the ALPY to be remarkably stable. I could not detect any flexure on mine in tests moving at around the sky.
If you have not come across it before, Christian Buil has some information on the effect of combining lamp and stellar lines which you might find interesting.
http://www.astrosurf.com/buil/isis/guide_alpy/resume_calibration.htm (method 3)
Though not necessary for most applications, if you are looking for the highest accuracy using stellar spectra dont forget to take account of the earth’s motion and the radial velocity of the star which can add up to a few tens of km/s. The effects are small but can be an Angstrom or two, detectable even with the ALPY.
Cheers
Robin LeadbeaterParticipantHello Jack,
It is over years ago since I built my LHIRES but just checked and I see I actually just moved both washers to the same side. Take care to tighten the screws evenly and not to tighten too much as it brings the lens into direct contact with the metal holder. I would only do it if you are seeing significant shifts in the lines backwards and forwards as the lens is rotated. Presumably the problem in my case was uneven thickness of the washers. I did it to prove what was going on. It worked so I left it rather than trying different washers.
I suppose you could use the double line for calibration if you can identify the wavelengths. You could check Richard Walker’s Atlas to see if they are identified
Cheers
Robin
Robin LeadbeaterParticipantThe host galaxy brightness from Vizier would be the integrated brightness over the whole galaxy rather than just the core. Perhaps this explains why your measured core brightness is not higher than the Vizier magnitude ? (At a rough estimate, I would expect the SN to have increased the brightness by ~0.5 mag)
Cheers
Robin
Robin LeadbeaterParticipantHi David,
From the sharp H alpha emission line in the spectrum (from the host galaxy) the redshift = ~0.04 which corresponds to ~170MPc distance. The spectrum is clearly a type 1a. At this distance a type 1a SN would reach ~16.9 at maximum, not allowing for any redenning. The ASAS-SN mag 17.2 does seem rather bright for 9-12 days before maximum but ages estimated from the spectra can be notoriously unreliable so it could be closer to maximum than this
Robin
Robin LeadbeaterParticipant4200.67A looks to be a blend in my lamp spectrum and H alpha has completely disappeared from my lamp now
Cheers
Robin
Robin LeadbeaterParticipantAttached is the wavelength calibrated spectrum of my ALPY lamp used to produce the calibration fit above (1D fits file, you may need to change the extension to fit. for some reason the forum allows .fits file extension but not .fit)
Cheers
Robin
Robin LeadbeaterParticipantHi John,
I dont use BASS but below are the lines used by ISIS from a typical run. (Given the pixel size and the postion of one strong line it finds them automatically and produces a 4th order fit with RMS 0.25A typically.) The fit deteriorates slightly beyond 3900A but ISIS can also include Balmer lines in the violet to improve the fit there
If your lines are blurred at the violet end it could be worthwhile trying a tweak of the focus. The ALPY optics are designed to give excellent performance into the UV but with some compromise at the IR end beyond ~7000A
If you have not come across this already Richard Walker’s list is also a good one for identifying lines to use in the lamp spectrum (not all lines may be present or may differ in intensity though from lamp to lamp, for example H leaks out through the glass over time. Also watch out for blends at lower resolutions)
http://www.ursusmajor.ch/downloads/sques-relco-sc480-eichlinien-5.0.pdf
Cheers
Robin
Wavelength fit deviation
point #1 x = 338.470 lambda = 3946.250 dlambda = -0.150
point #2 x = 423.993 lambda = 4158.408 dlambda = 0.182
point #3 x = 565.202 lambda = 4510.823 dlambda = -0.093
point #4 x = 578.791 lambda = 4544.813 dlambda = 0.237
point #5 x = 623.978 lambda = 4657.878 dlambda = 0.022
point #6 x = 666.777 lambda = 4764.983 dlambda = -0.113
point #7 x = 746.795 lambda = 4965.095 dlambda = -0.015
point #8 x = 921.725 lambda = 5400.811 dlambda = -0.251
point #9 x = 1104.901 lambda = 5852.418 dlambda = 0.072
point #10 x = 1275.212 lambda = 6266.399 dlambda = 0.091
point #11 x = 1375.164 lambda = 6506.326 dlambda = 0.204
point #12 x = 1647.149 lambda = 7147.469 dlambda = -0.429
point #13 x = 1749.146 lambda = 7383.738 dlambda = 0.242
————————————————————————–
Coefficient a4 : 3.302033E-11
Coefficient a3 : -1.853850E-07
Coefficient a2 : 2.729276E-04
Coefficient a1 : 2.34638
Coefficient a0 : 3127.559
————————————————————————–
RMS : 0.248411
————————————————————————–
Robin LeadbeaterParticipantHello Jack,
I think you will find the double line is not a fault and really is a close double
Robin
Robin LeadbeaterParticipantHi Gary,
Indeed. I had not come across the name before and googled him after I posted. I wonder if his name had any influence on his choice of career ? I decided at an early age that my traditional family occupation was not for me 😉
Robin
Robin LeadbeaterParticipantThe spacing of the lines is different in the two images and there are several extra weak lines in the one with the close double. There has been a big wavelength shift to the left of about half a field between the two images and we are looking at a different part of the spectrum. (The line on the right in the first spectrum corresponds to the line on the left in the second spectrum. The doubled line is outside the right hand edge of the field in the first spectrum)
See attached
Robin
-
AuthorPosts