Forum Replies Created
-
AuthorPosts
-
 Robin LeadbeaterParticipant
If you have the latest design, Shelyak supply an alternative calibration lamp which can be used in place of the neon which includes Ar and other elements.(The same as used in the ALPY and LISA)
https://www.shelyak.com/produit/se0148-argon-neon-spare-bulbs/?lang=en
It has the disadvantage that there are lots of lines which can be difficult to identify so I suggest sticking to the neon and H alpha initially while we get the spectrograph up and running.
Cheers
Robin
Robin LeadbeaterParticipantIf you look into the spectrograph with the imaging camera removed, you can see the diagonal mirror which sends the light towards the grating through the lens. It is important that the return beam misses this mirror when it returns to the camera. This is achieved by rotating the mirror. The mirror should be adjusted so the spectrum is approximately 1/3 the way up from the bottom of the camera field when the spectrum is horizontal and orientated with red on the right.
The fact that the focus of the spectrum (The width of the spectrum line) is varying so much as you adjust the mirror. (80 pixels means the spectrum is way our of focus). I do not recall seeing this before This suggests to me something may be out of alignment. We may have to revisit this.
Cheers
Robin
Robin LeadbeaterParticipantHi Kevin,
I have seen all these issues with the LHIRES and hopefully can help work through them. Firstly can you confirm it is the latest model (ie it is a new LHIRES, not just new to you ?)
Cheers
Robin
Robin LeadbeaterParticipantThanks Nick,
I was familiar with colour measurement (CIE colour space,tristimulus values etc using standard light sources C, D65 etc) from my life in the paper industry but it was the definition and determination of the correlated colour temperature of the light source which I was particularly interested in. Following your lead I found this specificwikipedia page
https://en.wikipedia.org/wiki/Color_temperature
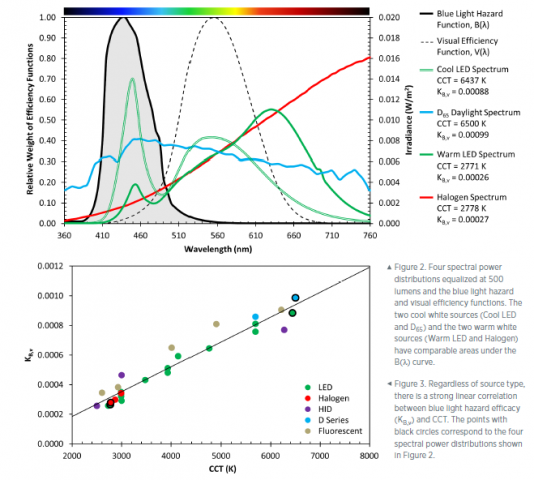
I wondered about the usefulness of the definition of CCT for light sources like LEDs which have spectra which deviate significantly from a smooth Planck curve. (Rather like trying to measure Teff of a star from the continuum shape in the visible region, a source of much confusion to beginners when they fail to get the “right answer”) The wiki page does caution about the range in which it can be used but the second plot I posted does at least suggest a good correlation between CCT and “blue light hazard efficacy” for a range of light sources regardless of their spectrum shape
Cheers
Robin
Robin LeadbeaterParticipantHere is a plot comparing different light sources wrt “blue light hazard”
The source for the plots is these interesting documents published by the US Department of Energy
https://www1.eere.energy.gov/buildings/publications/pdfs/ssl/opticalsafety_fact-sheet.pdf
https://www1.eere.energy.gov/buildings/ssl/pdfs/true-colors.pdf
Cheers
Robin
Robin LeadbeaterParticipantHi Nick,
Yes I understand the concept of colour temperature. I was looking for a quantitative measurement method. I found these spectra of various LED lamps with their rated colour temperature.
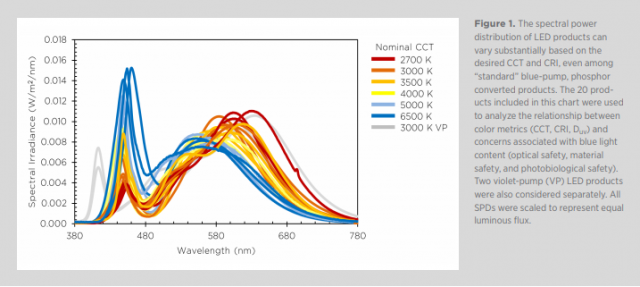
It looks like a measurement of the ratio of flux at 450nm and 600nm would give a good indication. I might knock up a simple portable spectrograph and take a few measurements
Robin LeadbeaterParticipantYou should see Filey where we were on holiday for a few days last week. They have fitted all the lamps and strings of lights along the prom seen here
http://www.geograph.org.uk/photo/833144
with the bluest LED light bulbs I have ever seen. (Hundreds of them. They looked almost purple, like mercury discharge lamps. A shame as just off the front they have a few warm white LEDs ) We stayed in a hotel on the front and the rooms were lit with this eerie light and the seagulls seemed to be awake all night.
Robin
Robin LeadbeaterParticipantIs there an established method of determining the rated effective temperature of these LED lights? (They are a long way from being black bodies or even the spectral energy distribution of the sun)
Robin
Robin LeadbeaterParticipantHi Tony,
The CAOS group site is a good source for design ideas
https://spectroscopy.wordpress.com/fibres/
but the tough bit is sourcing/making a mirror with the end of the (typically 50um) fibre embedded in it. I think most amateur built fibre fed spectrographs have ended up using the Shelyak guide head
https://www.shelyak.com/produit/pf0008-f-6-50%C2%B5m-injection-unit/?lang=en
Cheers
Robin
Robin LeadbeaterParticipantI see the author of AIP4WIN is jointly presenting a poster paper at the BAA/AAVSO meeting this weekend. Not sure if he is attending in person though
Robin
Robin LeadbeaterParticipantI see the VSS are already investigating possibilities, There are two papers on potential pro-amateur cooperation concerning exoplanets in the variable star meeting on the Sunday
11.00 – 11.50 Dr Guillem Anglada Escude (Queen Mary, University of London) Red Dots Initiative: science and opportunities in finding planets around the nearest red-dwarfs
11.50 – 12.10 Lukasz Wyrzykowski (University of Warsaw) How to find planets and black holes with microlensing events
Robin LeadbeaterParticipantHello Jack
What limitations are you trying to overcome compared with the Lodestar ? If you are looking to guide on the faintest stars, the 314 will probably go a bit fainter with a few seconds exposure. (I tried a Lodestar with my ALPY 200 but returned it as my old cooled 16ic-s would guide on fainter stars) On bright stars though you might have to use the cropped frame feature to get a decent update speed. Also what main camera are you using ? I dont think for example you can fit two 314 sized cameras side by side on the LHIRES. Anyway since you have both why not try them and let us know which works best?
Cheers
Robin
Robin LeadbeaterParticipantPeter Somogyi has published a spectrum taken with an ALPY. It confirms reports of an almost featureless blue spectrum but does not shed any more light on this puzzling object
Robin LeadbeaterParticipantReports are it is now showing spectral features of a 1c-BL supernova. There is an HCT spectrum (rectified to remove the blue continuum) linked from David Bishop’s page
http://www.rochesterastronomy.org/sn2018/sn2018cow.html
but the features are not as obvious yet compared with this one for example I called as a 1c-BL last year
https://wis-tns.weizmann.ac.il/object/2017ixv
Robin
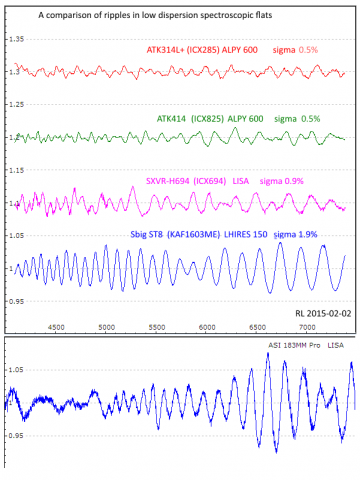
Robin LeadbeaterParticipantYes the ATK 414 is one of the best for low dispersion ripples but sadly one of the worst for high dispersion ripples seen with the LHIRES at the highest resolution (unlike its predecessor the 314 which is good at both low and high dispersion.) Unfortunately none of this is known until one tries to use them for spectroscopy. The low dispersion ripples are all but eliminated by using a flat but the high dispersion ripples can be really tough to remove.
Cheers
Robin
Robin LeadbeaterParticipantI have been keeping an eye on development with this one too. The reported spectra is blue and featureless which would be consistent with it being a CV. I think the speculation about it possibly being an SN comes from the fact that it is coincident in position with the galaxy and is within the brightness range expected for an SN at this distance (though the latest measurement at mag 13.8 would put it towards the top end for an SN at this distance I think.) The problem at the moment is, because the spectrum is currently featureless and there are confusing spectral features from the galaxy there is no definitive redshift measurement yet which would conclusively prove if it is a foreground object.
Robin
Robin LeadbeaterParticipantHi John,
The ripples come from the camera sensor. See my comment here
https://britastro.org/comment/4916#comment-4916
When you take a flat with a slit spectrograph, you are effectively taking a spectrum of the flat lamp. The ripples are from the wavelength response of the camera. These are also imprinted on the star spectrum of course so when you divide the star spectrum image by the flat they cancel out along with any other flat defects.
The ripples are caused by interference in the light, between different layers in the sensor (an etalon effect) and their spacing and severity varies from sensor to sensor. (Similar but much finer fringes are seen in high resolution spectra where they are caused by interference due to internal reflections in the sensor cover glass)
Cheers
Robin
Robin LeadbeaterParticipantThe attached paper describes the mechanism which produces these ripples in CCD sensors (page7-11) The same effect is also seen in CMOS sensors.
Robin
Robin LeadbeaterParticipantAttached is my collection of QE ripples for various sensors
Robin
 Robin LeadbeaterParticipant
Hi Jack,
The two Na D lines are from the two different spin levels. (3s to 3p1/2 and 3p3/2 in absorption) There probably is Zeeman splitting of the lines as well but this will be very small in the solar magnetic field.
Cheers
Robin
-
AuthorPosts