Forum Replies Created
-
AuthorPosts
-
 Robin LeadbeaterParticipant
Hi Bill,
>I think this is one of the reasons that the technique of comparing particular line ratio’s (as devised by Borovicka) is about as good as we can get.
Even this needs a relative flux calibration though so instrument response including flat field issues and extinction still need to be considered.
My only foray into this branch of spectroscopy was back in 2005 and I was glad to at least get something before moving on to other targets
http://www.threehillsobservatory.co.uk/astro/spectra_20.htm
My mentor back then was Ed Majden who had been doing meteor spectroscopy as far back as the ’70s at least, using film, then video. Do you know if Is he still with us ? His website is down and the AMS website mentions him doing work in the 50’s so he must be getting on
https://www.amsmeteors.org/ams-programs/meteor-spectroscopy/meteor-studies-at-majden-observatory/
Your continuous monitoring though is certainly taking things to a new level, building statistically useful numbers of observations and working outside the normal showers.
It is an area where new developments in technology are moving in our favour too, with affordable large CMOS chips with low read noise, fast readout and improved bit depth compared with the old 8 bit cameras. High efficiency volume phase transmission gratings is another interesting development, though I believe they are still rather specialist/expensive.
Cheers
Robin
Robin LeadbeaterParticipantHi Bill,
There is a link with her email at the bottom of the download page
http://astrosurf.com/vdesnoux/download.html
Cheers
Robin
Robin LeadbeaterParticipantFlux calibrating these spectra even in relative flux is not trivial. Yes the standard method to correct for instrument response and extinction using a reference star measurement is ok in principle but there are a few extra things to watch out for which make it tricky when using this technique with wide field moving targets like this. Specifically flat fielding, background subtraction and differential extinction.
Flat field correction of any slitless spectra is complex as each point in the field is a combination of zero orders and diffracted light from other points in the field so there is no one to one correspondence like in conventional flats. In practise this is effectively impossible to untangle. With static targets you can get round this problem by measuring the reference and target spectra in the same position in the field, which is the way I recommend using the Star Analyser for example but this is obviously not possible for meteors of course so my suggestion would be to take a series of spectra of a bright standard star at different locations in the field and asses exactly how much effect it has on the spectrum. If the spectrum shape varies significantly then some allowance has to be made for this depending on the location of the meteor spectrum.
Similarly sky background subtraction is difficult compared with narrow field fixed targets where the sky can be measured directly above and below the spectrum. Perhaps this is not too much of a problem for short exposure videos of meteors though where subtraction of frames before and after the meteor could be used. (Linearity of the light response is obviously important – no gamma correction to be used)
Extinction effects over such a wide field can be significant and will vary along the trail. These could be corrected for using an atmospheric model and some sort of mean elevation figure for the meteor though.
Robin
Robin LeadbeaterParticipantHi Bill
Just checked the Visual Spec website and all looks fine this end. Was it a particular link on the tutorial page? (Some of them use flash which perhaps could have been flagged up as a security problem. ) If there is a problem then we need to let Valerie know.
Cheers
Robin
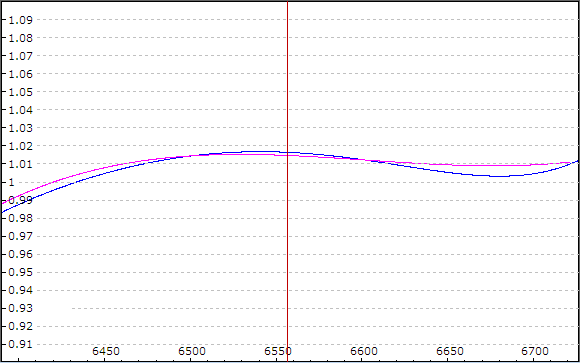
Robin LeadbeaterParticipantI quickly pulled out a couple of instrument responses at H alpha (using a 1200 l/mm grating so covering a wider wavelength range than the 2400 grating.) They are flat within +-1.5%
 Robin LeadbeaterParticipant
You could try measuring the IR using a high reference resolution spectrum and see how it compares with you MILES IR.(Unless I am working low to the horizon or at the blue end just use a bright star like Vega, Altair, Regulus for example which can be recorded quickly.) If it is significantly different, it might be safer to just rectify the spectra you have already taken. (You can still submit them the BeSS setting the appropriate flag in the fits header.
To be a bit controversial (and this is just my personal view) I think for relative flux calibrated H alpha spectra, most of the time IR correction of a narrow wavelength range at high resolution is a waste of good observing time. (And may even lead to increased variability, though I need to quantify this). If you use a flat, You are already getting rid of all instrument affects as they divide out, leaving the flat lamp spectrum and the atmospheric extinction which hardly varies across the range. If you are using ISIS, this even removes the small slope due to flat lamp spectrum, assuming a black body at 2750K I believe so the IR ends up being effectively a horizontal flat line. In the projects I have been involved in where narrow range spectra have been used, the first step in analysing the data has been to rectify all the spectra first in any case.
Cheers
Robin
Robin LeadbeaterParticipantIt is worth noting that the technique of using a reference star near in elevation to the target is technique developed to make it easier for amateurs. Because professionals have stable setups and know their atmospheric conditions, they tend to use a standard instrument response measured infrequently using precisely measured spectrophotometric standard stars, combined with a measure of extinction on the night together with an atmospheric model. ISIS does have the tools to do this though.
http://www.astrosurf.com/buil/isis/guide_response/method.htm
Robin LeadbeaterParticipantHi Kevin,
You can do an instrument response in the usual way but you need a high resolution spectrum to compare with so you can match profile including the line. You can see an example of that about halfway down on Christian Buil’s page on reducing LHIRES spectra here
http://www.astrosurf.com/buil/isis/guide_lhires/tuto1_en.htm
and also specifically covered on this page
http://www.astrosurf.com/aras/tutorial5/note1_us.htm
Fortunately unless you are working at the far blue end, atmospheric extinction does not have much effect over the narrow wavelength range so you can use stars which might be some distance from the target (or even at a pinch instrument responses taken on different nights)
Two good sources for high resolution spectra of bright stars are the UVES bright stars
http://www.eso.org/sci/observing/tools/uvespop/bright_stars_uptonow.html
and provided you are working above 4000A,the ELODIE 3.1 list (spectra from the ELODIE archive selected for quality.) See here on ARAS for more background on this set of stars
http://www.spectro-aras.com/forum/viewtopic.php?f=8&t=1369
Both of these are available in the built in ISIS database (you have to load the ELODIE 3.1 star list)
http://www.spectro-aras.com/forum/viewtopic.php?f=8&t=1864
Is it necessary/worth it rather than just rectifying the spectrum for small wavelength ranges? Possibly not, it depends on the application but BeSS recommends it.
Cheers
Robin
Robin LeadbeaterParticipantYep the good old Relco 480 (but possibly gold plated given the price !) To be fair though, I believe there is a lot of variability so Shelyak select the better ones and discard the rest. Starlight Xpress use it in their spectrograph too. A great discovery by Richard Walker who should be on commission! My first tests with it in the LHIRES are here
http://www.spectro-aras.com/forum/viewtopic.php?f=8&t=606&hilit=relco+starter#p2380
Robin
Robin LeadbeaterParticipant> I know that early versions had three degrees of freedom on the guide mirror (two tilt and back-and-forth). The reduction to one with the piston design has thrown some of the ‘baby out with the bathwater’ in my view..
I am thinking that too. I can see why it was done as It was easy to get into a mess with the old tip/tilt setup but the new setup depends on that wall of the spectrograph being very accurately square which cannot be guaranteed with the type of case construction used. Having reviewed what I posted on that ARAS thread, I am not convinced my alignment is quite as good as originally. There is not enough room for the old mechanism now though with the the calibration lamp mechanism.
Robin LeadbeaterParticipantAndy’s comments started me wondering about this. There are two ways to move the spectrum vertical position in the camera field. You can adjust the spectrograph mirror or you can move the star along the slit. You commented, Kevin that the slit position and the sweet spot did not correspond to the centre of the guider field. (They should do when everything is correct.) I wonder if because of this, where you are placing the star is off the spectrograph axis, exaggerating the widening effect in the spectrum.
Robin
Robin LeadbeaterParticipantI have converted over to the latest guider mirror setup and I made some tests today using the internal flat lamp and a pinhole in place of the slit (actually a piece of foil with a slit in it overlaid at right angles over the middle of the original slit.) This effectively simulates an on axis star in the spectrograph, though the effective focal ratio may not be correct.
I first checked that the crossed slits were central in the guider image so the slit and my guider image should be centralised on axis. (Hopefully the guider image coma will be minimum at this position too when I make a test on the sky)
I then recorded flat and calibration lamp spectra at H alpha 1/3 from top,middle and 1/3 from bottom of the camera field (having previously focused the calibration lamp lines for best focus.)
The first thing to note is the instruction to set the spectrum at 1/3 (from top or bottom) is rather meaningless as the actual position will depend on the size of the sensor. (I have an ATIK 314 with 6.45um pixels so moving 1/3 of the field equates to moving ~2.2mm)
I found that there was no change in total flux or spectrum resolution for all three positions. (though because the effective focal ratio of the flat lamp may not match that of the scope, potential vignetting will need to be checked using a real star)
I did indeed find that the thickness of the spectrum increases when moving the spectrum from top1/3 to bottom1/3. In this case approximately doubling in width (FWHM) from ~ 50um to ~100um or 8-16 pixels (The actual size of the pinhole in this direction is no known as it was just scored in the foil) This seems less than you were quoting Kevin, though perhaps you have a larger sensor/smaller pixels ?
I also made the same measurements on the zero order image with similar results, though the height of the zero order image was a bit less than that of the spectrum, (~2/3) possibly due to the anamorphic factor which makes the diffracted image narrower in the dispersion direction but wider at right angles to it.
Robin
Robin LeadbeaterParticipantHi Kevin,
I will reply to all posts here to avoid having to chase up and down the thread. (I have to say I don’t like this type of forum layout. I much prefer the more common layout like Stargazerslounge etc which are linear and you can quote)
Reply to #8
>(i) The spectrum gets wider (more height in Y-axis) as it goes down the sensor.
Yes to me this is unexpected but we need confirmation if it is normal. No clear skies here but I will dig out my artificial star or perhaps replace the slit for a hole and see what I get. I think we need to check this first before adjusting anything else.
>(ii) As well as this, the overall integrated flux gets bigger – an increase of around 50% from the two extremes explored here. I am assuming the final Isis image has removed the background and so the flux is signal, rather than background+signal. (You might expect total flux to increase just because its a bigger area…)No the total flux should stay the same. (The light from the star is just being spread over more rows). The flux may be changing as the mirror vignettes the return beam
>(iii) However, the spectrum is not so good in the larger-flux, lower-in-image version. In particular, it doest work well with the optimal binning optionOptimum binning selects particular rows to maximise signal/noise. For flux measurements, turn off optimal binning (and just set the binning zone to just include the full height of the spectrum (stretch the image to see the full extent) and subtract the background setting the background zones away from the spectrum above and below
Reply to #14
>By the way, do you know how Isis calculates R? It seems to do it from the image/spectrum and not from parameters as such.
I think it calculates it from the lamp spectrum. It can give variable results though. I prefer to measured the FWHM directly off the lamp spectrum. R = wavelength/lamp line FWHM
Reply to #23
>I have not tried loosening the screws on the grating holder – it sounded scary 🙂 But maybe I should try and re-tighten to get a feel for how this works
I recommend we clarify the widening with mirror position first before touching the grating.
Cheers
Robin
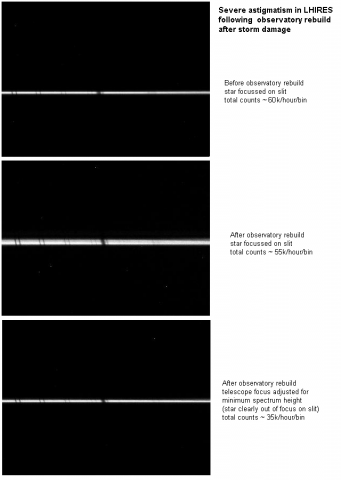
Robin LeadbeaterParticipantAttached are examples of before and after spectra when the grating was overtightened after a rebuild, though unfortunately I did not do the zero order test before I cured it which would have conclusively proved astigmatism. With the spectrum at its narrowest, the star was out of focus on the slit and the throughput was low. Adjusting the telescope so the star was in focus on the slit gave good throughput but a wide spectrum. Once the grating clamps were slackened off. Everything returned to normal (The star was in focus on the slit, the spectrum was narrow and the throughput was good)
Robin
 Robin LeadbeaterParticipant
>A possible test for this could be to check the zero order image of a star without the slit in place. In this configuration the grating is effectively a mirror so the image should be round. I have not tried this though.
Actually, checking back I see I did run this test. (though only after I had cured the astigmatism.) The test report is attached.
Cheers
Robin
Robin LeadbeaterParticipantYes mine was one of the original kit versions. Having to assemble it from a box of bits taught me a lot about how it works. You can still see the assembly photos and drawings on Olivier Thizy’s website
http://astrosurf.com/thizy/lhires3/index-en.html
I have asked for confirmation about the main mirror adjustment on the ARAS forum.
>it does increase the height of the image. However I think this might not matter
The large change in width of the spectrum with the mirror position is strange. I am pretty sure I do not see this but I need a clear sky to check and the run of good weather has broken at this end of the country.
A wide spectrum, even if it does not affect the total flux is not ideal as you have to sum more rows, introducing more noise from the camera and sky background.
If the spectrum is wide when the star is focused on the slit (ie the flux is maximum), this can be due to astigmatism. ie the focus of the collimator lens in the dispersion direction (as set up by making the lamp lines sharp) is different to that in the vertical direction. (The spectrograph design has some inherent distortion of the image but this is small) . I had this issue once when I overtightened the grating in the holder, distorting it slightly into effectively a cylindrical lens. I am note sure how the gratings are supported in the latest design. A possible test for this could be to check the zero order image of a star without the slit in place. In this configuration the grating is effectively a mirror so the image should be round. I have not tried this though.
When the grating was not pinched I did not see any significant difference in focus between the guider and the spectrum image. (ie when the star was in focus on the slit the spectrum was narrow.) This is true for both my ALPY and LHIRES.
Cheers
Robin
Robin LeadbeaterParticipant>Do you mean the star disc spreads beyong the slit? For the stars I am looking at this is certainly the case. In this respect (star >diameter vs slit width) my guide images look liek the one Andy posted above.
Images of the star on the slit can be deceiving if the star is over exposed as the overspill looks worse than it is. Best to measure the typical FWHM of the point spread function of the star when correctly exposed and in focus. Matching the slit width to this is a good compromise as most of the light will pass through the slit and you will optimise the resolution. With your setup 23um corresponds to 2.4 arcsec and 35um is 3.6 arcsec. I would not go any wider as you lose too much resolution. You cannot reduce the star size using a focal reducer either as that produces more vignetting in the spectrograph. When you do these sorts of calculations you begin to see how the telescope, local seeing and spectrograph design are intimately linked. The LHIRES is optimised for an 8 inch f10 with 2.5arcsec seeing.
Robin
EDIT: Found the calculator I was looking for. For a gaussian shaped star profile, 76% of the light will pass through a FWHM wide slit.
https://spectroscopy.wordpress.com/2009/05/22/slitpinhole-flux-calculator/
Robin LeadbeaterParticipantSo it does ! I need to recheck this then. (I was shown how to set it up this way at OHP workshop back in 2006.) The photos in the manual are rather confusing as they appear to show the spectra running vertically, displaced to the left. It also looks like the manual (on line at least) is well overdue for an update as it still shows the original kit built instrument with the adjustable slit and the old guider and calibration lamp setup.
Cheers
Robin
Robin LeadbeaterParticipantHere is a post on spectro-l from Francois Cochard back in 2010 which helped me when setting up my guider.
https://groups.yahoo.com/neo/groups/spectro-l/conversations/messages/7119
and here is my comment in the same thread on the sweet spot position
https://groups.yahoo.com/neo/groups/spectro-l/conversations/messages/7079
Robin
Robin LeadbeaterParticipantHere I am talking about the light beam after the slit. It has to fit through the collimator in both directions. The collimator is f8 but there is an angle between the beam in each direction and the return beam is also dispersed by the grating so is wider. This means an f8 beam will overspill the collimator hence the f10 design specification for the LHIRES. Running at f8 does not affect the spectrum quality appreciably though, you just lose a bit of light. In spectrograph design there is a trade off between slit width, focal ratio and resolution. The upshot is though for a given resolution, the size of spectrograph optics scales with telescope aperture.
Robin
-
AuthorPosts