Forum Replies Created
-
AuthorPosts
-
 Robin LeadbeaterParticipant
Hi Paul,
I think he sort of did 😉 You could PM for details
19 September 2018 at 6:57 pm in reply to: New RCB star in Cam – call for photometry/spectroscopy #580016Robin LeadbeaterParticipantLatest feedback from Gabriel Murawski based on the spectrum is that this may in fact be a YSO. It is currently being looked at by experts in this area.
Robin
Robin LeadbeaterParticipantI have posted some information specifically about spectroscopy in the spectroscopy section
https://britastro.org/node/15540
Robin
Robin LeadbeaterParticipantHi Tony,
the ARAS forum has a new for sale section now, “Petites Annonces” though there are not really many constructors there.
The astronomical_spectroscopy yahoo group probably has more self builders and I see there was a recent ad there for an L200 for example, you could check with Ken who owns the group if it would be acceptable
Also Stargazers Lounge perhaps where there is some interest in spectroscopy ?
Robin
Robin LeadbeaterParticipantAccording to BeSS, it is not catalogued as a Be star unfortunately otherwise there would undoubtedly have been a good history of H alpha spectra of this bright object. Does anyone know why it is not in the Be Star catalogue ?
Robin
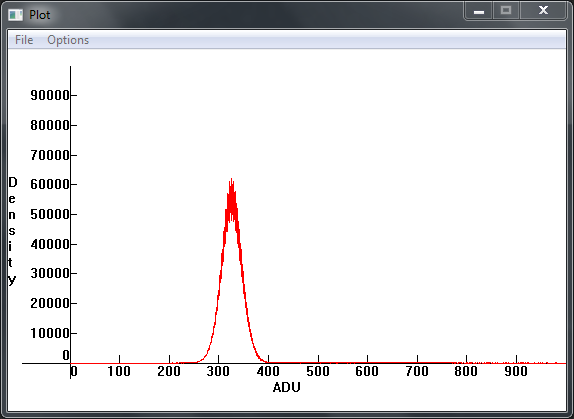
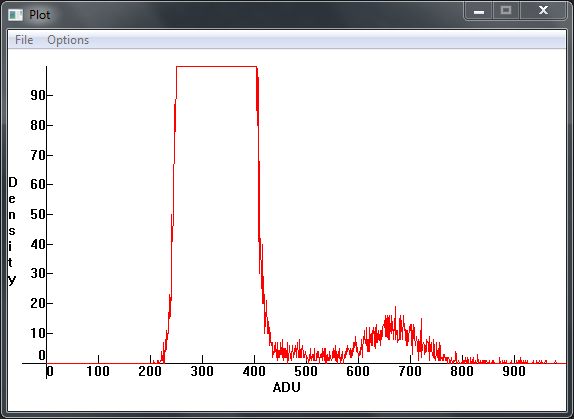
Robin LeadbeaterParticipantLooking in detail at the distribution of these warm pixels in my camera it seems most of them fall between 500-800 ADU, causing the “knee” in the cumulative distribution described in the ARAS thread. They are in fixed positions and only represent ~1 in every 2000 pixels though and are low enough to be corrected by a dark provided they are otherwise well behaved.
Robin
 Robin LeadbeaterParticipant
Hi John,
Here is a link to a dark taken under the same conditions as yours using my ATIK 428. This camera is identical except for using a smaller version of the same CCD so should be a direct comparison.
https://drive.google.com/file/d/1QkocrvkQRBCOlTK9NbxOhSVxWMwM7COg/view?usp=sharing
If you have ISIS, it includes a nice feature which you can use to calculate the gain, and noise figures described here
http://www.astrosurf.com/buil/isis/noise/result.htm
These warm pixels are not specifically measured using this technique though. To get the dark current figures quoted by ATIK and measured by Christian Buil, you have to chose a measured area free of warm pixels.
Robin
Robin LeadbeaterParticipantHi John,
I remember there was some discussion on the ARAS forum about the long tail of warm pixels seen in cameras with Sony CCD which seems to have got progressively worse with each generation.
http://www.spectro-aras.com/forum/viewtopic.php?f=8&t=1919&p=9871
I recently saw an article somewhere which suggested this was a characteristic of CCD with anti-blooming, a connection had not been aware of before.
Discounting these, the noise figure of these CCD is very good though and they seem to respond well to dark subtraction.
Running at a lower temperature might help. I run my similar ATK428 at -10C all the year round.
Robin
Robin LeadbeaterParticipantA potential target for a spectrum. mag 15 is just about bright enough for a standard ALPY 600 and a modest (say> 10 inch) aperture.
Robin
Robin LeadbeaterParticipantHi Woody,
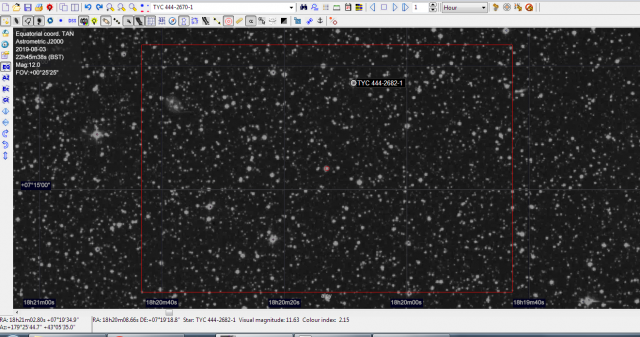
I have it on my list but have not had a chance to look at it yet. It looks a very crowded field. I make it this one in centre of the DSS image. Is that correct ? From VSX J2000 18 20 12.99 +07 15 52.1
Cheers
Robin
 7 September 2018 at 4:02 pm in reply to: New RCB star in Cam – call for photometry/spectroscopy #579972Robin LeadbeaterParticipant
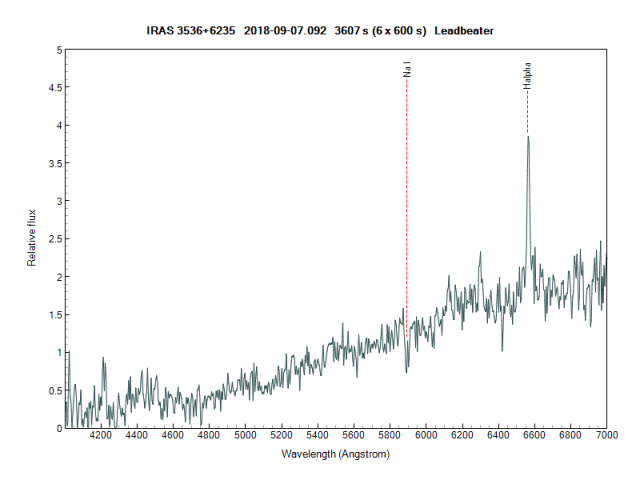
Here is the reduced spectrum. Very noisy but the H alpha emission is clear. The continuum is very red but there is high extinction in this direction. Total galactic E(B-V) is ~1.0 according to IRSA. The Na D line is clear but again that could be Interstellar.
Robin
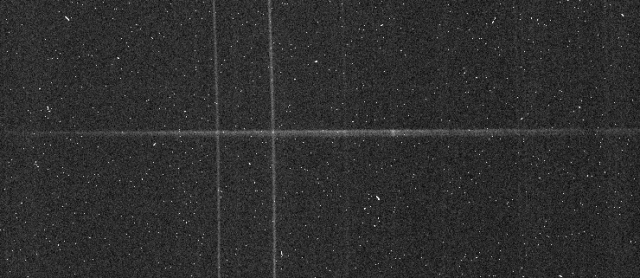
 7 September 2018 at 3:58 am in reply to: New RCB star in Cam – call for photometry/spectroscopy #579969Robin LeadbeaterParticipant
On it now with the ALPY600. It is very weak but there is clear H alpha in emission. Raw spectrum image (30min) attached
Robin
 Robin LeadbeaterParticipant
I wondered this too. A piece of Mg alloy not large enough to have been tracked but enough to produce a trail ?
Robin
Robin LeadbeaterParticipantMichael Richmond’s on line calculator can be used to estimate the performance of a given setup for example
http://spiff.rit.edu/richmond/signal.shtml
Robin
Robin LeadbeaterParticipantadded replies to #9 and #11 above
(Note to webmaster – we need a quote button so we can keep to a linear thread and not lose replies back up the thread)
Robin
Robin LeadbeaterParticipantThen you are currently slightly undersampled already and would not want to go any shorter in focal length. Undersampling in photometry is much less desirable than oversampling.
Robin
Robin LeadbeaterParticipantYep sorry, factor of 4 out but the ratio (and hence the increased counts) is the same. Changing the magnification (ie focal length) changes the counts per pixel (both star and sky background counts) but makes no different to the counts in the aperture, either the star counts or the sky background counts. The only difference is if you spread the light over more pixelsthan you need to, you increase the camera noise contribution. In practise this is only the thermal noise, not the read noise as you can compensate for this (in CCD cameras) by binning pixels. Thermal noise is very low in modern CCD, particularly at typical exposure times used for photometry so the net effect is that changing focal length does not improve photometry SNR, only increasing the aperture does this
Robin
Robin LeadbeaterParticipantWhat is your typical star size with the 70mm f6 currently? 3 arcsec is only 6.1um with your existing setup so you are potentially undersampled already so there would be no advantage going to a lower focal length to beat the seeing. (I think potential gain is only marginal anyway as all you do by moving to a shorter focal length is reduce the camera noise contribution, the star and sky background counts stay the same).
The extra aperture will gain you some photons though (Area of C6 is 608 cm2 allowing for the central obstruction compared with 154 cm2 so ~4x or ~1.5 magnitudes)
Robin
Robin LeadbeaterParticipantWould the C6 with a focal reducer to f6.3 perhaps be a better bet? (3 arcsec at 950mm focal length = 13.8um)
Robin
Robin LeadbeaterParticipant3 arcsec at 290mm focal length is just 4.2um so with most cameras you are likely to be undersampled unless you defocus aren’t you ?
Robin
-
AuthorPosts