
Forum Replies Created
-
AuthorPosts
-
 Steve KnightParticipant
Thanks Jeremy. Getting to grips with this now as T CrB photometry is my dissertation subject this year. I should be able to keep on monitoring it through solar conjunction if I travel a mile into Exmoor for evening view. Morning view should be possible from my garden. Luckily Seestars are not exactly large and heavy.
Steve KnightParticipantAnyone else noticed that T CrB has been brightening over the last month? Of course it could be just down to my lamentable skill at coding in Python. Awaiting a V filter so I can calibrate the magnitude. Observed with Seestar S30 using stacks of 10 sec exposures. Timescale is JD-2400000.
-
This reply was modified 2 weeks, 2 days ago by
 Steve Knight.
Attachments:
Steve KnightParticipantIt saves a csv for every frame, seems to have identified 15 reference stars using Gaia G magnitude. Here row 6 is AAVSO reference star 98, V magnitude is 9.8, listed here as 9.55 which matches. T CrB is row 21, calculation is mag 9.74 which I guess is what it thinks Gaia G magnitude is.
Impressive that it is calculating magnitude of a total of 64 stars in 1,195 frames real time and logging it. That’s 76,480 “observations” last night.
I’m sure someone with much better Python expertise than I could do something useful with this.
Used S50 for test, 5 sec exposures.
-
This reply was modified 3 weeks ago by Steve Knight.
Attachments:
Steve KnightParticipantWell I tested it last night. It is saving a csv file for every exposure, 1195 on T CrB last night, 5 sec exposures with an S50. It is choosing 15 reference stars. Magnitude used is Gaia G, different to Seestar G channel, on the attached row row 6 is AAVSO reference star 98. V magnitude ~9.8, Gaia G ~9.55. Same as here.
T CrB is row 21, magnitude 9.74. I guess that is what it thinks the Gaia G magnitude is. It flags it as a variable which must be from a catalog.
The impressive thing is it is measuring magnitude of 64 stars in 1,195 frames and logging it every 15 seconds.
-
This reply was modified 3 weeks ago by Steve Knight.
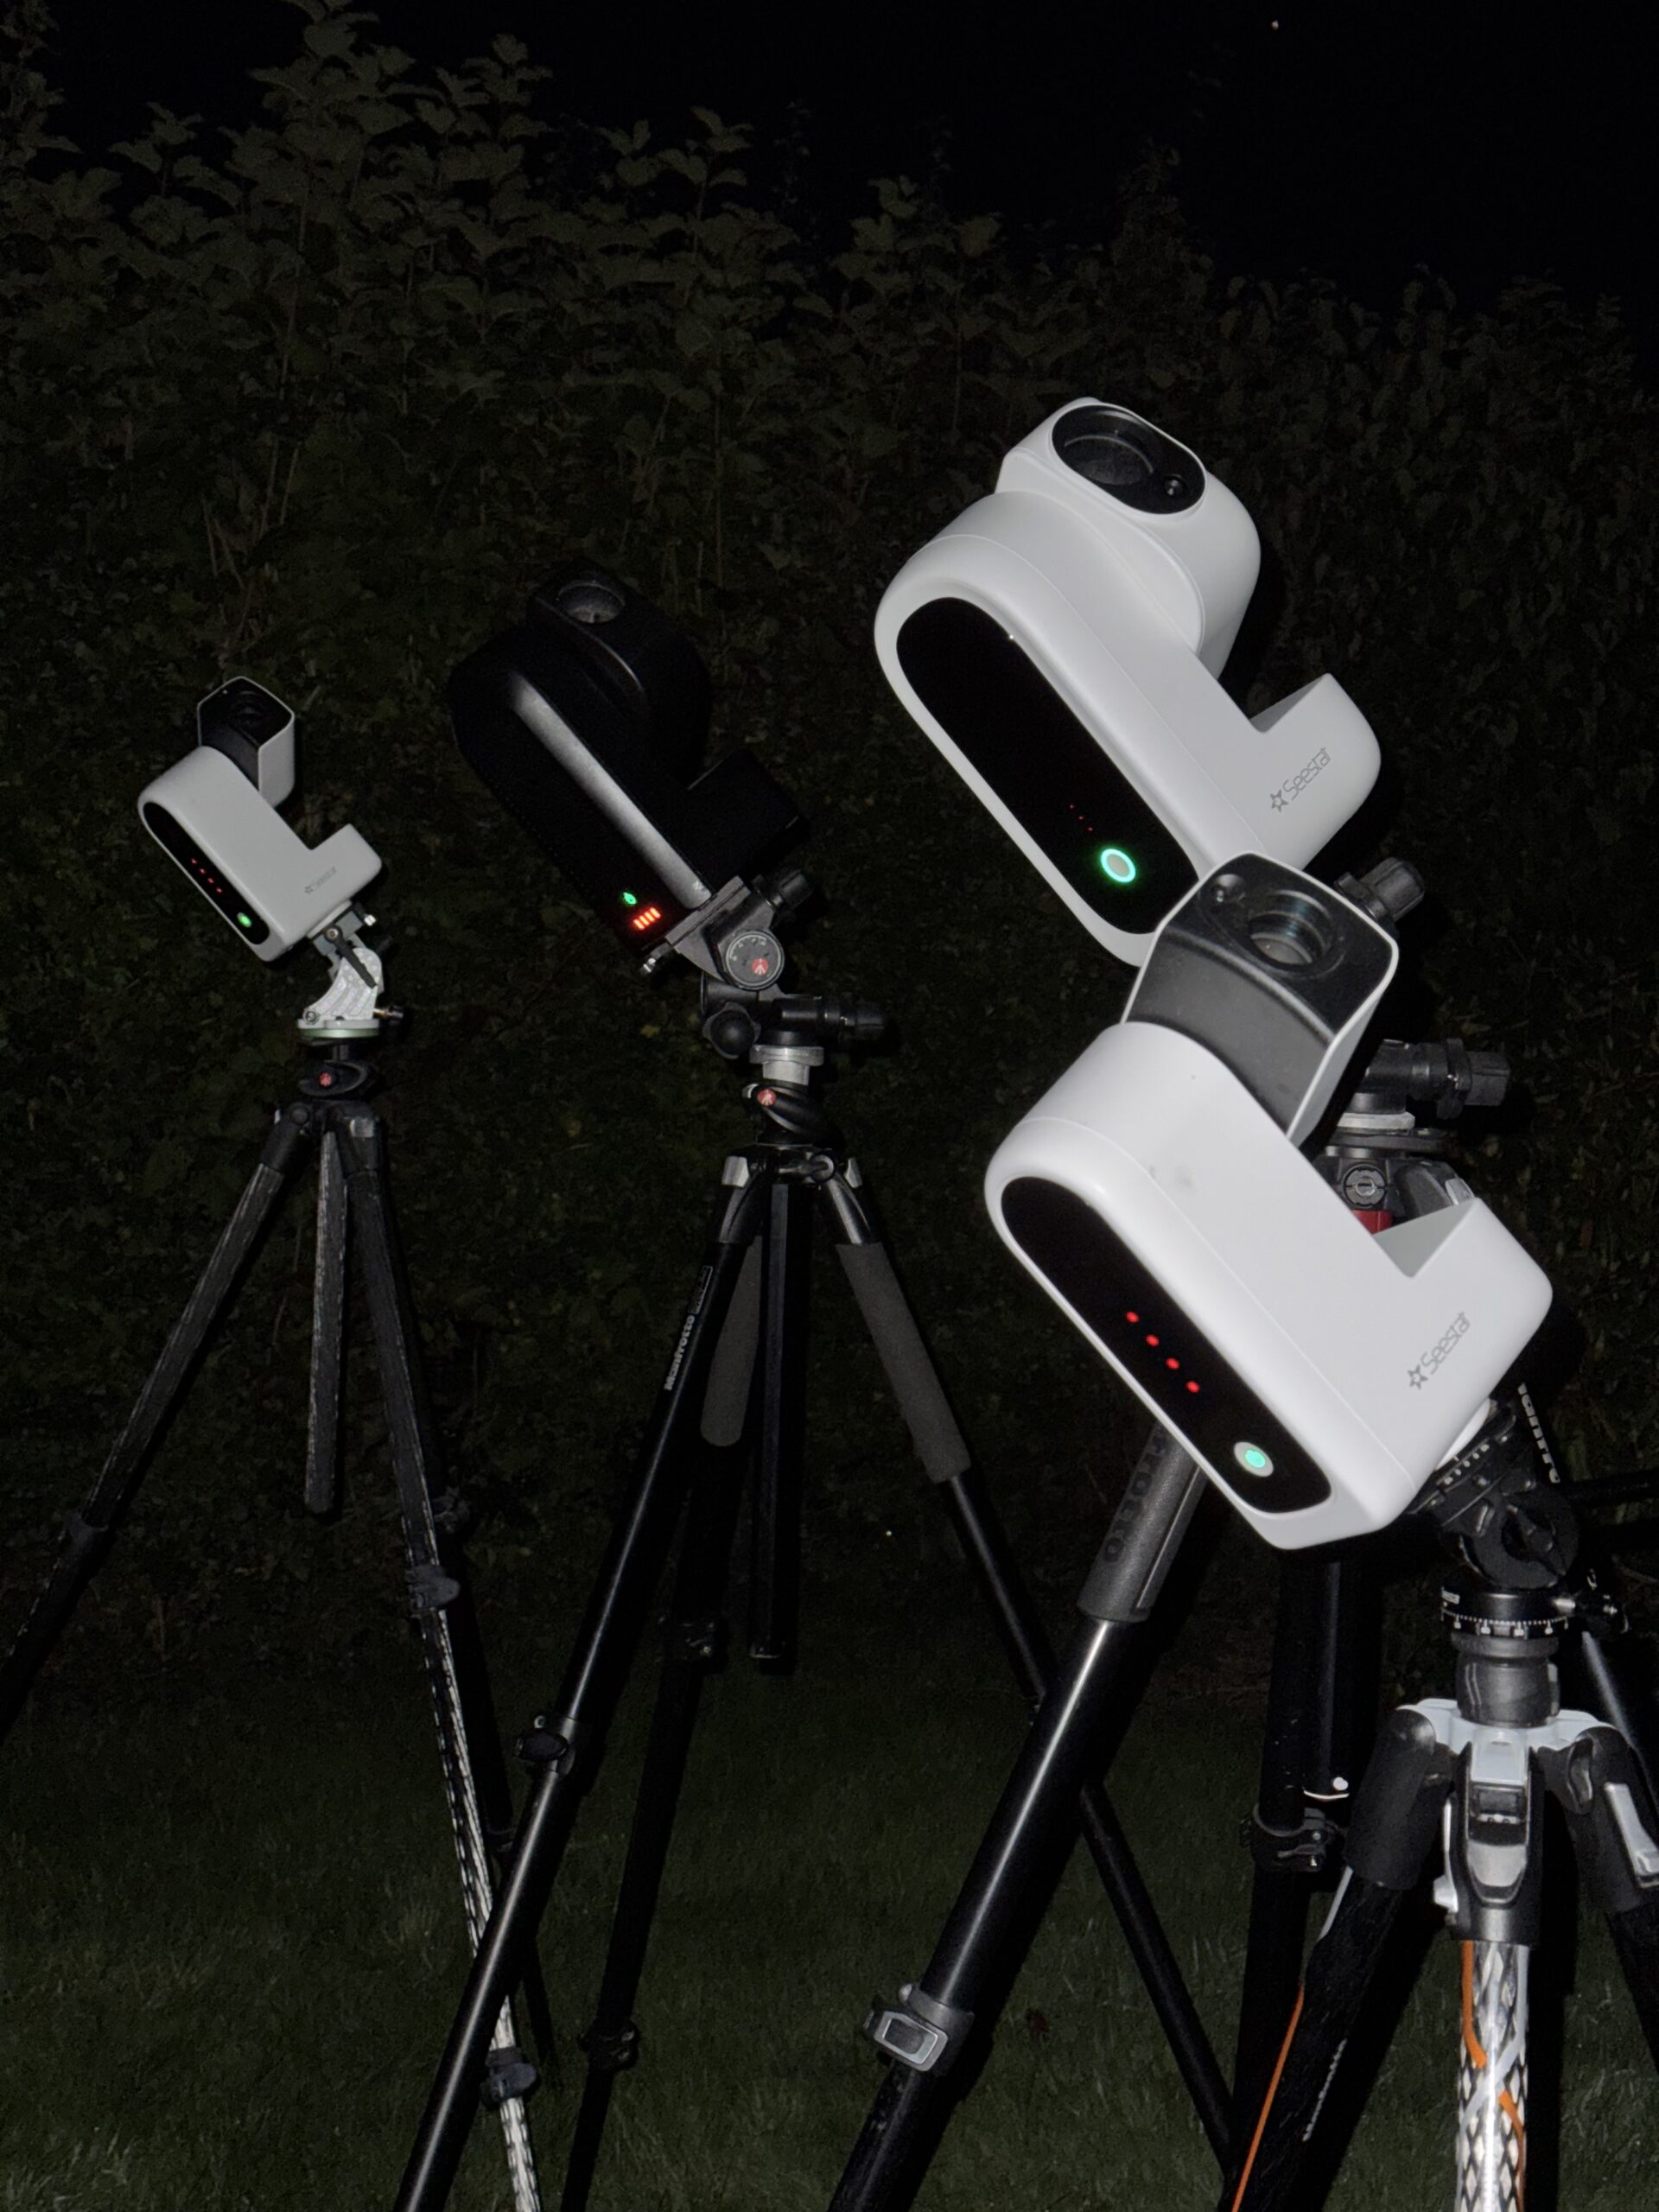
Steve KnightParticipantCurrently have 4 Seestars on T CrB, the one in middle is in photometry mode. AstroImageJ vs ZWO. We will see.
Attachments:
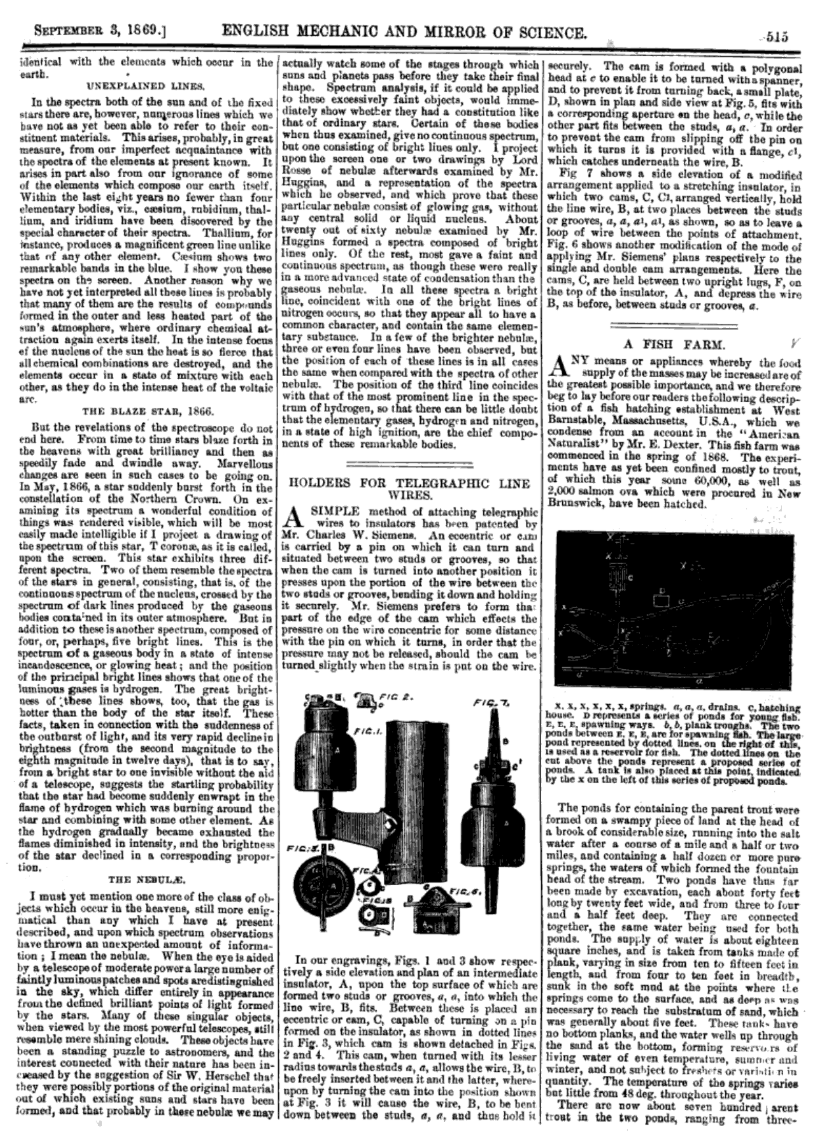
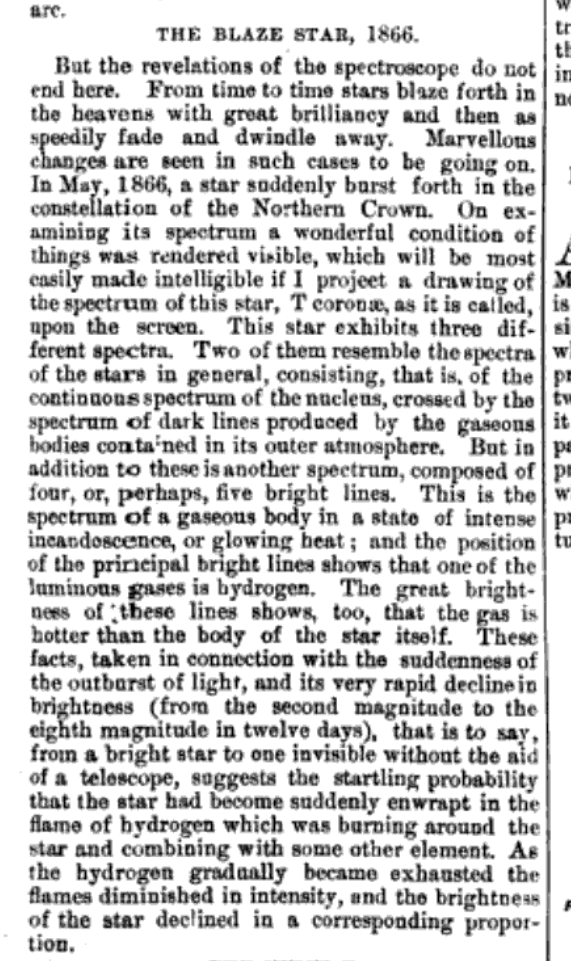
Steve KnightParticipantI’ve always been slightly irritated by calling T CrB “The Blaze Star” and had assumed it was a comparitively recent Americanism. Apologies to all Americans for my prejudice. It turns out I was wrong, it was first used in the Sept 15th 1869 edition of English Mechanic & Mirror of Science. I will now be using the term at every opportunity!
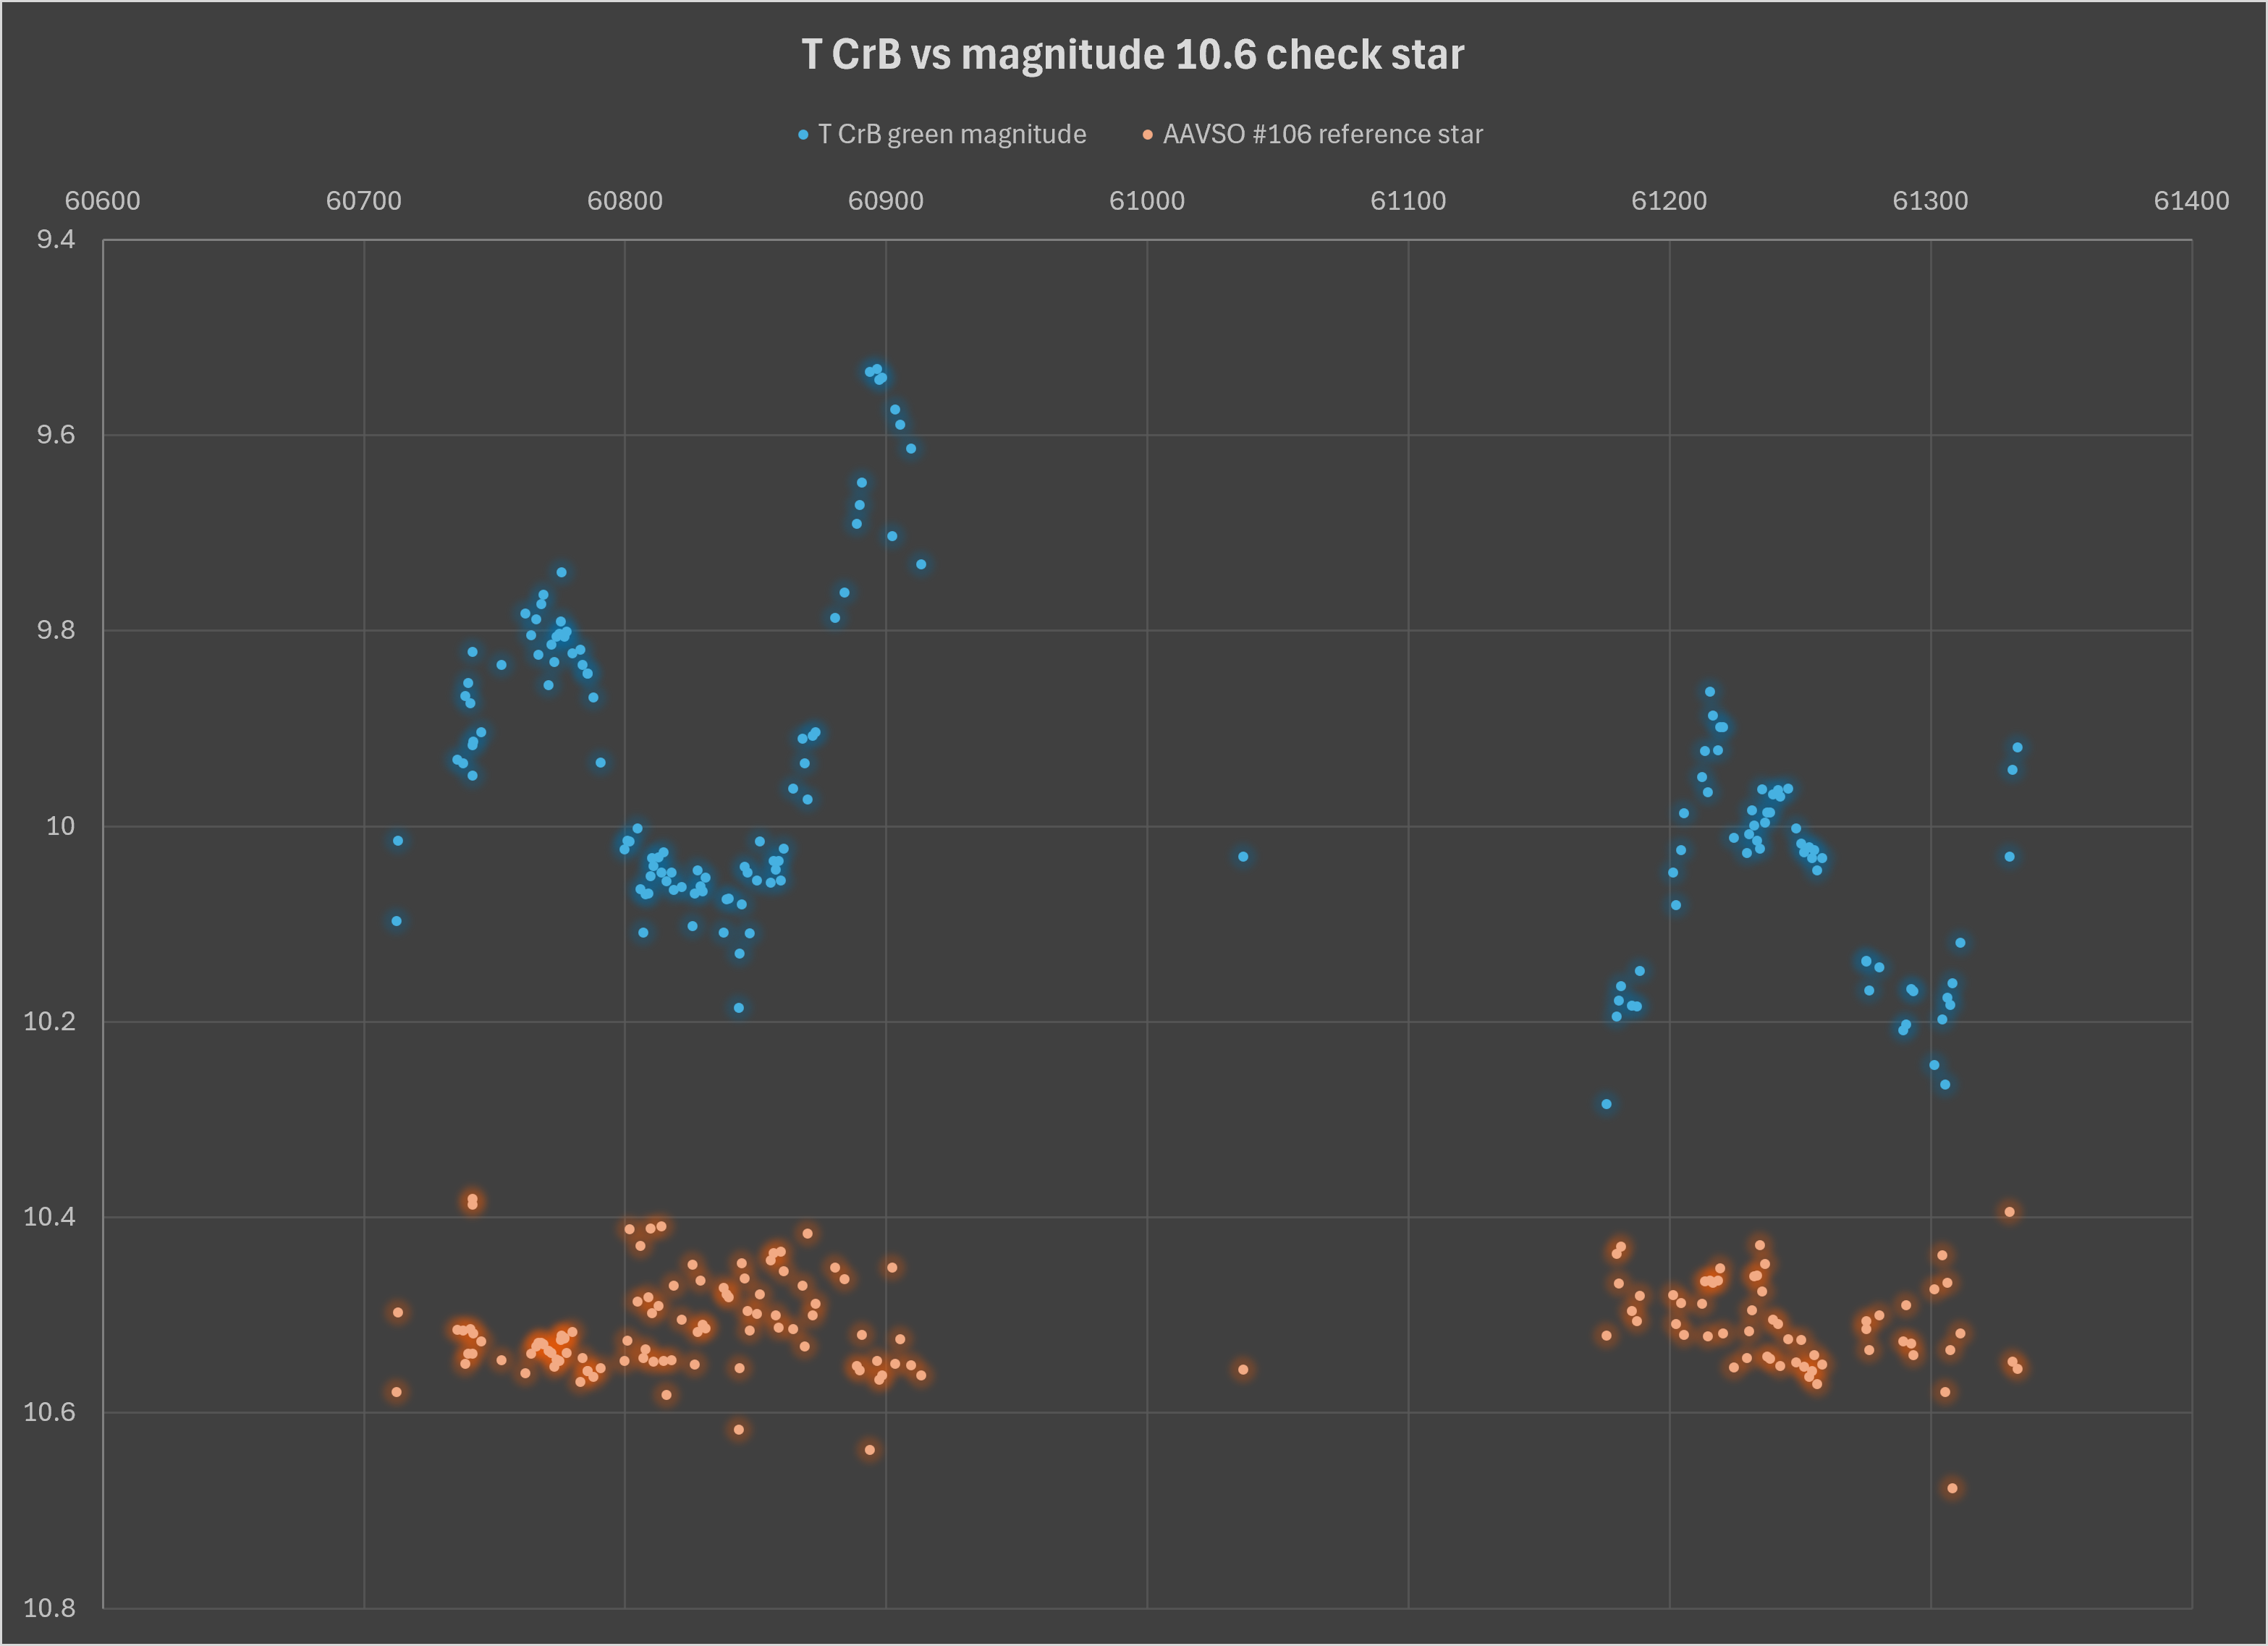
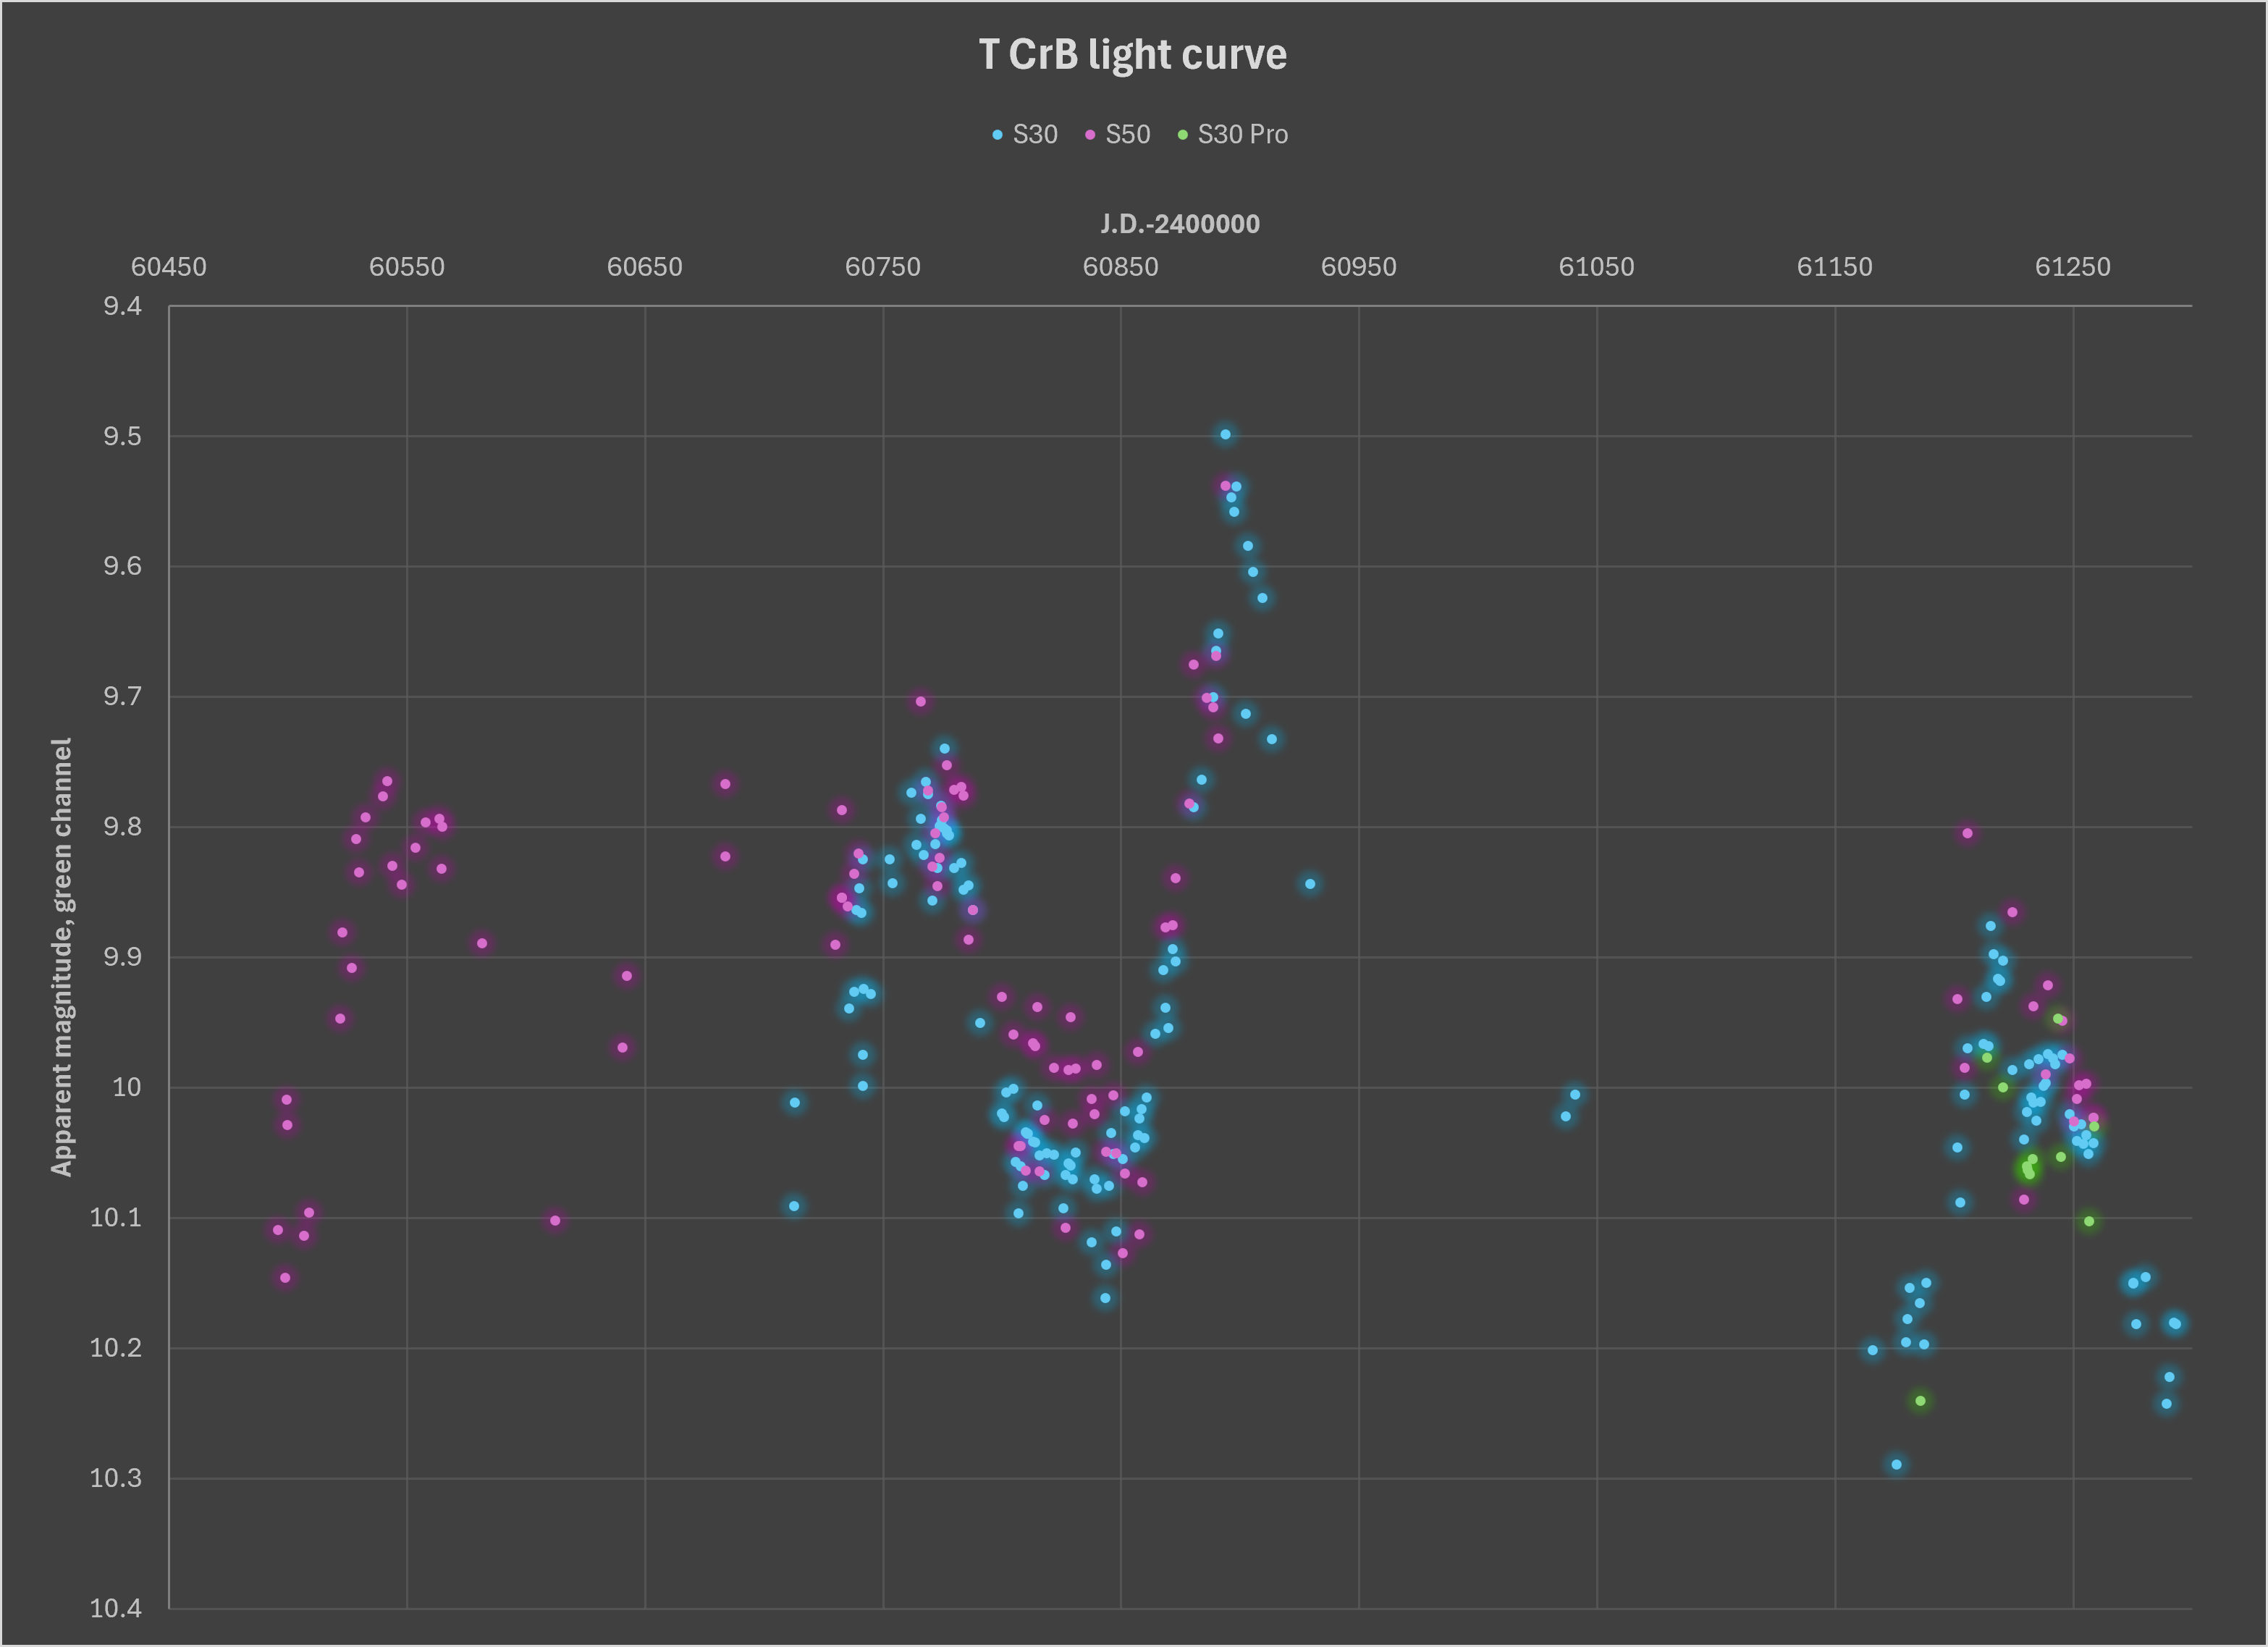
Steve KnightParticipantMultiple Seestar T CrB light curve beginning July 4th 2024. This curve is derived from 397,667 (ish) exposures up to September 9th 2026. There are 264 data points here each derived from a stack of as much of the night as I can manage. Processed with Pixinsight and differential photometry with AstroImageJ. Exposures are 2-30 sec. Now investigating how my green channel magnitude matches V magnitude.
Attachments:
Steve KnightParticipantHere’s an extremely processed stack of 731 video frames of the beginning of the total solar eclipse from 6 miles off of the coast of Greenland
You can clearly see Mare Serenitatis and Mare Tranquillitatis and if you squint Mare Crisium.
Frame rate was 50fps, ISO1600, 90D + FSQ55.
Attachments:
Steve KnightParticipantRidiculous. A cost saving of 2.8 millipercent of what we spend on debt interest a year. I’d contact the science minister but we don’t have one any more.
Steve KnightParticipantAsteroidal motion from 22.06 to 23.06 UT on June 26th. x110 30 sec exposures with Seestar S30 Pro.
Steve KnightParticipantWelcome Sonia!
Steve KnightParticipantThink I have found the cause of my problem.
Three seeing profiles attached for T CrB with S30.
Stack from February 2025.
Stack from April 2026.
Single sub from April 2026.Looks to me like ZWO have screwed up their stacking algorithm, the April
2026 stack has saturated, 16 bits so maximum ADU is 65,535.Note the peak ADU for the stack from Feb 2025 is similar to a single
sub from April 2026.So the good news is that my data might be recoverable, the bad news is
that I am going to spend a lot of time stacking subs in an external
program.Stop press, in La Palma, ran S30 on T CrB overnight, 2,134 10 sec subs,
again stack is saturated, individual subs look OK.Steve KnightParticipantThe effect is even more obvious on my S30 data.
Attachments:
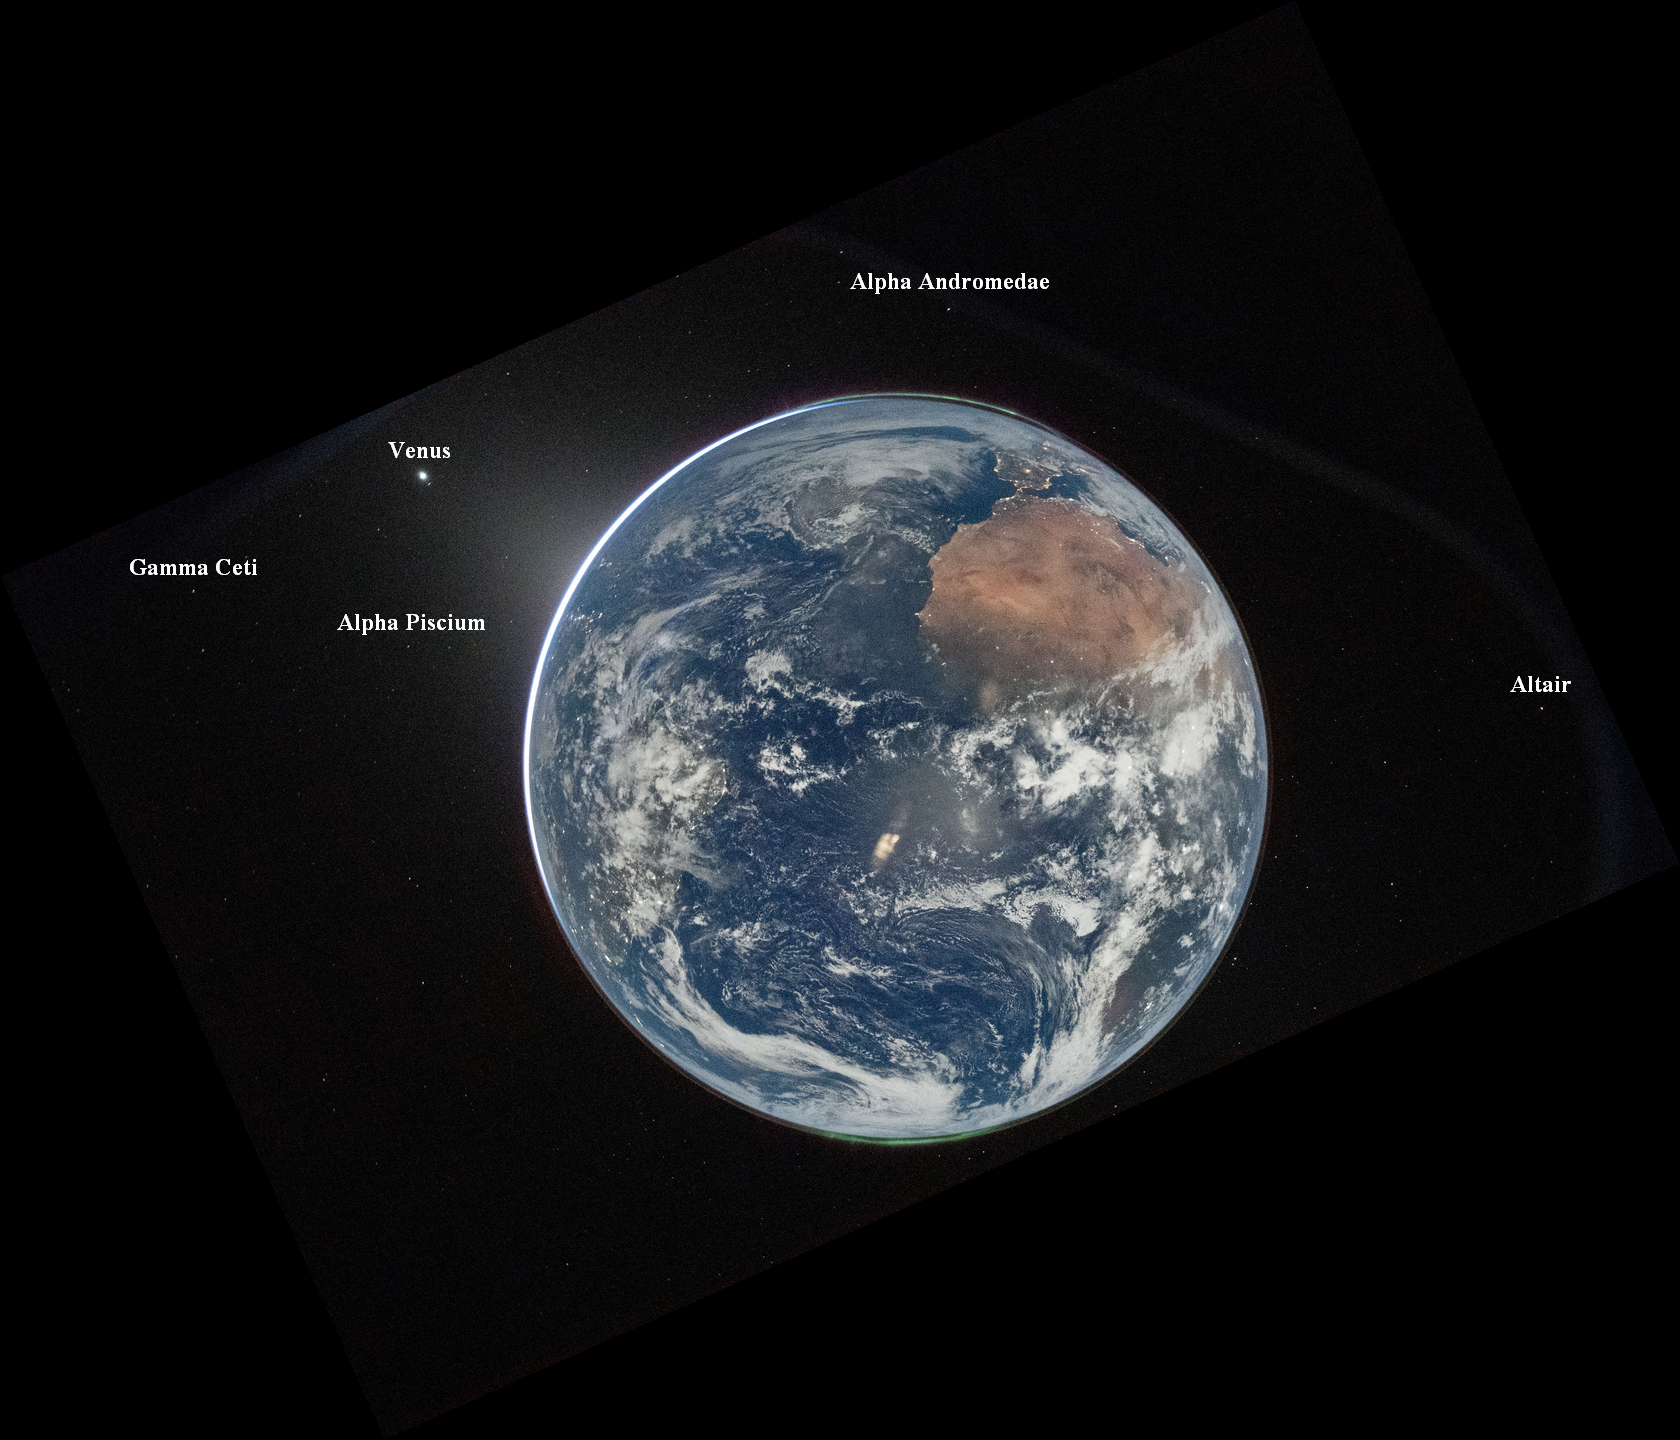
Steve KnightParticipantSteve KnightParticipantI think that is Venus. Rotated image so north is at top and tried matching objects. Alas Mercury seems to be behind our planet.
Attachments:
Steve KnightParticipantIncredible image by Reid Wiseman of moonlit Earth after TLI burn. South at top (of course). Aurora and Zodiacal light visible. Is that Venus bottom right?
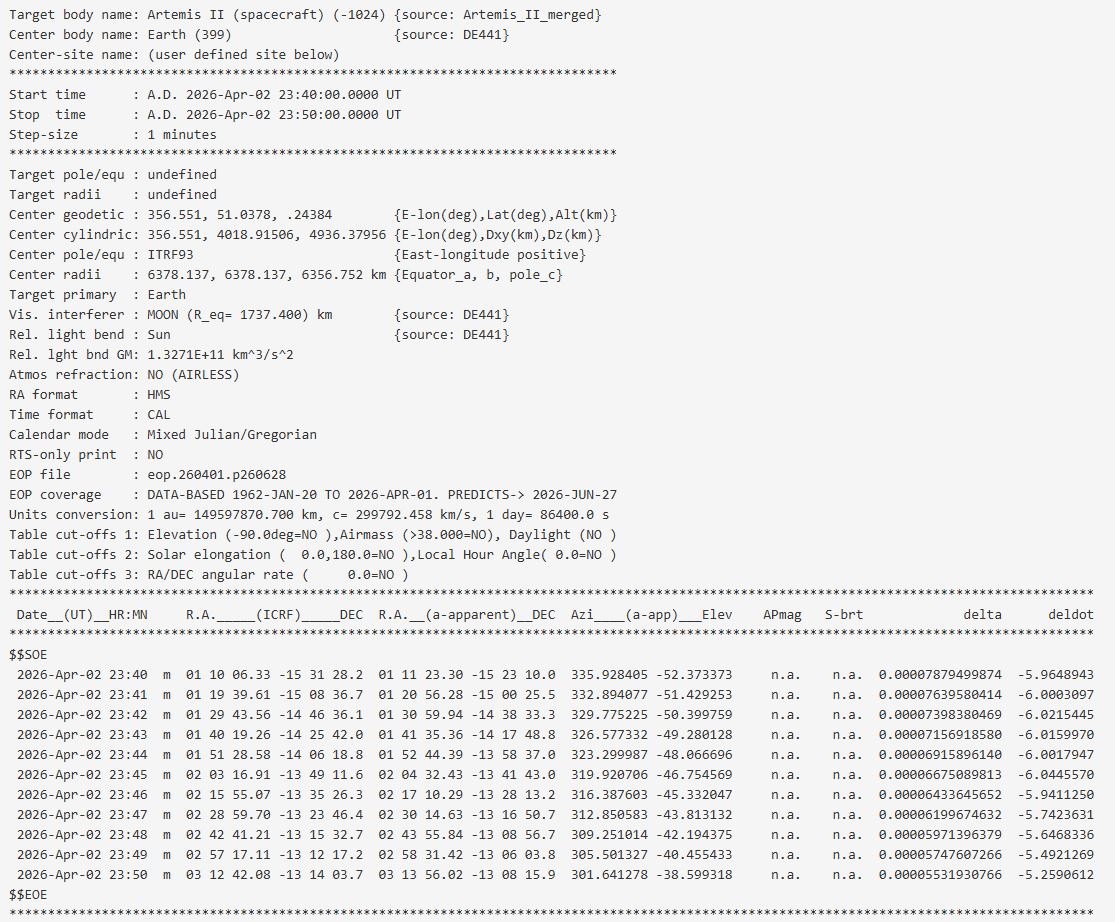
Steve KnightParticipantCopy that Nick! Situation now nominalish, duhh, I was looking at rise time of RA and Dec when burn started and finished. Can you pull out of the Ephemeris when Artemis in Earths shadow?
-
This reply was modified 7 months, 1 week ago by Steve Knight.
Steve KnightParticipantHelp required. When I use Horizons to generate RA and Dec for the 23.43 UT TLI burn RA and Dec are 49 degrees below horizon with it rising 10 hours later. I am obviously doing something stupid. I just don’t know what!
Attachments:
Steve KnightParticipantI echo Pauline’s comments about Allan’s amazing talks at the Newbury Astronomical Society’s Christmas Dinners. I often drove him and Rachel back to their home in Oxford afterwards. A second lecture on the A34 was a second highlight for me. RIP Allan.
Attachments:
Steve KnightParticipantAre occasional mobile smart telescope users allowed to participate? 152 nights (41.6%), best month May (24), worst February (4).
-
This reply was modified 2 weeks, 2 days ago by
-
AuthorPosts