Forum Replies Created
-
AuthorPosts
-
 Bill WardParticipant
Hi,
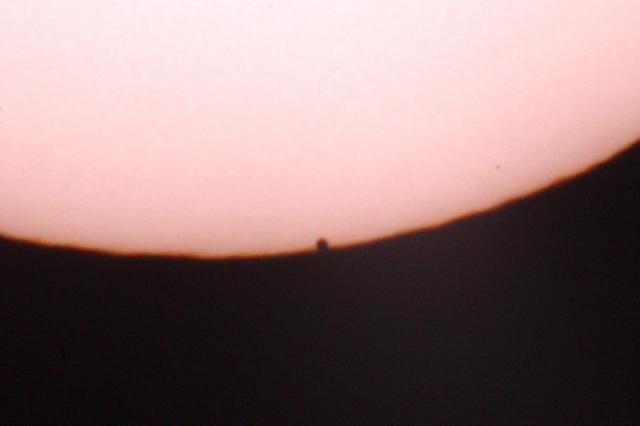
The spot that I imaged on the limb a few days ago has turned out to be the classic sunspot…
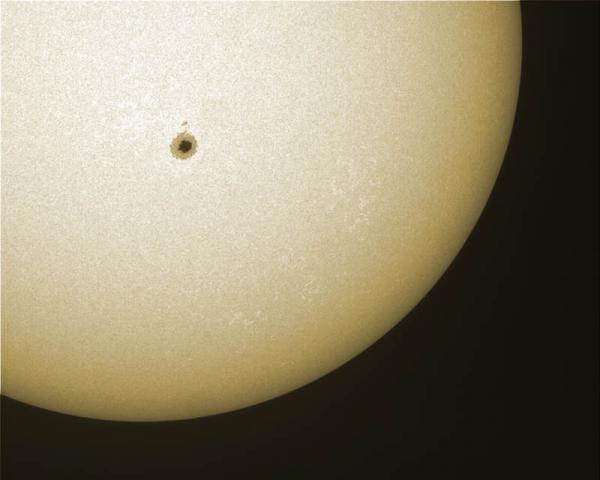
Image is a stack of 100 images processed in Registax 6. Taken 15.47UT today 21/5/16. Hopefully get a few more shots tomorrow if the weather cooperates.
A bit of pixel counting yields a spot diameter of around 47600km, ~3.7 times the diameter of the Earth.
… the Earth would sit nicely within the umbra!
Cheers,
Bill.
Bill WardParticipantHi Andy,
Thanks, but its all in the image processing… 😉
I am quite please with how it’s performed though. Certainly planning on keeping it in place for a while.
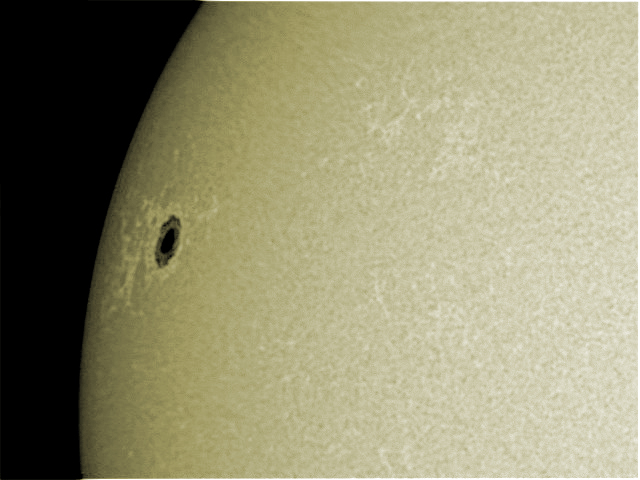
The single spot image shows the Wilson effect quite nicely but I think I went a little overboard with the wavelet processing with the faculae image, it’s a bit “speckley”.
Although not as narrow as a proper Ca filter I am quite impressed that it can show the faculae well and possibly some of the super granulation of the chromospheric network.
It’s quite a paradox that I’ve got virtually nothing when I’ve actually tried it on the comets I’ve been able to see but it turns out to be great for solar observing!
cheers,
Bill.
Bill WardParticipantAnother sunny day!
So another test session with the 390nm filter…
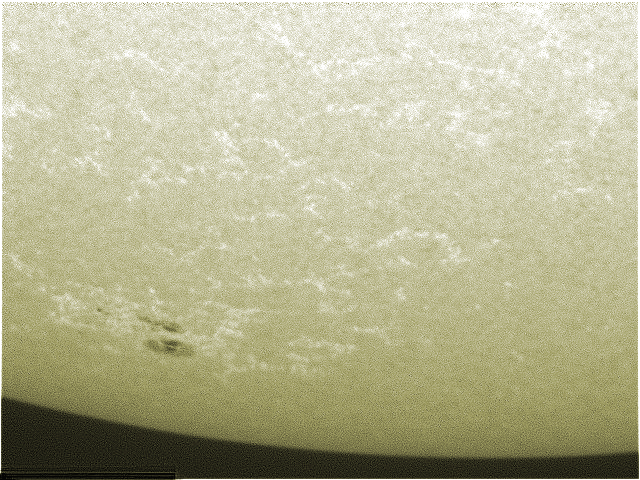
Gorgeous faculae. (Note image is of w limb but rotated by 90 degrees.)
and a nice big spot coming round the limb…
cheers,
Bill.
Bill WardParticipantHi,
Wall to wall sunshine and 24C, I could hardly believe it!
Here are a couple of images I took in the evening.
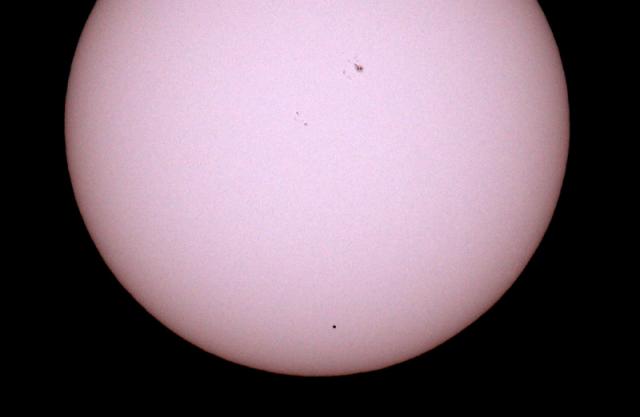
after so many washouts over the years nice to finally see one end to end.
cheers,
Bill.
Bill WardParticipantHi,
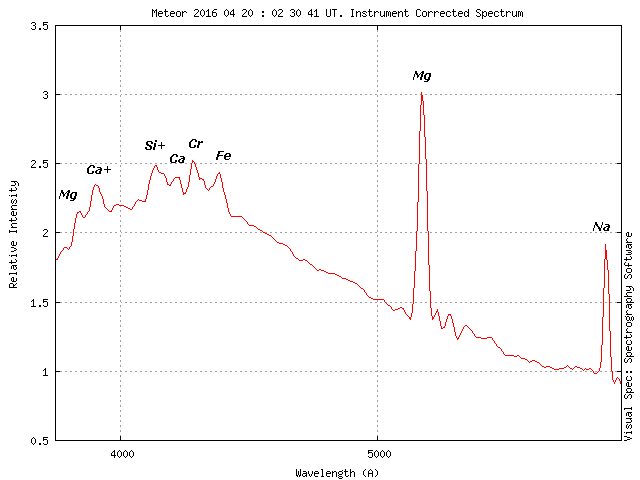
Normally I don’t do the correction as theres not that much to be gained data wise at these resolutuions. However this time the size of the Mg line was immense.
I wanted to see if it would still be “higher” than the other metal lines in the blue after correction. Mostly this isn’t the case as a lot of the emissions from the meteors are in the blue but look faint due to the sensitivty issues discussed further back. I just divided the whole spectrum by a Vega spectrum and lo and behold the big Mg line was still the highest peaking line. This meteor may have looked pretty green if it had been seen visually.
cheers,
Bill.
Bill WardParticipantHi,
That’s a terrific piece of work. A dramatic demonstration of stellar spectroscopy.
You mention the long exposures, working at mag +13 what length were they? I’ve built several fairly crude spectroscopes over the years but I was drooling over the multitude of very neat commercial devices that were on show at the Astrofest! I’m tempted to put one on my C9.25….
cheers,
Bill.
Bill WardParticipantHi,
The weather’s been pretty poor here but there were a few breaks over the Lyrid period. I caught a nice spectrum that had, once again, some unusal characteritics. (It’s beginning to look like they’re ALL unusual … 😉 )
This is an instrument corrected spectrum so the blue end is raised to address the loss of sensitivity at the blue of the silicon sensors. It’s not particularly detailed but it shows relatively “weaker” Fe lines than many of the other spectra captured over the past year. However the Mg line(s) at 517nm is seen to be very strong.
Again, luck was on our side and several of the Nemetoders caputured the same meteor. Alex Pratt ran the observations thorugh the UFO Anaylser and UFO Orbit and this yielded a most unusual orbit. This is by far the most “cometary” sporadic meteor I’ve caught that there’s also an orbit for.
Another outstanding result!.
Cheers,
Bill.
Bill WardParticipantHi,
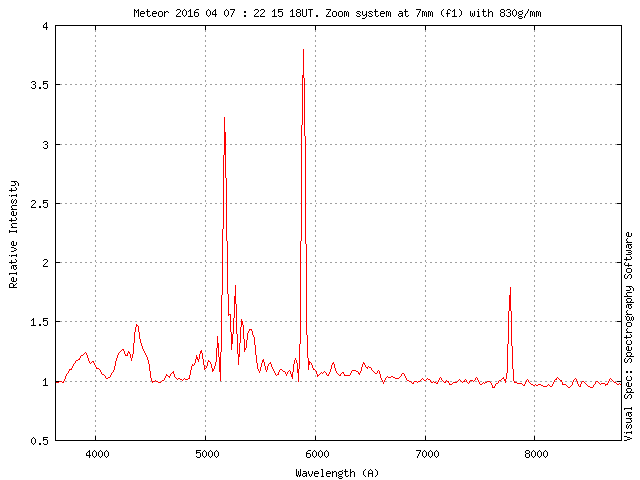
To try and increase the number of spectra captured I’ve been doing some tests with a zoom lens (3.5mm – 8mm f1) set at around 7mm. The lenses of this type I have are designed for 1/3 inch chips. When operated towards the longer focal length setting, offer full coverage of the Watec 1/2 inch chips. By viewing the screen whilst adjusting the focal length and focus I checked when the image looked just about fully illuminated.
The weather has been lousy of late but I did catch one good spectrum to at least check the system and make some comparisons. This was using a 830g/mm fused silica uv grating. The other longer lines are the spectrum of the compact fluorescent tube light in my kitchen 😉
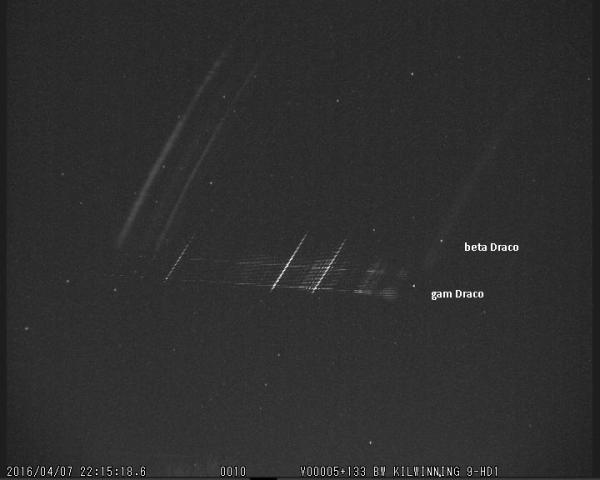
This is the spectrum image with a few stars id’d for magnitude comparisons with a 12mm image.
Looks not too bad. The dispersion is ~1.45nm/pix. Here’e the spectrum…
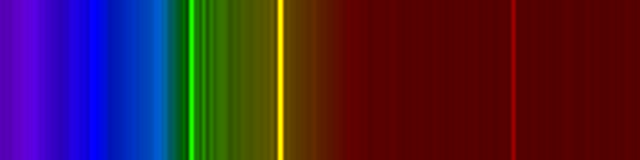
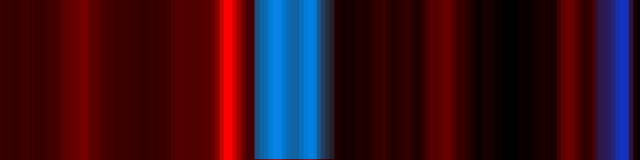
…and the a synthetic colourised version…
Examining the graph, it can be seen that the blue focus is quite poor, that might be tweakable but I’ll need to experiment. However there are a couple of distinct (if broadened) features in the blue. Probably ionised calcium and a sequence of strong Fe lines.
By coincidence I caught the very same meteor with a 12mm f0.8 system. It is strongly foreshortened and there are definite optical disortions right at the edge of the fov but I’ve marked Arcturus for another magnitude reference. My 12mm systems give about 1.2nm/pix dispersion by comparison.
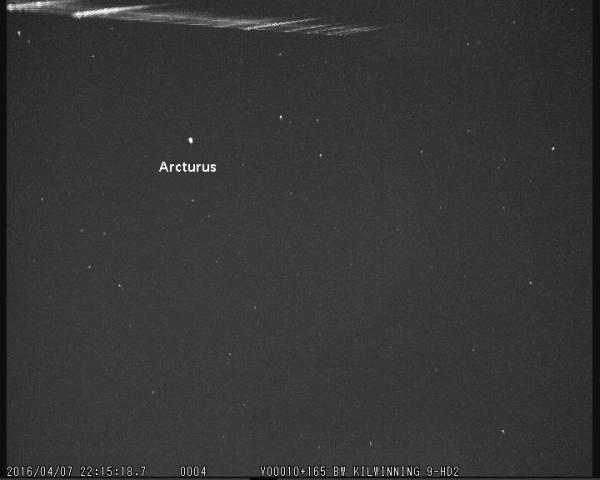
Roughly speaking the wider fov “see’s” about three times the area of sky but still has sufficient aperture to allow a good limiting magnitude for astrometry. I’m quite pleased with this. However the 7mm system is definitley missing the longer IR lines. The cameras are very sensitive to these wavelengths so there might be some vignetting going on. Need some more results to verify this.
I wasn’t sure how a low cost zoom lens would stack up but on the whole I think it’s pretty good. Time will tell…
cheers,
Bill.
Bill WardParticipantHi,
When you look at the sensor can you see a blue-green coloured piece of glass mounted directly on top of the sensor? This is often seen on a lot of colour cctv type cameras.
If so, then this will be an IR cut filter so no additional filter should be needed.
The answer to your second question is no provided it really is just plain glass. “plain glass” will transmit most of the IR light in the range that silicon based sensors work. Most IR cut filters are this blue green colour I mentioned to simulated a broadly similar photopic eye response on a bare Si sensor. For example a Schott BG18 or maybe a broader pass Schott KG1 or equivalent.
cheers,
Bill.
Bill WardParticipantHi,
Whilst reviewing the video’s from the last clear night I noticed one, that whilst not quite in the fading class, did appear somewhat unusual.
It looked like it was varying throughout it’s trajectory. Having watched the video several times I was convinced it was a real effect.
However when using the usual slice function all of the scan line artifacts pollute the image…
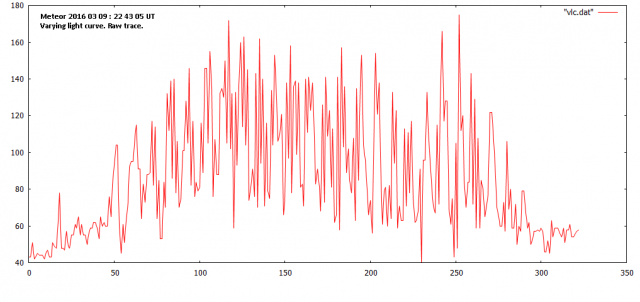
Not very pretty. But doing the Bezier smoothing on the graph reveals the effect quite clearly…
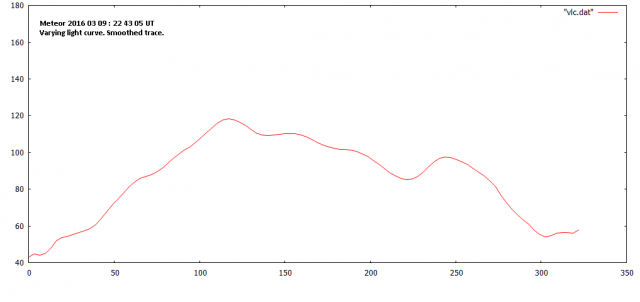
Working with the other meteor observers in the NEMETODE group has turned up quite a few double peaked meteor but I’ve never seen a meteor with this number of “peaks”. There are five definite “peaks” (and possibly another very weak one but the smoothing might be playing tricks here.)
Another interesting capture.
cheers,
Bill.
Bill WardParticipantAnother increment in dispersion ~.4nm/pix BUT this is a purely speculative version. That is, I’ve just assumed a couple of lines and knocked up this colourised version for illustration purposes only. I can’t get any lines to fit this no matter what I do!

I’ve circulated the original image to the Nemetode group to see if fresh eyes can help however this is a beautifully dispersed spectrum and at the moment it’s completely unknown.
The wavelengths could also be running in the opposite direction. I’ve tried that too and still no joy. It is VERY frustrating. If any one wants a challenge contact me and I’ll be happy supply the orginal .bmp image produced by UFO capture. It’ll save me tearing any more hair out 😉 !
cheers,
Bill.
PS. Just for the record. I’ve edited this post and reversed the colourisation. IF the meteor ran as thought the wavelengths would run as the new graphic shows. Short wavelength on the left to longer wavelength on the right.
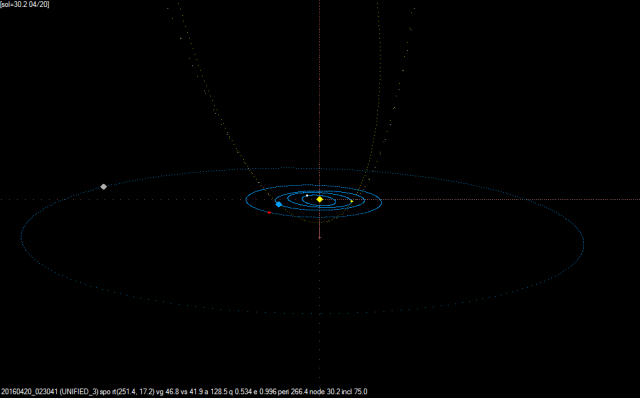
Bill WardParticipant…and the orbit is equally interesting…
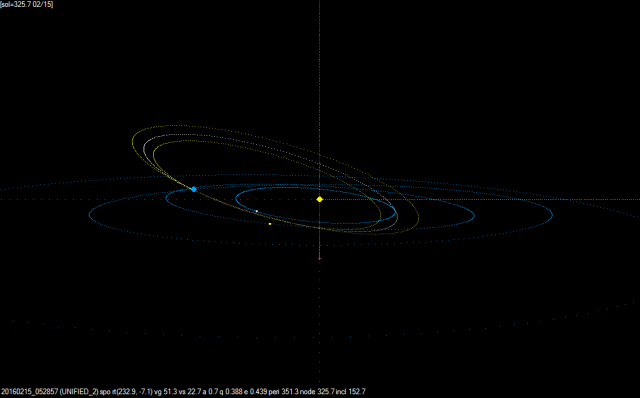
A high inclination making the orbit retrograde. So, the meteoroid hit the Earth in a head on direction resulting in a speedy sporadic.
Thanks to Alex Pratt (of Nemetode) for checking my initial plot and giving it a tweak.
cheers,
Bill.
Bill WardParticipantHi,
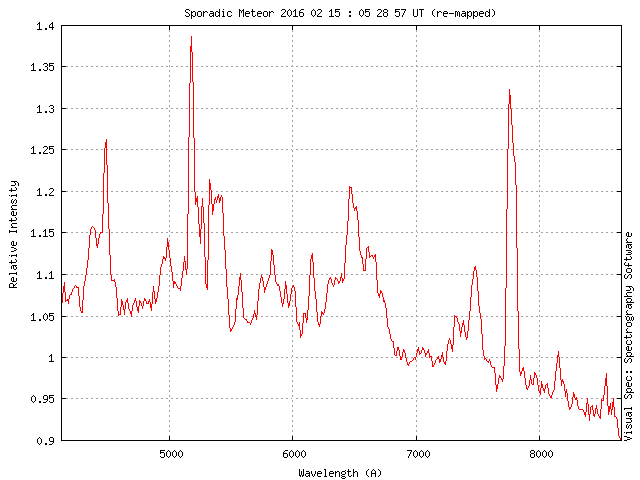
The sky has a never ending supply of surprises! Got two spectra over the night of 14/15 Feb. The first didn’t produce anything useful but the second was quite intriguing…
Took quite a bit of time to get the lines to fit what I think is the correct configuration but part of the problem was that it just didn’t look right. Not very scientific but it is surprising how quickly the brain starts to recognise patterns and this one looked odd.
After doing further geometric corrections to flatten the spectrum as best I could (it had rather a poor dispersion angle at the edge of the fov, never a good combination 😉 ) it twigged what I was seeing.
This particular meteor is VERY sodium deficient. There is much in the literature about sodium deficient meteors but this is only the second time I’s seen no sodium. Unlike the first, further back up the postings, this has other rocky minerals like Si and Mg though. There is a weak line at the Na emission, ~589nm, but this may not be sodium. Many of the small little peaks over the spectrum are processing artifacts from the re-orientation and de-slanting of the spectrum image prior to binning. This is what I term a “noisy spectrum”. However there is definitely no prominent Na line like most of the other spectra I’ve posted here.
Another interesting result from the meteor spectroscopy survey world…
Thanks to the Nemetode guys there are other observations of this meteor so I’m hoping I’ll be able to get an orbit. William S. did get a Q1 orbit for the other spectrum as there were a couple of other stations that picked it up sadly nothing viable from my end. However if an orbit can be derived for the sodium deficient meteor then that will be an even better result. 🙂
Cheers,
Bill.
Bill WardParticipantHi,
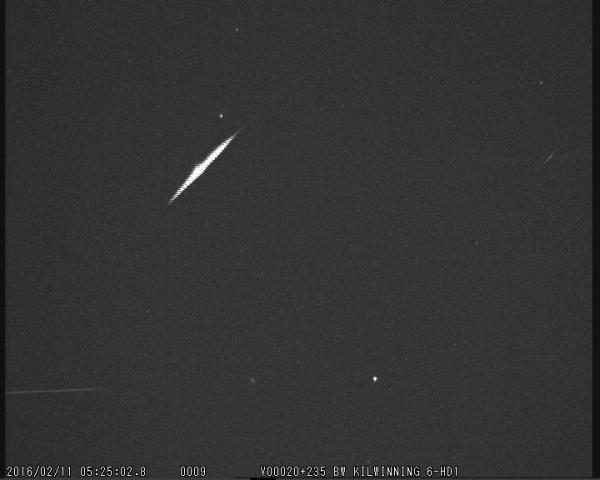
As promised… Captured another “slow fade” meteor and also another bright meteor to compare it to.
These were both caught with the same camera system on the same calendar day. (One was from the morning and the other early evening.)
Fading meteor composite image.
Fading meteor light curve
.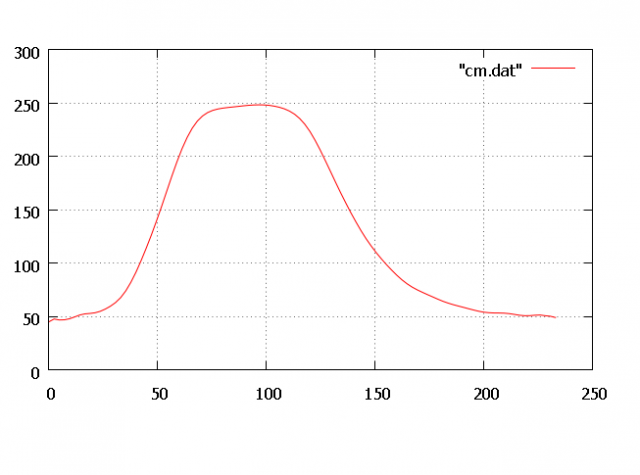
Comparison meteor composite image.
Comparison meteor light curve.
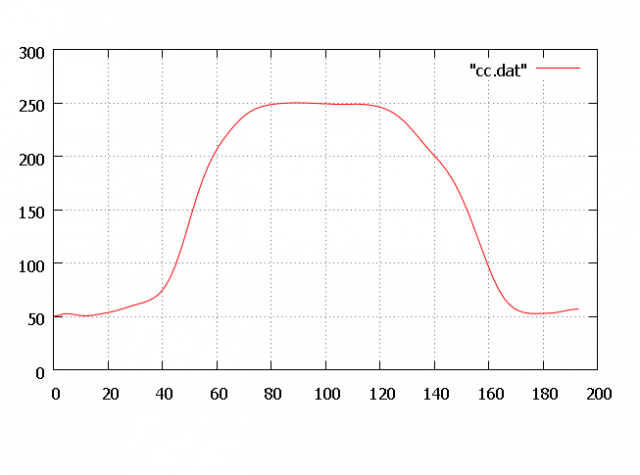
By using the slice function in IRIS smoothed curves were plotted showing the light curves.
Axes are simply x:pixel and y:rel intensity
It can be seen the onset is very similar, then the mechanics come into play. The ablation characteristics change and the meteors “burn out” quite differently.
The graphs show the more rapid decline of the comparison and the slower decline of the fading meteor, nice to see a measureable difference.
cheers,
Bill.
Bill WardParticipantHi,
Here’s a light curve generated from the latest “melting meteor”.
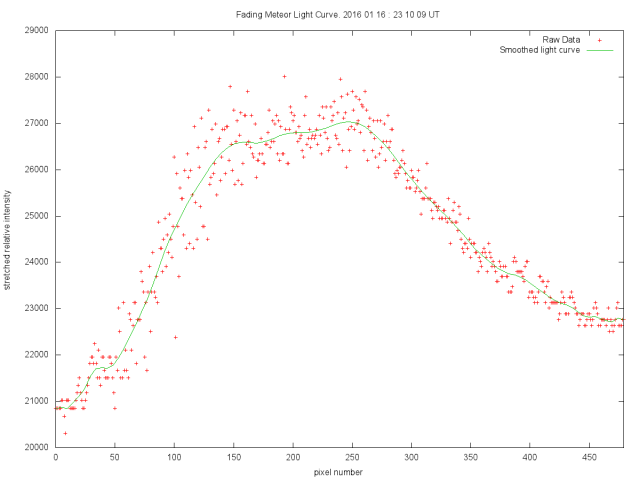
Interesting to compare this one to the one above. Maybe I should have drawn a longer “tail” on this one to make the comparison more direct. However one can see the same gentle tail off of light as the meteor disintegrates.
I’ll need to dig out some comparable brightness “regular” meteors to show how they have a steeper fall of of light, it’s on the to-do list… 😉
cheers,
Bill.
Bill WardParticipantHi,
Caught yet another “melting meteor”. These are definitley a subclass of meteoroid. The “fluffy dustballs”!
https://www.youtube.com/watch?v=eppOe5sJymk
Cheers
Bill.
Bill WardParticipantHi Andy,
Thanks for the comments and yes I read your spectroscopy thoughts. From my persepctive the answer is yes! In fact I’ve already had some communication with William Stewart of the nemetode group about this. Although this was specifically about meteors.
I’m really pleased that several other observers have now set up meteor spectroscopy systems.
In 7+ years I’m getting close to my target of ~1nm resolution but this has taken continuous upgrades of lenses and gratings as they have become available.
The issue of resolution is important as it dictates what can be done with spectrum. With our low/med resolutions we can look at statistical methods of extracting info but that needs quite a large sample. Hence many more spectrum are needed. This is where a database would be useful but this is also where the various standards of data and reduction processes needs to be addressed. As you say it is also a BIG undertaking and getting the right people might not be easy. It’s quite a commitment to do this sort of thing.
As what I’ve christened “Survey Video Meteor Spectroscopy” is a brand new field it will take a bit more time for the various observers (and I still include myself here as there is lots to do) to find their feet then determine what and where is best to go. I’ve no doubt it’s do-able though!
Cheers,
Bill.
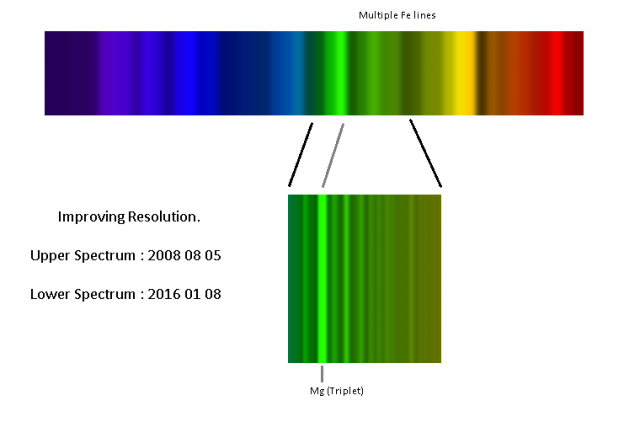
Bill WardParticipantStep by step we progress…
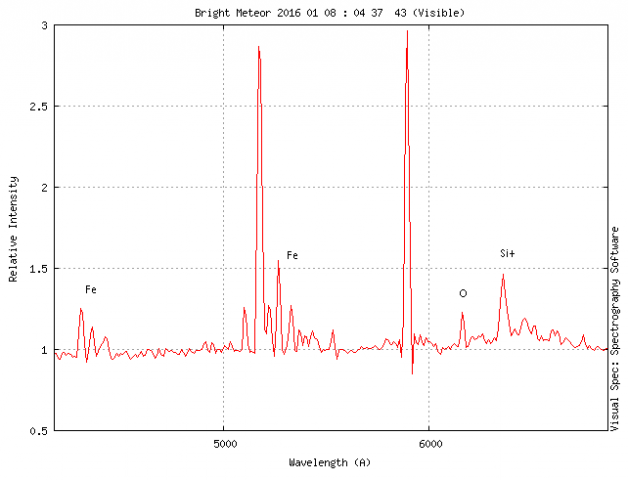
I caught a nice bright meteor on the morning of the 8th Jan 2016. However this time it was on one of the medium resolution set ups with the 830g/mm grating. Whilst this gives sub nm/pix dispersion it’s not quite down to my target of 1nm resolution but I’m getting closer and closer! Below is the graph and a colourised version.
The lines are nicely resovled, with the usual suspects present.

The spectrum did extend up to the near IR but due to it passing through the text at the bottom of the video fov I had to split it to eliminate the artifacts caused by the text. Here’s the IR part. This graphs looks a little more “chunky” than the visible due to the focus. The spectrum is focussed on the visible part and the IR is a little defocused as a consequence.
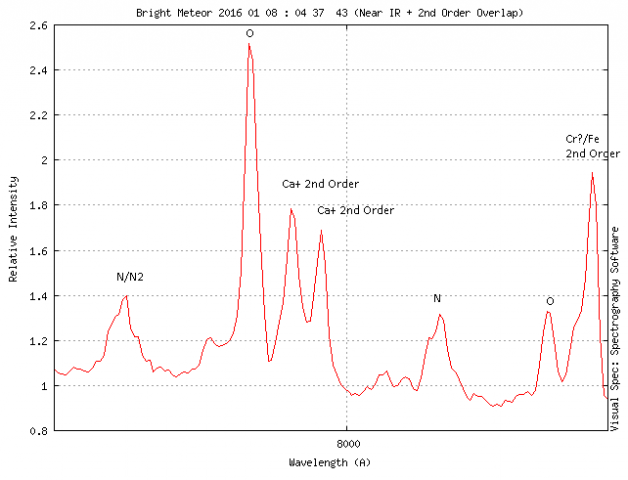
At first it was a bit confusing as to what the “extra” lines were. (The lines have been colourised deep red as they would of course be invisible other wise!) These turned out to be bright lines from the 2nd order overlapping the 1st order. This is a problem with gratings and it only gets worse as ones goes to higher line counts and higher orders. (One benefit from the 2nd order is that the dispersion is twice that of the 1st though.)
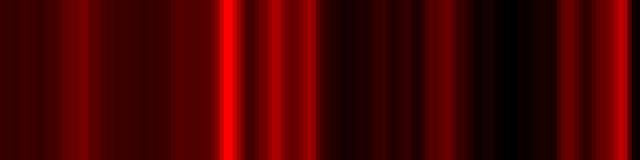
By measuring the wavelengths and comparing the differences in these wavelengths its possible to approximate the first order value and hence what the lines are. From the graph it can be seen what I’ve tentatively identified these to be. If one could actually “see” both the near IR and the near UV lines it might look something like this instead…
Cheers,
Bill.
Bill WardParticipantHi,
Things just got interesting again…!
One of the other NEMETODE observers, Allen Carter, now runs a system identical to mine (A Watec 910/12mm f0.8/600g/mm) and managed to catch a couple of spectra from the peak of the Quadrantids. Allen kindly sent me his images to analyse and the results are great.
Last year seemed to indicate a very distinctive spectrum for the QUA meteoroids. My spectra were quite conclusive on the composition but being a single station there was the possiblity of mis-identifying a weaker Dec Alpha Draconid stream as a QUA.
There seems little doubt now that the QUA’s are “sodium deficient” cf magnesium. What this means has to do with the parent body and it’s possible origin and orbit. That’s now a whole new story to be explored…
Here is one of my spectra from last year.
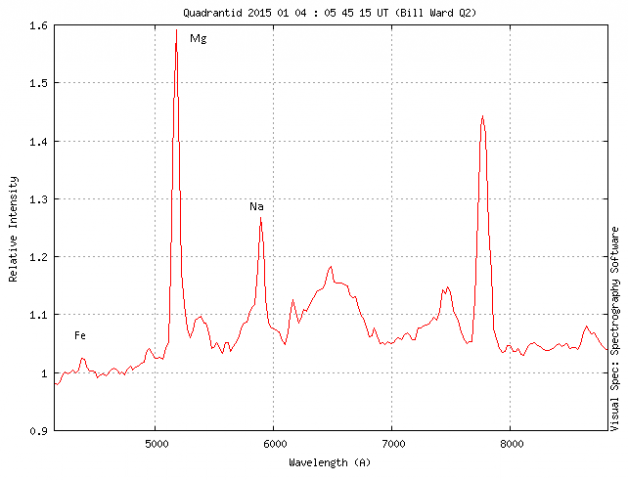
and here is Allens from this year (basically yesterday, at date of posting!)
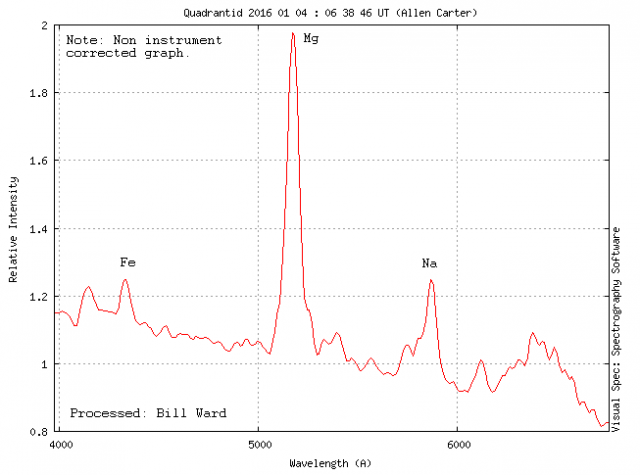
I’ve added the main lines for comparison. Mine caught a little more in the near IR so has a longer wavelength span but it is clear the blue/green regions are almost identical. Importantly both having a large Mg peak.
There may be wavelength resolution limits which has some impact on line ID with video work but I think this is an excellent example of the utility now to be had from meteor spectroscopy on conducting comparative analysis (just like my STA examples). The key issue is that unlike imaging, spectroscopic observations can be directly compared station to station essentially without ambiguity.
RESULT!
Thanks to Allen Carter (and other Nemetode stations) for his support in providing his observations to me.
Now all we need are some spectra of the Dec Alpha Draconids to be able to compare stream to stream!
cheers,
Bill.
Bill WardParticipantHi,
Thanks for the paper info. It’s an interesting read. Jenniskens makes reference to the same object in his book Meteor Showers and their parent bodies. He ends the section on the Quadrantids with the same sentiment, that it’s not quite a done deal yet.
Yes, I’m very pleased that after a little evangelising 😉 others have joined in the new pursuit of “Survey Video Meteor Spectroscopy”. It’s taken me 7 years to refine the system but I think its now gone from novelty to utility and that’s great. It is indeed a powerful tool and who knows what it will turn up in the coming years. The regular showers are interesting enough BUT its the sporadic population where I believe the real surprises will be.
I think I mentioned “family groups” elsewhere and I’m pretty sure I’ve started to see this. Initally three spectra caught my eye. These were all from different observers over several years. That has now gone up to six sporadics with very similar properties so theres something going on!
cheers,
Bill.
-
AuthorPosts