Forum Replies Created
-
AuthorPosts
-
 Bill WardParticipant
After a siginificant amount of preparation (which can often be set to naught, especially in my part of the world!) the Lyrids delivered the most remarkable spectroscopy results I have had in some time.
Here are a few more graphs etc.


My ideas about comparative spectroscopy seem to be valid!
I can feel another paper coming on…
Cheers,
Bill.
Bill WardParticipantBeen doing some research….
It would appear the “melting” or “dissolving” meteors might be classed as the extreme end of the “dustball” meteors. It is remarkable to consider that given the initial small particle size the meteoroid crumbles to an extremely large collection of even smaller particles. Maybe >mm to micron size before evaporation is complete. What seems a bit of a paradox to me, however, is the textbooks imply that this disintegration speeds up the evaporation due to the smaller particles. That is bigger surface area more rapid ablation. But I think it can be seen that is not what happens in the video. The more robust particle, marked as normal, pops into and out of existance much more rapidly than the dissolving one. Even considering a single tiny particle after initial ablation, the video still gives the impression of a much slower demise. …AND on top of that the theory also seems to be that the meteor should also be brighter, that too doesn’t seem to be the case!
The splitting ones might be an intermediate case of the demise of a dustball. A particular case of unusual fragmentation. The same issues apply about speed and brightness I think and although some meteors are seen to fragment into distinct bits these all appear soft. For reference. Physics of meteor flight through the atmosphere by Opik (heavy duty and I don’t understand half of it! 😉 and Meteors comets and meteorites by Hawkins (much easier read and distillation of much of Opiks work). Both quite old texts now but fundamentals are sound. The problems then are still problems now!
I also reviewed a pile of older videos made using shorter focal length lenses and when one really looks closely there are actually quite a few of this type. The longer focal length lenses bring out the effects much more clearly.
So, enigmatic is actually an apt description!
These wonderful little cameras really are re-writing the rules!
cheers,
Bill.
Bill WardParticipantHi,
Thanks. Yes, there is definitely a complete spectrum (no pun intended!) of ablation characteristics.
Reviewing the videos from the other night I also caught a “normal” one on the same system. To show how the ablation differs I made up a comparison video.
It is here:
cheers,
Bill.
Bill WardParticipantThese “dissolving” meteors are proving to be fascinating…
In an attempt to better visualise the unusual ablation I’ve mounted 25mm lenses on a couple of cameras to give a larger image scale Unfortunately the corollary is a smaller field of view though ;-(
However caught this near perfect example of a melting meteor this morning.
The meteoroid must be fragmenting into a large number of extremely small particles to exhibit this behaviour. Even at this size they are still undergoing very rapid heating and evaporation. Just melting into the atmosphere!
cheers,
Bill.
Bill WardParticipantOne observation is an oddity but two is the discovery of a previously un-noted class of meteor behaviour!
Caught a second separating meteor this morning. Fascinating. Having viewed several hundred video’s there a a few suspicious ones but this and the previous are by far the most definite.
Bill WardParticipantHi Eric,
Appologies for the delay, did I ever reply….? Just checking the forum for the first time in a while. I’m afraid I have been out of the scene for a couple of months due to a horrific multiple fracture of my right arm. Bones sticking out in all directions, it was pretty gruesome! Needed several ops and I’m still in a cast!
However as an alternative source of information immediately the most excellent Nemetode website at
http://www.nemetode.org/analysis%20techniques.htm
have the technical notes here explaining just about everything!
Hope this helps.
Cheers,
Bill.
Bill WardParticipantHi,
Thanks, I initially wondered if this effect is what I have picked up in the more unusual spectra that show changes towards the end of flight.
…but perhaps not…I’ve been doing some crude velocity measurements and the separating part is travelling at more or less the same velocity (until burn out) as the pre separating meteor trail. So it looks like the meteoroid “sheds” some material, perhaps volatiles reaching a critical temperature and then taking some portion meteorid with it giving the little “puff” of stuff.
A spectrum would have been nice but it’s really nice to catch a new meteor ablation effect (unless anyone else has recorded it before…)
cheers,
Bill.
Bill WardParticipantThe fading meteors continue to be captured…
Got this last week. https://www.youtube.com/watch?v=YrxxiWbe40Q
First time I’ve seen this effect, most unusual.
cheers,
Bill.
Bill WardParticipantHad some really nice results recently. Got this nicely detailed spectrum a few nights ago. This one has strong O lines at 557.7nm and 615.6nm as well as several Si+ lines indicating a fairly speedy meteor!

It is worth remembering that the colouration is wavelength stretched and false, the spectrum actually spans from ~370nm to 780nm so, rather sadly, you’d never see it look so nice…
cheers,
Bill.
Bill WardParticipantRemarkable instruments, and, I suppose as an opto mechanical engineer myself I am highly biased but it demostrates clearly that whilst theoreticians may theorise, engineers make it happen! 😉
cheers,
Bill.
Bill WardParticipantHi,
Another interesting capture. Very complex with dispersion ~.5nm/pix. With the efforts of Alex and William of the Nemetode group it’s been tentatively identified as an October Camelopardalid.

The green magnesium line is very broad. Maybe seen as resolved if it hadn’t bloated as the terminal flare saturated.
Some broad similarities between this spectrum and the one in Post #41. Many Fe lines!
cheers,
Bill.
Bill WardParticipantHi,
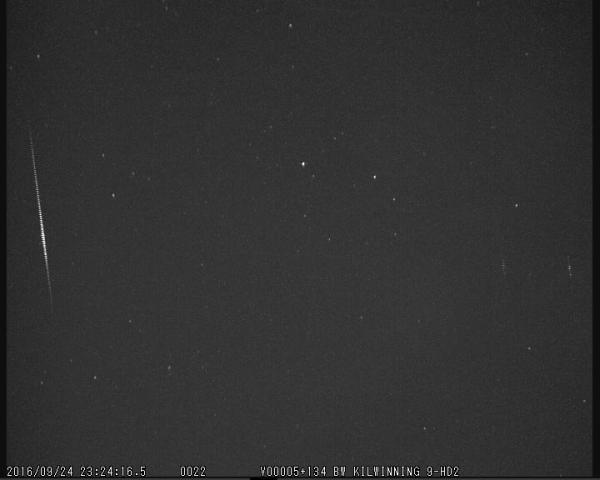
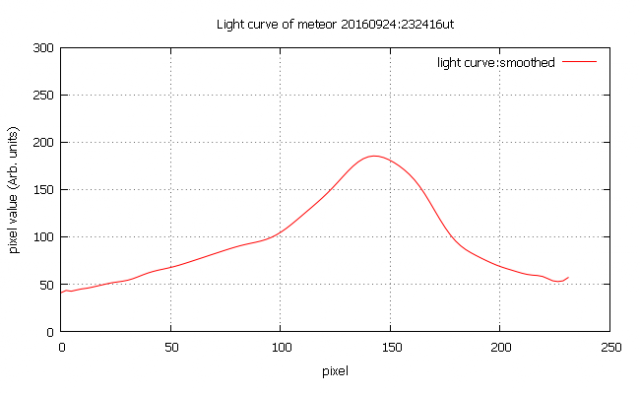
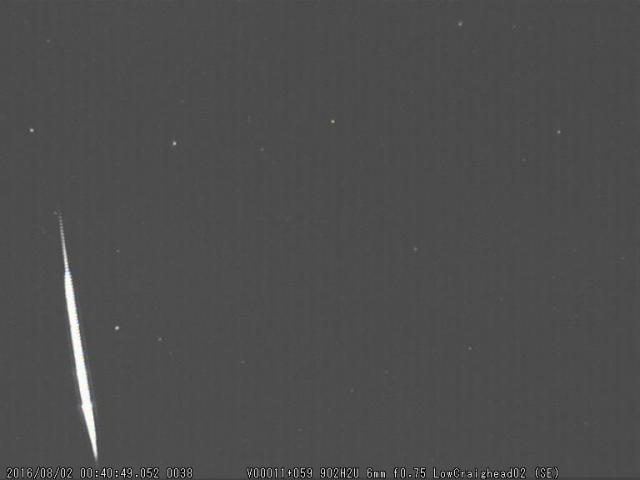
Here’s the light curve from meteor 20160924_232416 (and a spectrum). Light curve shows the distinct shape as illustrated in previous postings. Now just need more spectra to see if what the compositional traits are (orbits would be nice to see of it’s fluffy cometary stuff…)
Here’s the capture image that shows the zero order image plus weak spectrum.
…and the smoothed light curve with the distinctive looking tail off like the other example.
…also the spectra again, just in case…
it’s all good stuff… 😉
cheers,
Bill.
Bill WardParticipantHi All,
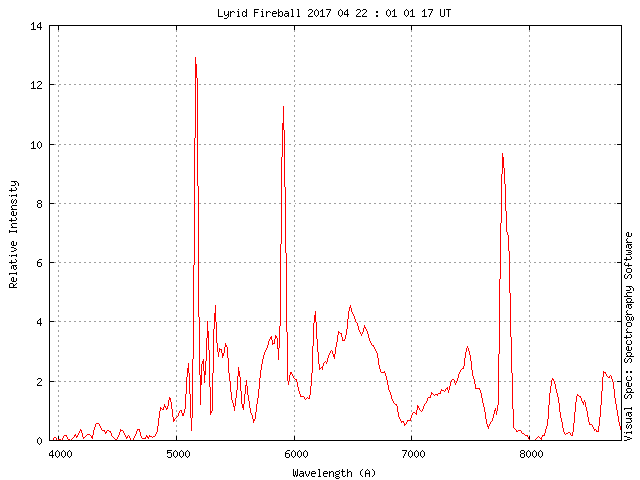
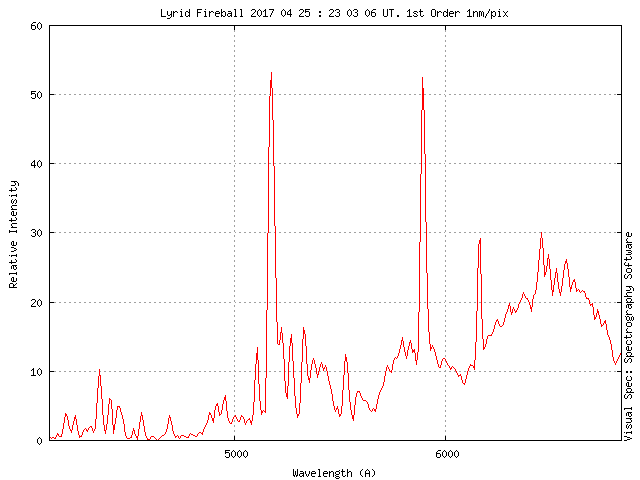
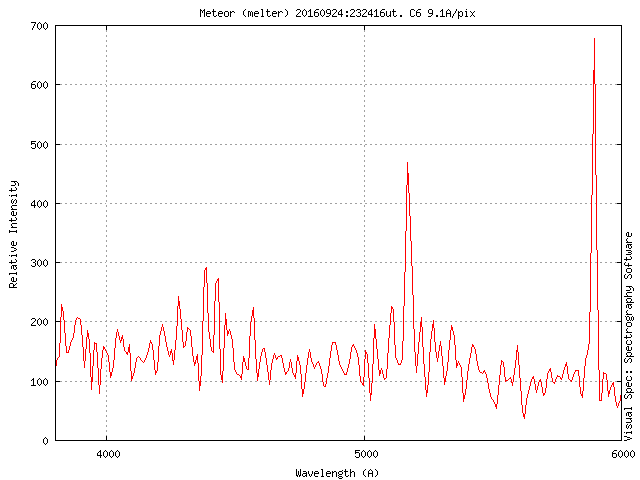
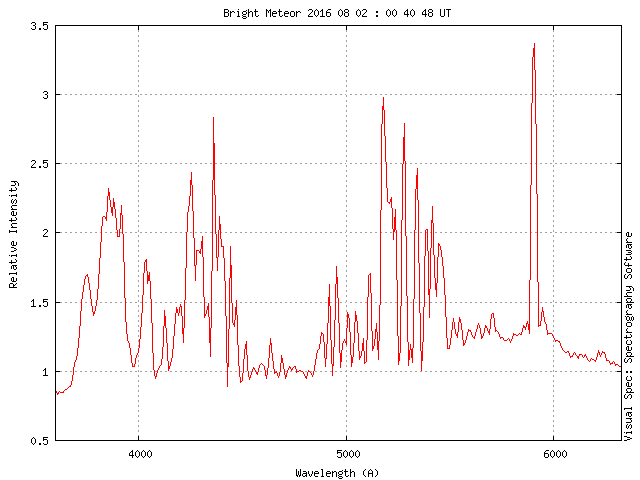
Been getting some interesting results recently but the other night I got a spectrum on 3 cameras of the same meteor! Only two were useable and even these were quite noisy. Meteor was maybe mag 0 – -1. (This might be more properly placed on the “Fading meteor” thread but as its about spectra… 😉 )
HOWEVER, this (or these) are the first spectrum I’ve got from a “melting” meteor. This one, like to others just faded out.
The graphs are very similar (as one would expect) but a few differences creep in from different resolution and processing artifacts.
The first graph is from a system with a 830l/mm grating.

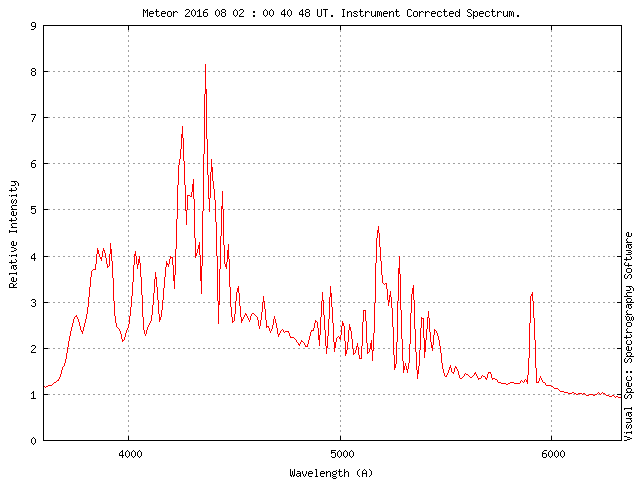
…and this from a 600l/mm grating.
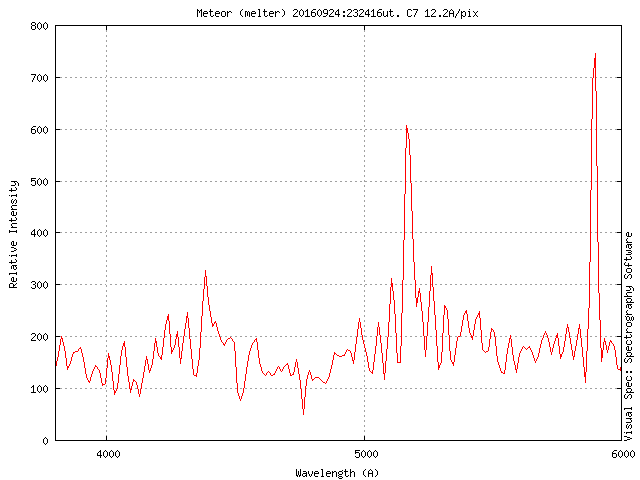
Careful review of the video reveals many of the lines are real but it is interetsing to note a large fraction are artifacts. I don’t know if the spectrum actually tell us anything new yet, but it’s a step on the way.
Need to graph the light curve now for the other forum thread…
Cheers,
Bill.
Bill WardParticipantHi,
The Perseids have been a washout both metaphorically and literally. A ton of rain came down on Thursday night.
However ever the optimist I watched the skies closely and after 48 hours of cloud and rain there was a mysterious clearance for around 20 minutes last night. Rain stopped, wind dropped to near zero and the sky cleared. So I deployed my camera rigs as quickly as possible and I managed to capture a few meteors and one spectrum. Unfortunately the spectrum was contaminated by both scattered light and some in frame clouds. However if was well dispersed and showed some really nice detail at the red end.
The direction indicated it was a perseid fireball but the spectrum had the tell-tale emission at 557.7nm typical of high speed meteors. What was interesting about this one was the detail in the atmospheric bands. Perseids are high speed meteors and they carry a lot of energy. This energy is available for excitation as the meteors kinetic energy is transformed into heat.
Slight diversion… in 2002 astronomers at the VLT caught a spectrum by chance using the FORS1 spectrograph. After removing the redshifted lines of the supernova the remaining lines were of the atmospheric emissions of O, O2, N, N2.
As this was a highly accurate instrument the line measurements are invaluable for calibrating meteor spectrum. I thought it would be interesting to compare the results of a multi-million euro instrument against my 500 quid system…
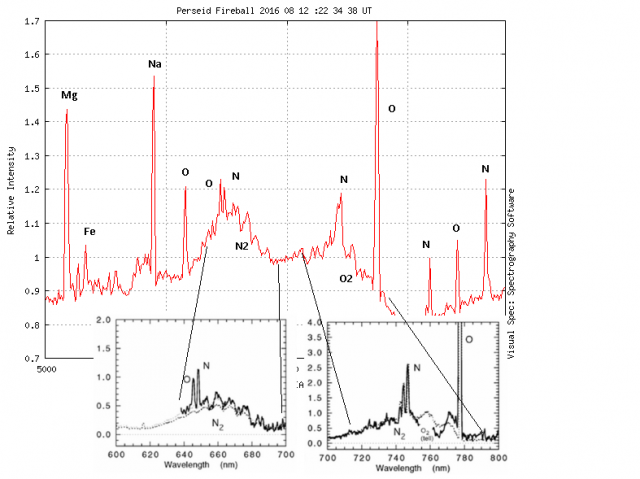
VLT spectrum sections are in black. The modeling done by the astronomers indicates this is the profile of an emission of 4200K at a height of 95km.
As the devil is in the detail if you look closely at the model line (at around 755nm from O2) it is missing from the VLT observation but it is a distinct line in my spectrum. Another cool aspect is the “height” of the lines in the regions marked. Comparing the various scalings shows a very good ratio relation. So it would suggest that my real spectrum matches the modelling quite well. 4200K it is!
Not too terrible at all… 😉
cheers,
Bill.
Bill WardParticipantHi,
Thanks, Unfortunately the zero order fell outside my fov because David Anderson did catch it also. It was a really nice sporadic.
Here is Davids picture.
It would have been nice, I was very pleased with it for a first order spectrum. The dispersion was almost perfect at ~0.9nm/pix (a rare occurence with meteor spectroscopy!) and the effective resolution was ~1.9nm/pix fwhm on the blue/green irons lines. The multi station, multi technique data is slowly building up, we’ll get plenty more with the additional spectro stations now,
cheers,
Bill.
Bill WardParticipantHi,
After the long twilights it was back to the spectro action last night!
Fortune gave me a very bright spectrum this morning. Both good dispersion and good resolution.

Many iron lines with a strong sodium line so very probably a stony iron meteoroid. However doing a instrument flux correction shows the “true” brightness of the blue iron lines.
The video was quite interesting because the sodium line was very prominent on it’s own for a significant proportion of the meteors duration before the other lines lit up.
cheers,
Bill.
Bill WardParticipantHi,
The remarkable spectrum of post #35 has become even more remarkable after attending a presentation by the meteor spectroscopy expert Jiri Borovicka at the International Meteor Conference in the Netherlands a few days ago. (A wonderful event I can recommend!)
The reason that I couldn’t identify many of the lines is that they are not atomic lines. Atomic lines are the only ones I have in the software databases I use but the lines visible are actually compounds! They are probably mostly emissions from oxides such as aluminum oxide. This makes it an even more unusal meteor.
Good stuff!
cheers,
Bill.
Bill WardParticipantHi,
The dim images MIGHT be being caused by the level sttings. Firstly let me disclaim by saying I’ve never used a 902H camera for meteor observing. However I have experienced a similar problem in a more professional capacity when I thought I ought to be seeing brighter images than I was.
Before proceeding does the 902H have a small adjuster screw any where? If so, as in my own case, have the camera on and in a fairly dim setting, ALC low, then slowly (and gently, these little pots aren’t meant to be tweaked too many times) adjust the control screw. The level control adjusts the feedback to the iris and if it’s not set properly even in dark dark conditions the iris may not fully open. (resulting in dim images). If this is the same on the 902H then at some point the iris will open fully irrespective of the illumination and you should see a much brighter image. Once you’ve found when it opens the iris take the pot to the end stop in the same direction. This should in effect keep the iris open under all conditions.
I’d use AGC low all the time if the above works, AGC high can be VERY noisy with a fully open IRIS.
Also I’d try “shutter” OFF first. This is related, usually, to the auto shutter settings. On some cameras this shutter really means the electronic exposure. OFF normally defaults to the longest exposure. To test this try it in day light and very quickly it will become apparent if this is the case as the image will saturate out because the shutter speed will not increase.
Hope this helps,
cheers,
Bill.
PS Also, some video capture cards seem to automatically produce fairly dim images. You may also need to adjust Brightness/Contrast/Gain on the video control panel. I had two dreadful Hauppauge boards that had this problem, every single power up they had to be adjusted. Thay are now in the bin! I’d try sorting the camera first though….
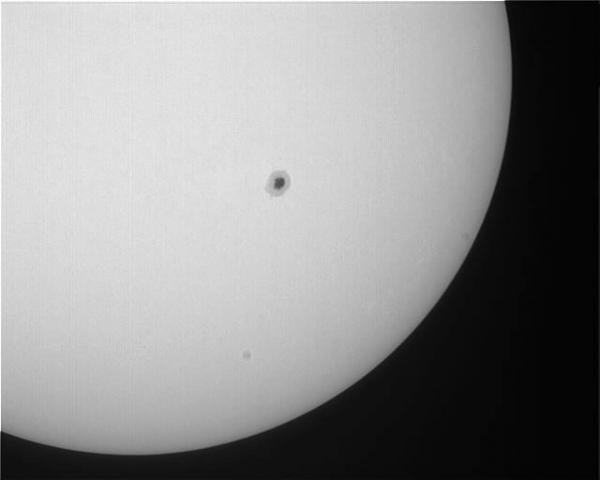
Bill WardParticipantHi,
I found a filter for 850nm (16nm fwhm) which happens to be very close to the emission wavelength of the Ca II IR triplet, however the image is much more bland at 850 due to less scattering and the fact that the telescope optics have less than half the resolution at this wavelength cf 390nm. (The Ca II IR triplet is used in spectrohelioscopes for photopolarimetry. The family of UV and IR transitions are quite interesting…)
Even a casual inspection reveals the limb just looks brighter, so doing the very same thing as before gave this graph…
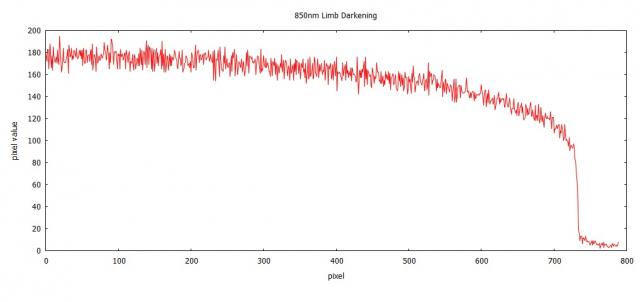
Which indeed does have a slightly less steep gradient than the 350nm image. The edge has a brightness of around 56% of the centre.
This was all done with “auto everything” on, with the camera and software so I’m not sure how absolutely accurate the measurements are photometrically but it makes sense, which is kinda re-assuring… 😉
On doing a bit more digging, this continues for some ways until the very shortest radio wave wavelengths are reached when there is a transition to limb brightening!
cheers,
Bill.
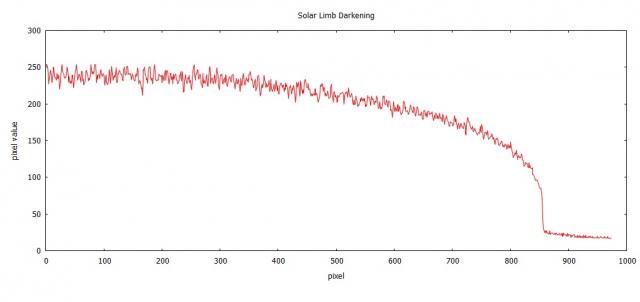
Bill WardParticipantHi,
A lot of books describe the limb darkening but I’ve never seen it actually plotted. So I thought it might be fun to see what it looks like. Since the images were taken through a deep blue filter the darkening should be more here than at longer wavelengths. Since the shorter wavelengths scatter more. (Might be interesting to try this as different wavelengths to see if the theory matches the observations…)
At the edge the value of pixels is 37.5% of the centre.
Fascinating!
cheers,
Bill.
-
AuthorPosts