› Forums › Variable Stars › Supernova in M101 !
Tagged: M101, Messier 101, SN2023ixf, supernova
- This topic has 85 replies, 18 voices, and was last updated 2 years, 10 months ago by
 Mr Ian David Sharp.
-
AuthorPosts
-
3 June 2023 at 9:33 am #617644
 Mr Ian David SharpParticipant
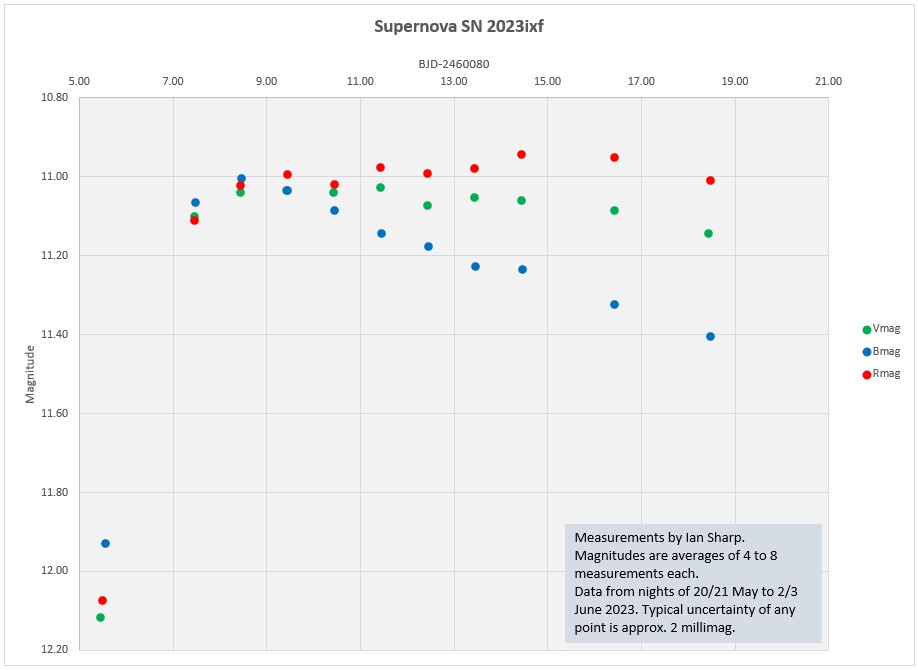
I’ve added last night’s data (2/3 June) – see attached graph.
B-V = +0.26
Cheers
Ian.Attachments:
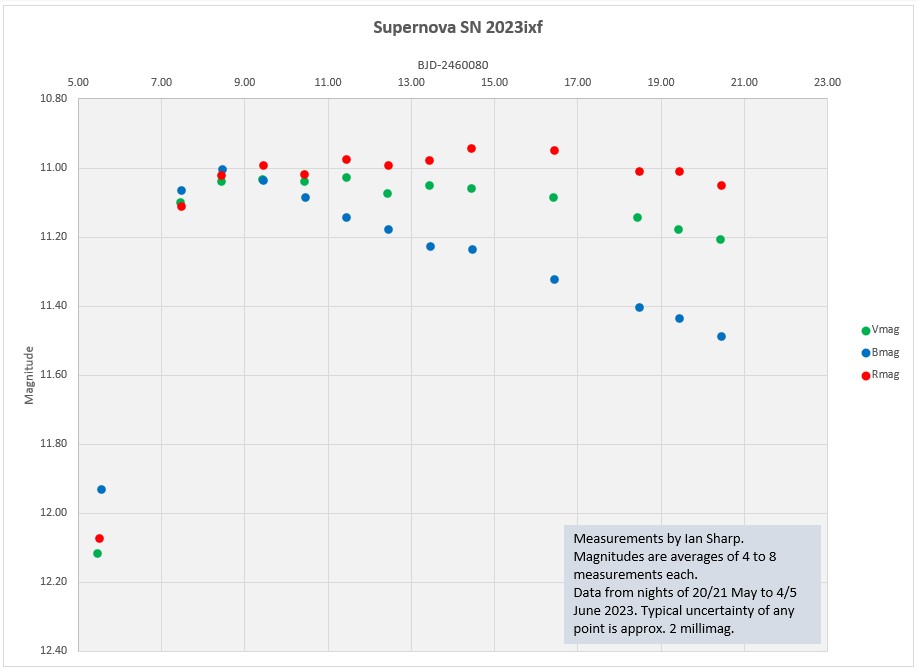
5 June 2023 at 8:04 am #617672Mr Ian David SharpParticipantMorning!
Here’s my updated mag. graph with last night’s results.
B-V now +0.28Cheers
Ian.Attachments:
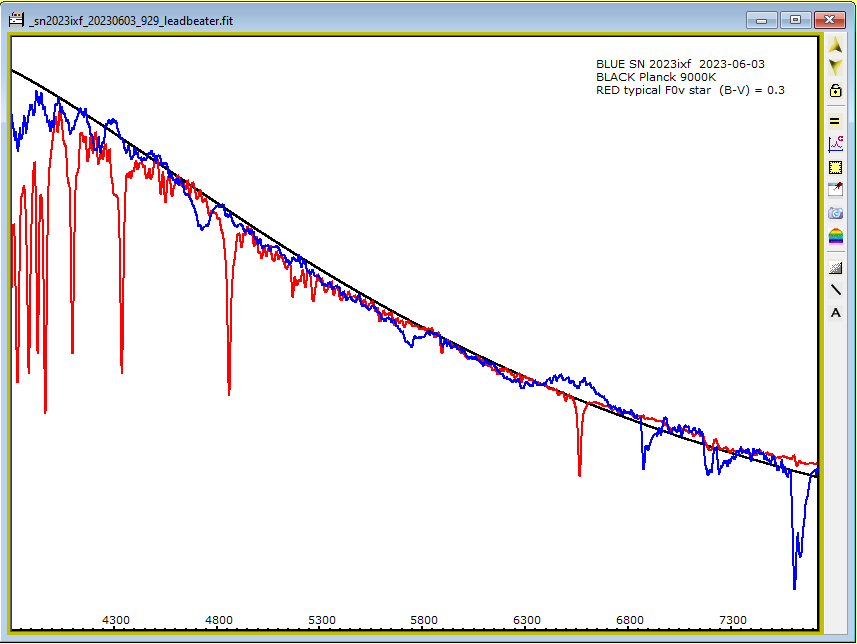
5 June 2023 at 11:20 am #617677 Robin LeadbeaterParticipant
Here is a low resolution spectrum for the night 3/4 June. The continuum continues to cool and now matches a black body temperature of 9000K or an F0v star ((B-V) = 0.29.) The features are still weak with a very broad H alpha component with some structure evident at higher resolution. The higher Balmer lines are increasing in absorption blue shifted by ~8000 km/s
Attachments:
7 June 2023 at 8:31 am #617733Mr Ian David SharpParticipantHi all,
Here is my updated mag graph from last night.
B-V = +0.295
Ian.
-
This reply was modified 3 years, 1 month ago by Mr Ian David Sharp.
-
This reply was modified 3 years, 1 month ago by Mr Ian David Sharp.
Attachments:
7 June 2023 at 10:21 am #617759Kwong Man
ParticipantHello Ian,
Thanks for your excellent imaging and analysis of the supernova. I was wondering, how you manage to get so much data, my skies are quite cloudy and even quite windy.
Also how do you find the M101 so accurately, which software and platesolving software do you use ?Many thanks.
Kwong7 June 2023 at 10:44 am #617764Mr Ian David SharpParticipantThanks for your excellent imaging and analysis of the supernova. I was wondering, how you manage to get so much data, my skies are quite cloudy and even quite windy.
Also how do you find the M101 so accurately, which software and platesolving software do you use ?Hi Kwong,
Well, I have to say that I cannot remember a clear spell like the one we are having here in the UK at the moment! I don’t want to jinx it but it has been clear almost every night for weeks! I also have a remote observatory in Spain but the weather there has been terrible for weeks!
I acquire my images using software called Sequence Generator Pro. This does all of the scheduling for my imaging runs and I use PlateSolve2 or ASTAP for my platesolving:
https://www.hnsky.org/astap.htm
https://planewave.com/download/platesolve2/Cheers
Ian-
This reply was modified 3 years, 1 month ago by Mr Ian David Sharp.
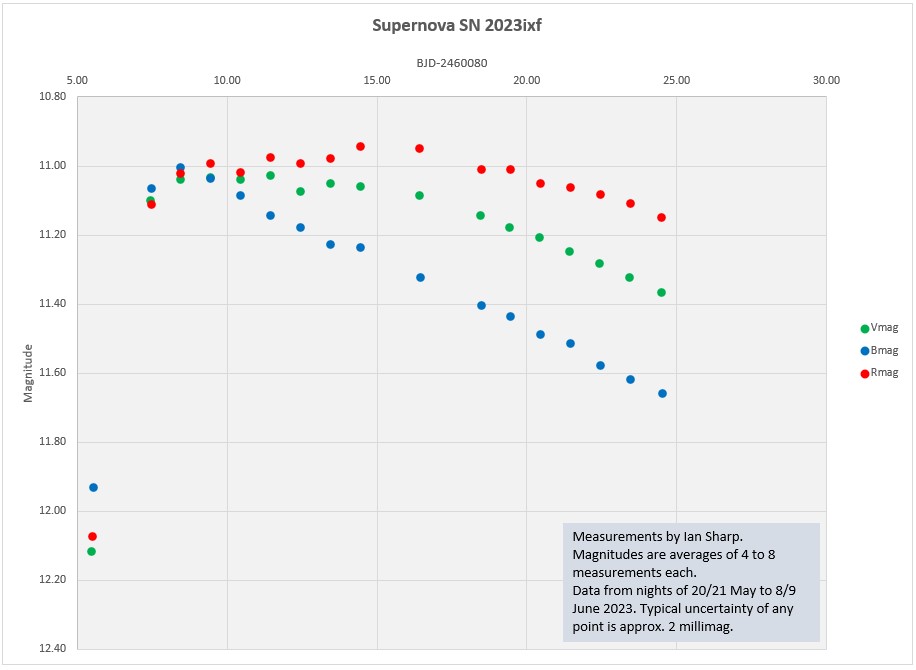
9 June 2023 at 7:36 am #617777Mr Ian David SharpParticipantGood morning,
Attached is my updated graph up to last night (8/9 June).
The B-V settled at +0.29
Cheers
Ian.Attachments:
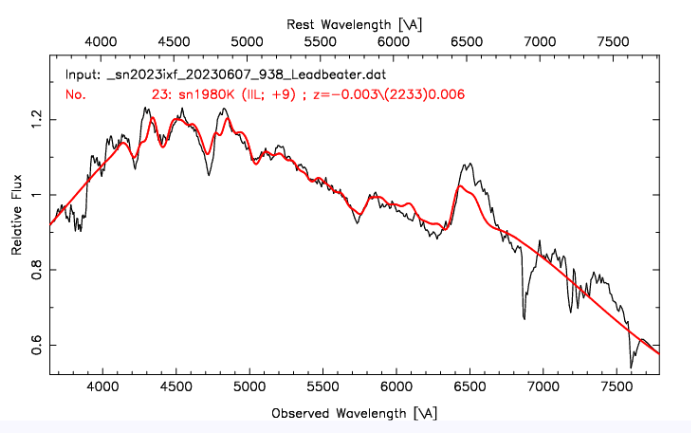
10 June 2023 at 1:56 pm #617792Robin LeadbeaterParticipantThe spectrum is now showing increasing features more typical of type II supernovae (Broad P Cygni Balmer lines)
Here is an example match in SNID to SN1980K 9 days past maximumCheers
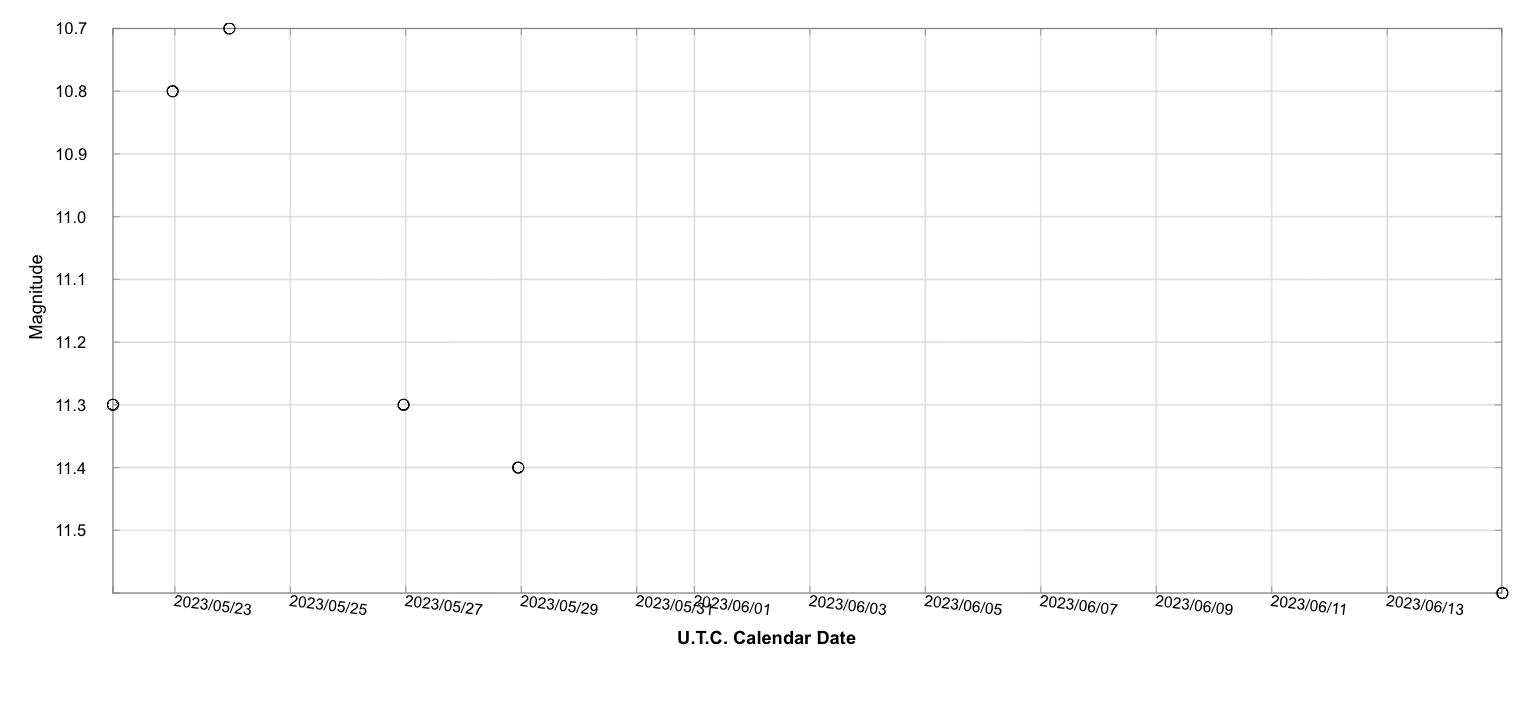
Robin13 June 2023 at 8:53 am #617822Mr Ian David SharpParticipantHi all,
Here’s my updated magnitude plot as of last night (12/13 June).
Cheers
Ian.Attachments:
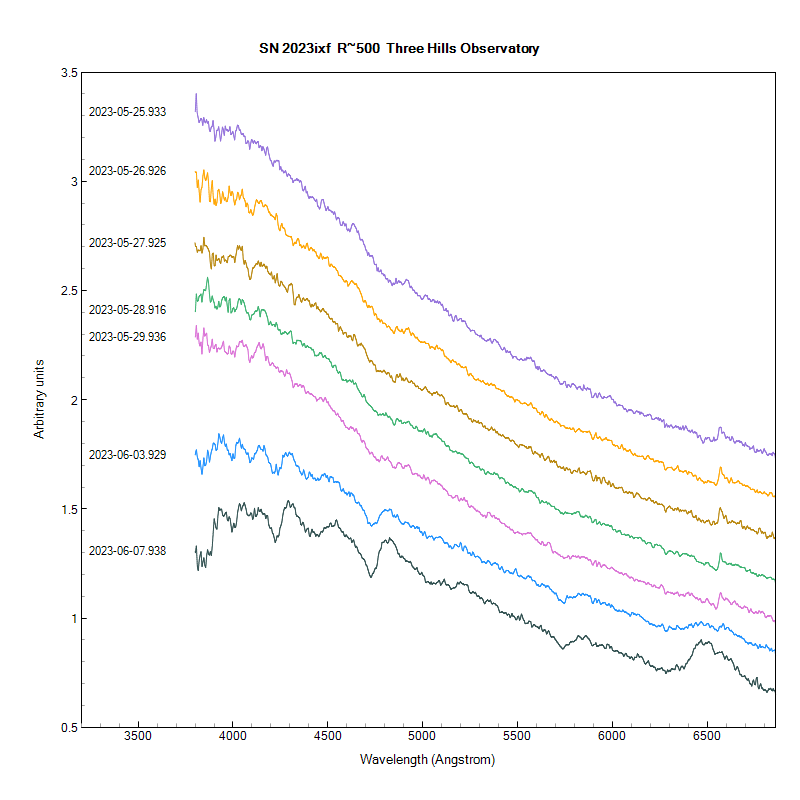
14 June 2023 at 3:58 pm #617849Robin LeadbeaterParticipantA continuation of the animation of the spectrum. Part 2 covers 2023-05-27 to 2023-06-13 and shows the transition from an almost featureless spectrum to one showing more typical broad P Cygni Balmer lines
https://britastro.org/observations/observation.php?id=20230614_144855_b767104d96087a30Cheers
Robin15 June 2023 at 8:18 am #617855Mr Ian David SharpParticipantA continuation of the animation of the spectrum. Part 2 covers 2023-05-27 to 2023-06-13 and shows the transition from an almost featureless spectrum to one showing more typical broad P Cygni Balmer lines
Superb!
I have attached my updated photometry graph with new data from both observatories last night (14/15 June).
Ian.
Attachments:
15 June 2023 at 8:49 pm #617857 Paul G. AbelParticipant
Due to cloudy skies I have only managed six observations- the one I made last night is included on the plot. Although it’s only six points it is enough to see the basic type 2 supernova light curve.
Attachments:
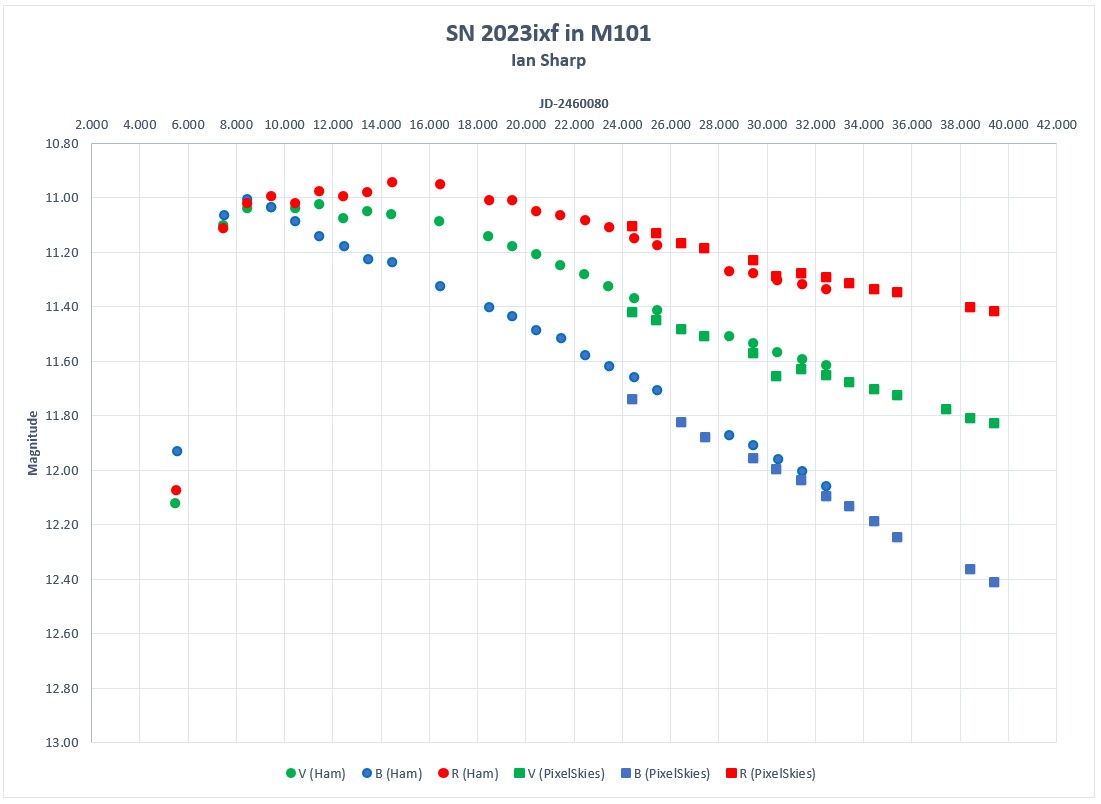
24 June 2023 at 8:03 pm #617955Mr Ian David SharpParticipantIt’s been a few days since I posted an update on the RVB photometry of supernova SN 2023ixf in M101. I’ve been away on holiday for a few days and haven’t been able to process my observations. Here’s my updated graph which still shows a gradual decline in magnitude and a widening B-V value. My data covers nearly 40 days so far…
I was able to control my system at Pixel Skies Astro with my phone whilst I was in a boat in the wilds of the Norfolk Broads!Ian.
Attachments:
7 July 2023 at 6:31 am #618044 Jeremy ShearsParticipant
There is a charming article about the discoverer of SN2023ixf in the journal Science:
https://www.science.org/content/article/amateur-astronomer-may-worlds-top-supernova-hunter
8 July 2023 at 5:48 pm #618049 Alan ThomasParticipant
Nice article, Jeremy. Thanks.
Alan9 July 2023 at 3:08 pm #618058Mr Ian David SharpParticipantHi all,
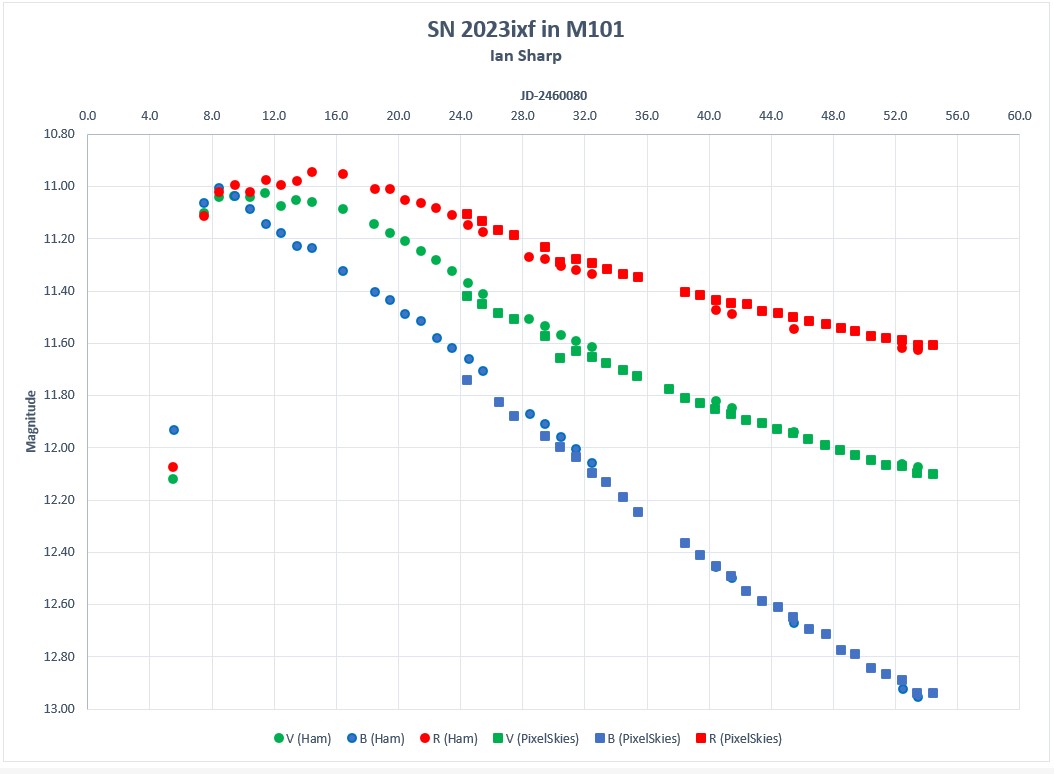
It’s been quite a few days since my last update but I have been manfully soldiering on measuring mags with the 3 RBV filters and I’ve barely missed a night!
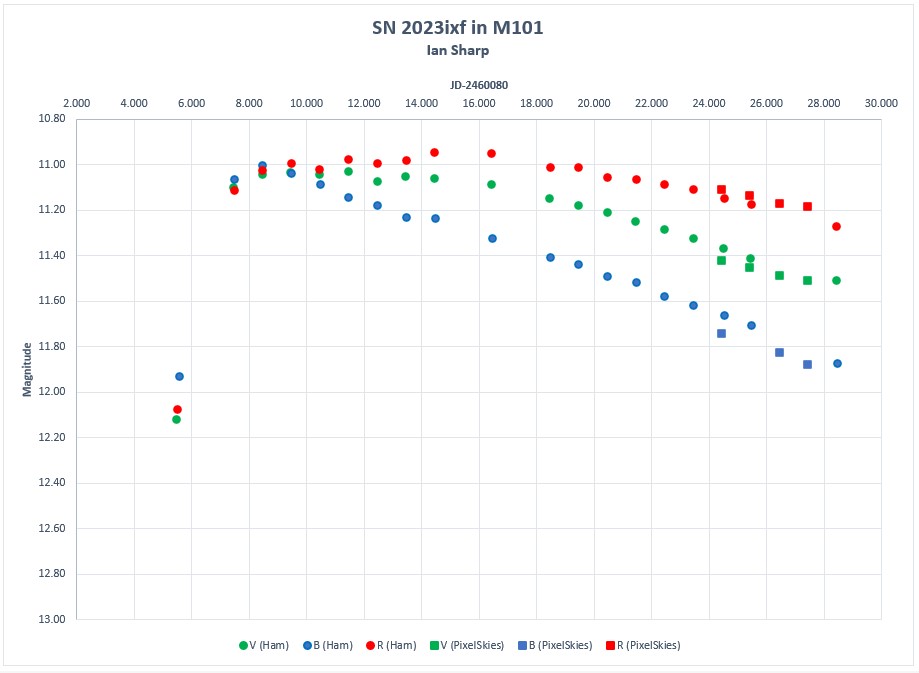
I was talking to Robin Leadbeater at the excellent BAA Comet Section Meeting yesterday whether he thought that SN 2023ixf was a Type II-L or Type II-P. We both agreed that, since there has been no sign of a plateau to-date, it must be a Type II-L. However, now I’ve added last night’s data all three colours seem to be showing the beginnings of a sharp bend to a flat line (see attached graph – look at the last 2 square points on each line).
I’d be interested in any comments. Maybe the next couple of nights will tell!
Best Regards
Ian.Attachments:
10 July 2023 at 9:28 am #618076Mr Ian David SharpParticipantHi all,
With regard to may last post. New data from last night reveals that the slow decline continues!
Ian.
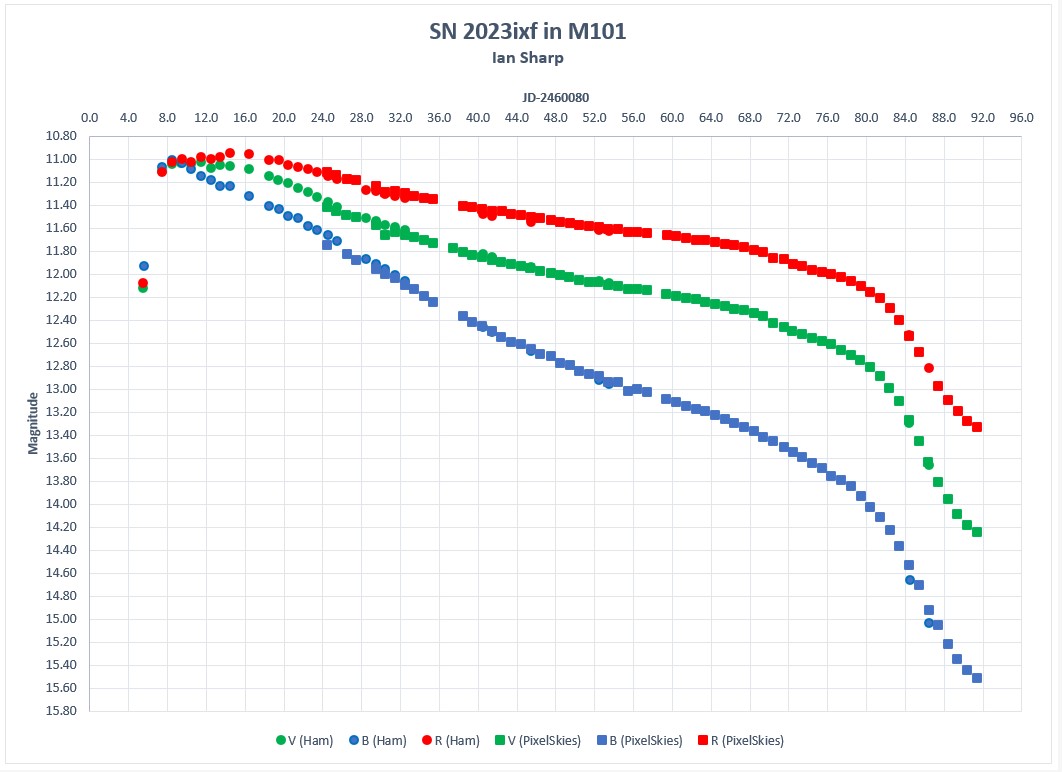
15 August 2023 at 1:34 am #618683Robin LeadbeaterParticipantI see from the light curve the slow steady decline (~2 magnitudes in V over 70 days) has come to an end and the brightness is now dropping rapidly (~1.5 magnitudes in 12 days) This behaviour is similar to that seen in type II-P supernova following the plateau period so SN 2023ixf may have characteristics of both type II-L and II-P, similar to supernova like 2013by discussed in this paper for example
https://arxiv.org/abs/1501.06491v2Cheers
Robin-
This reply was modified 2 years, 11 months ago by
 Robin Leadbeater.
-
This reply was modified 2 years, 11 months ago by Robin Leadbeater.
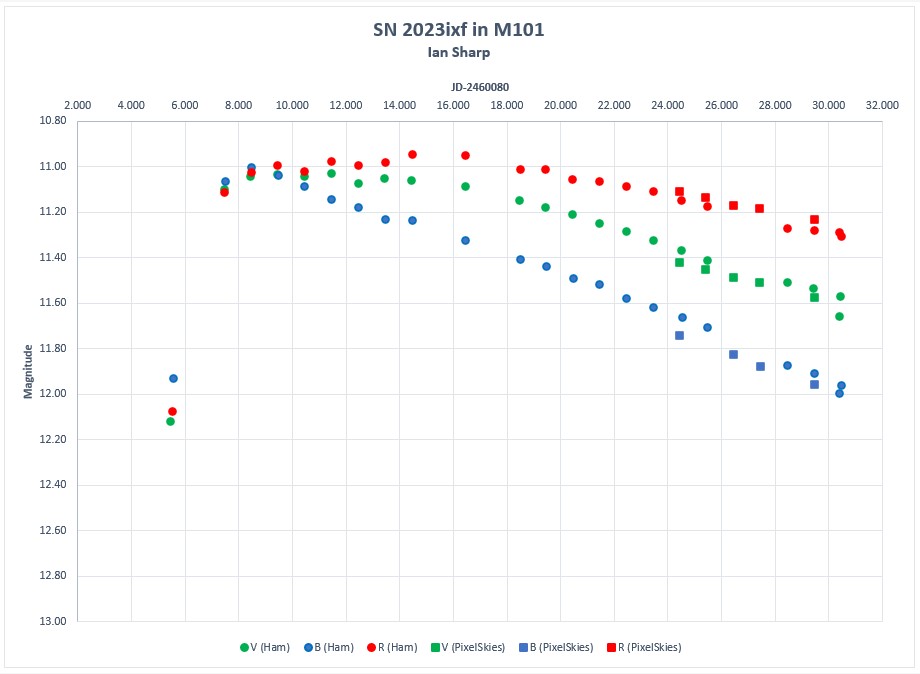
15 August 2023 at 10:12 am #618686Mr Ian David SharpParticipantI see from the light curve the slow steady decline (~2 magnitudes in V over 70 days) has come to an end and the brightness is now dropping rapidly (~1.5 magnitudes in 12 days)
Hi Robin,
Yes, and it’s turned back up again! See attached graph as of last night’s data…
Cheers
Ian.Attachments:
15 August 2023 at 10:39 am #618689Jane Clark
ParticipantIan, I am tremendously impressed by your work following this supernova.
In addition, I think we can make your “It’s turned back up again!” statement a little more quantitative. The rate of change over time of brightness (mathematical jargon term first time derivative of brightness) for all three colours is negative, and has been since about day 18. The rate of change of the rate of change over time of brightness (mathematical jargon term second time derivative) is what has changed sign in the last few days.
It would not be difficult to plot these quantities, but to do so accurately would require your data, rather than my guessing the values with a printed graph and measuring calipers.
-
This reply was modified 2 years, 11 months ago by
Jane Clark.
Jane Clark
-
AuthorPosts

- You must be logged in to reply to this topic.