Forum Replies Created
-
AuthorPosts
-
 Maxim UsatovParticipant
This happened to me when I was living in Prague – always missing issues.
Max
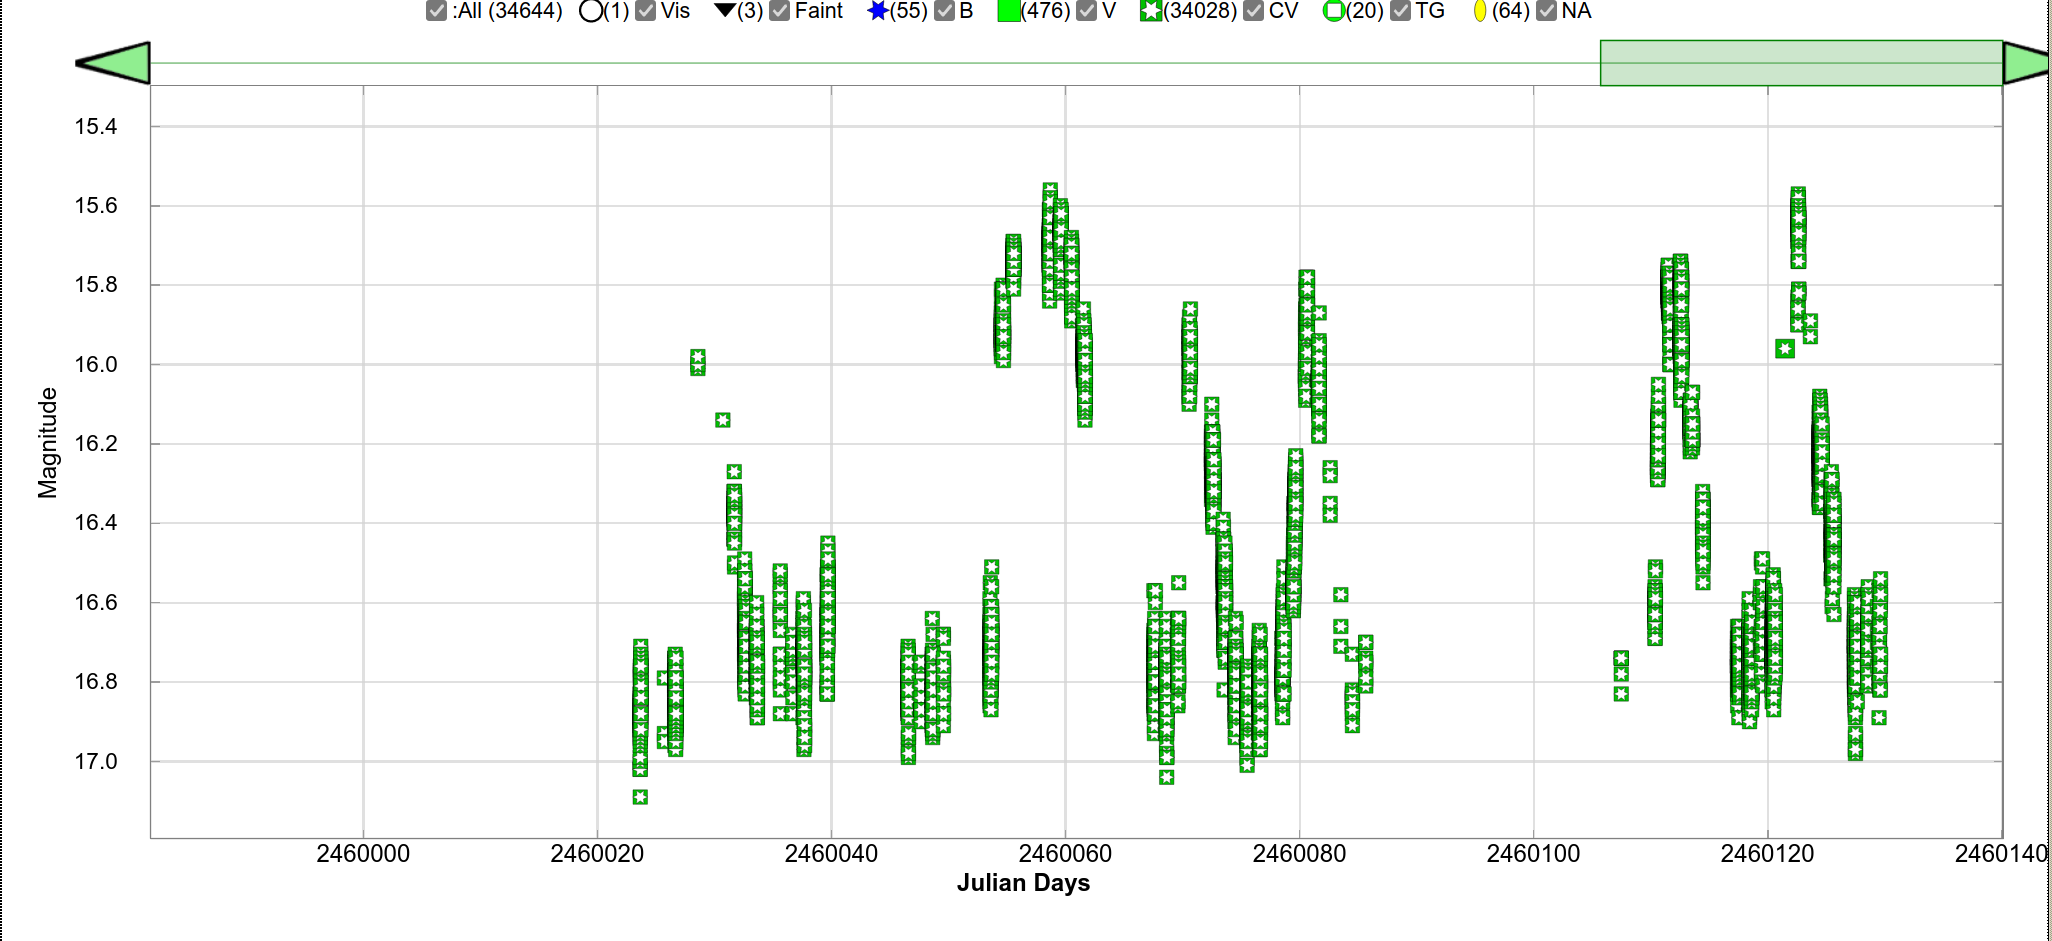
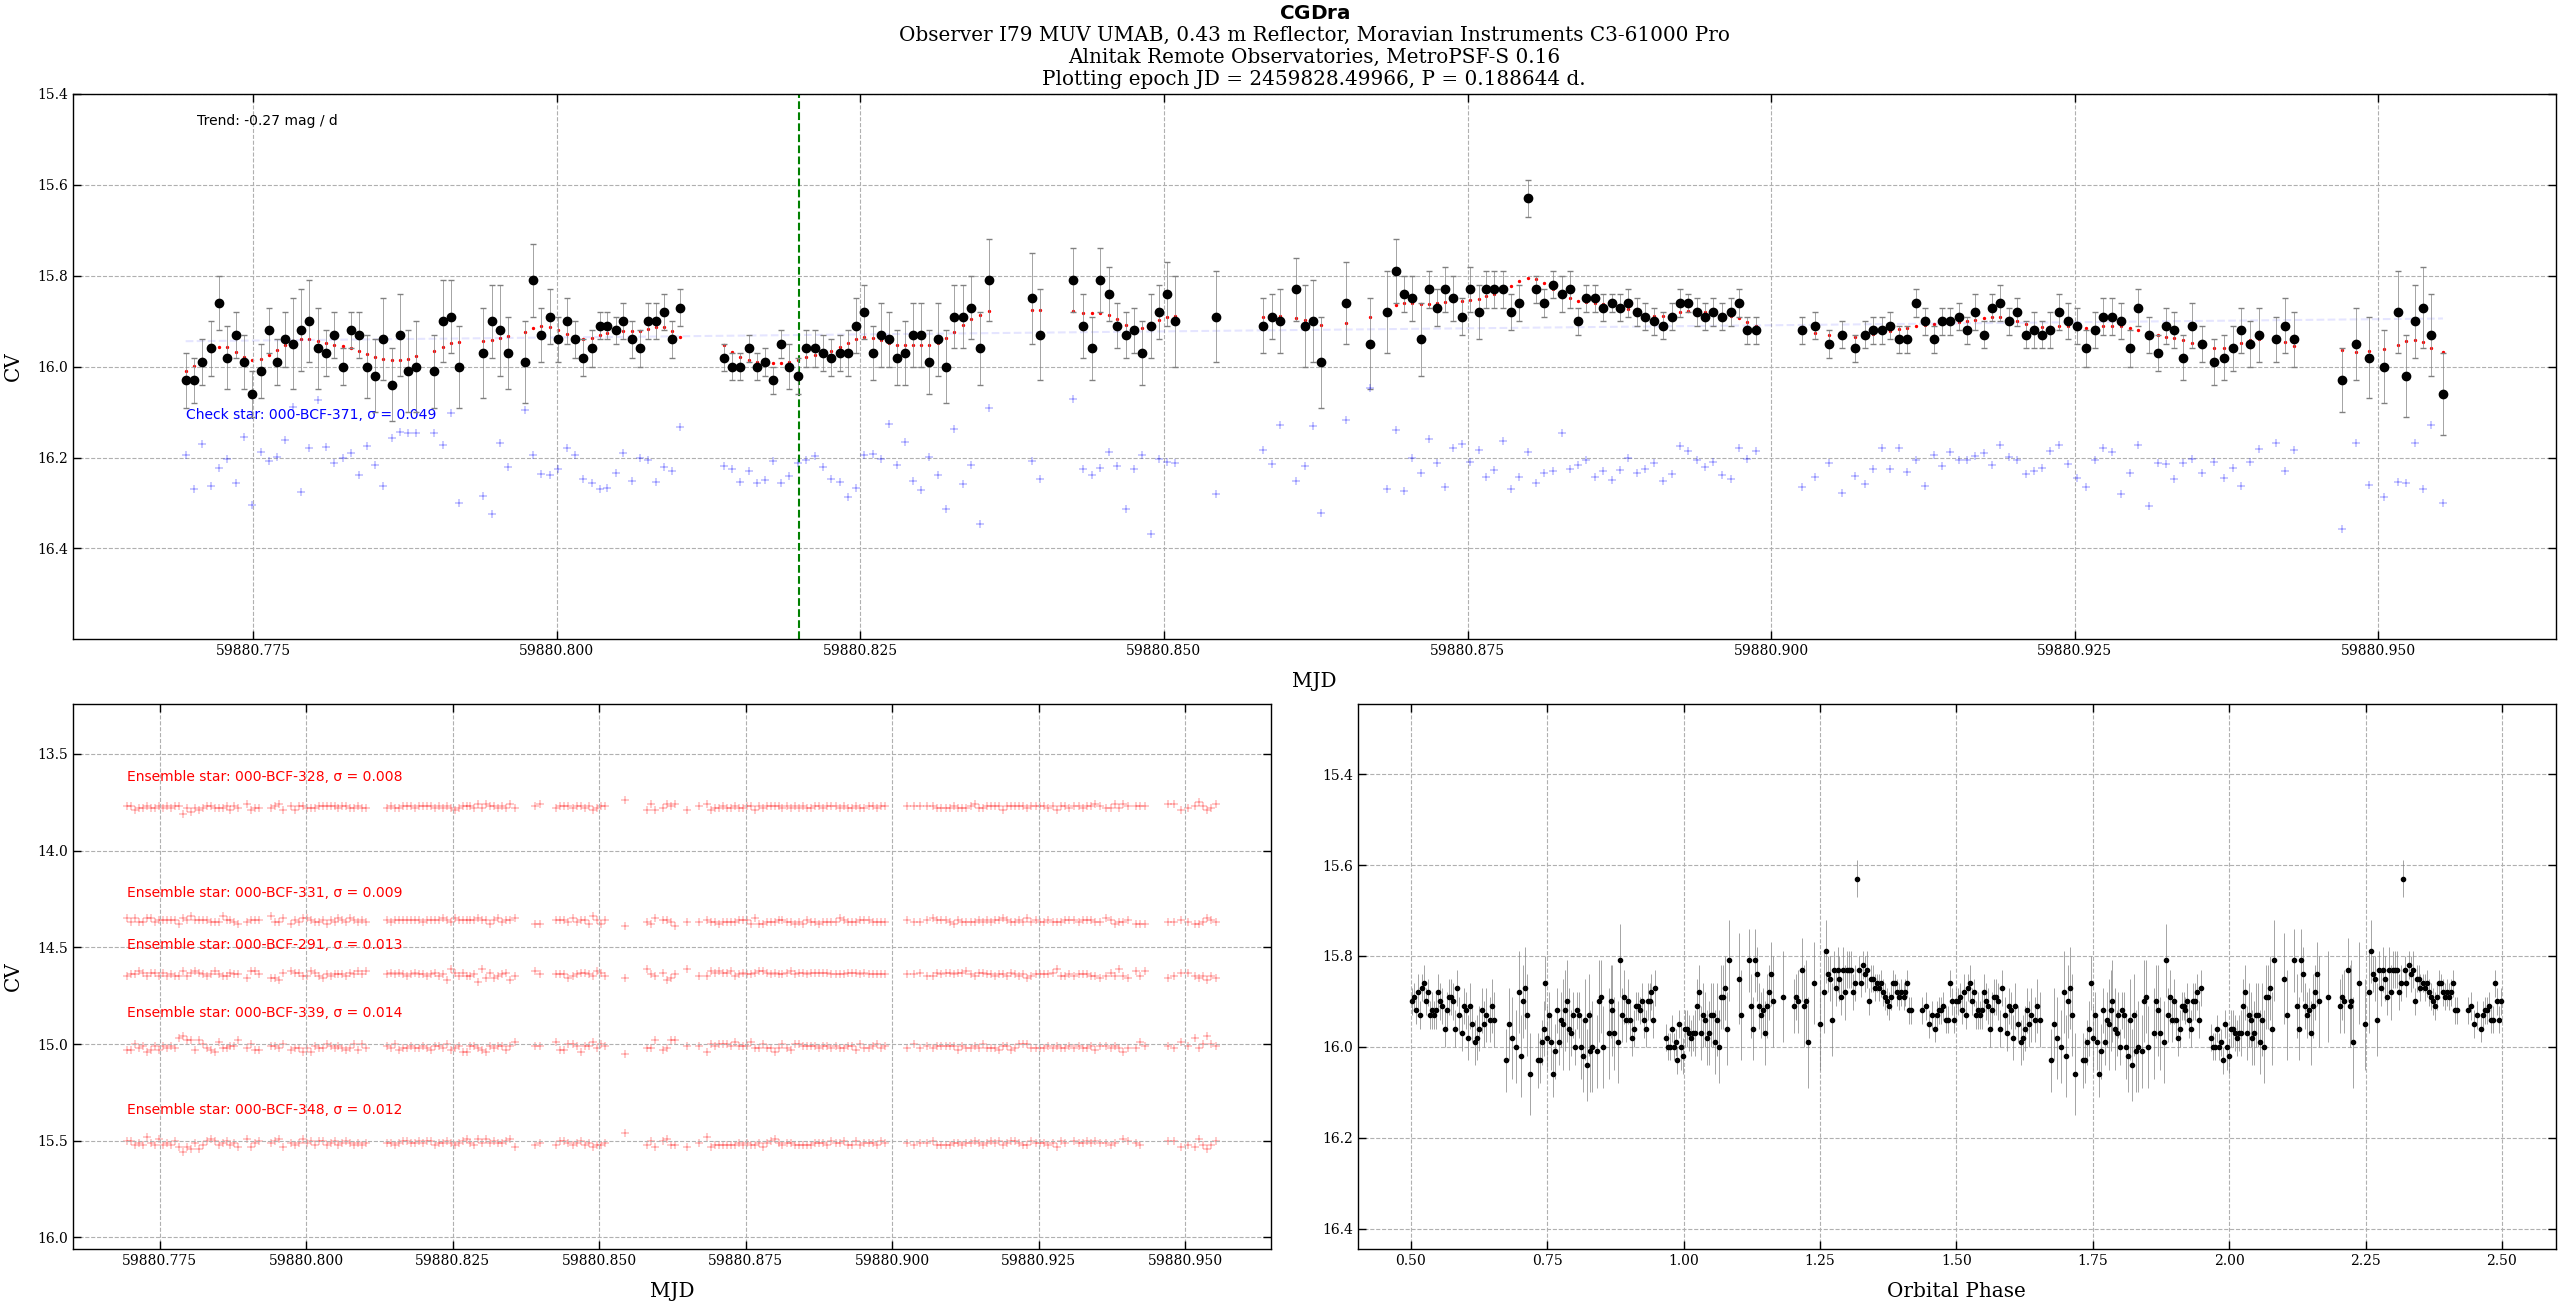
Maxim UsatovParticipantI keep monitoring CG Dra and it’s an interesting sharp-peaking short “bright outburst” I’ve never seen before, or could be an illusion due to patchy data. (This year’s May/June is really rainy in Spain.)
Max
Attachments:
Maxim UsatovParticipantCelesTrak says it is lost.
https://celestrak.org/satcat/table-satcat.php?NAME=euclid&PAYLOAD=1&MAX=500NORAD ID 57209. Hopefully TLE will be available soon.
Maxim UsatovParticipantCG Dra fading from the bright outburst that peaked on 24th.
Maxim UsatovParticipantSo, I have just purchased the commercial license for BlurXTerminator. I think it’s a very good piece of software. Much faster deconvolution than Richardson-Lucy, and the results are pretty good. Here is the first image, of M86, I have processed with it:
Maxim
Maxim UsatovParticipantAmazing results, Kevin. I can’t wait to try this.
Maxim UsatovParticipantWe’re just past the bright outburst. Data continues to flow from A1, I’m submitting to the BAA database. (It would be nice to automate submission somehow – an API would be great!)
Max
Maxim UsatovParticipantHi Andy,
Still experiencing issues with the login – I am being logged out every day and have to relogin every time. Also, the Login button at the bottom of forum threads leads to a broken login form with errors, only the main menu works.
Thanks!
Max
Maxim UsatovParticipantThanks, Jeremy.
Eclipses No(s): 108
State: FadingLooks like E107 was a normal outburst. Bright outburst expected next.
Max
-
This reply was modified 3 years, 6 months ago by
 Maxim Usatov.
Attachments:
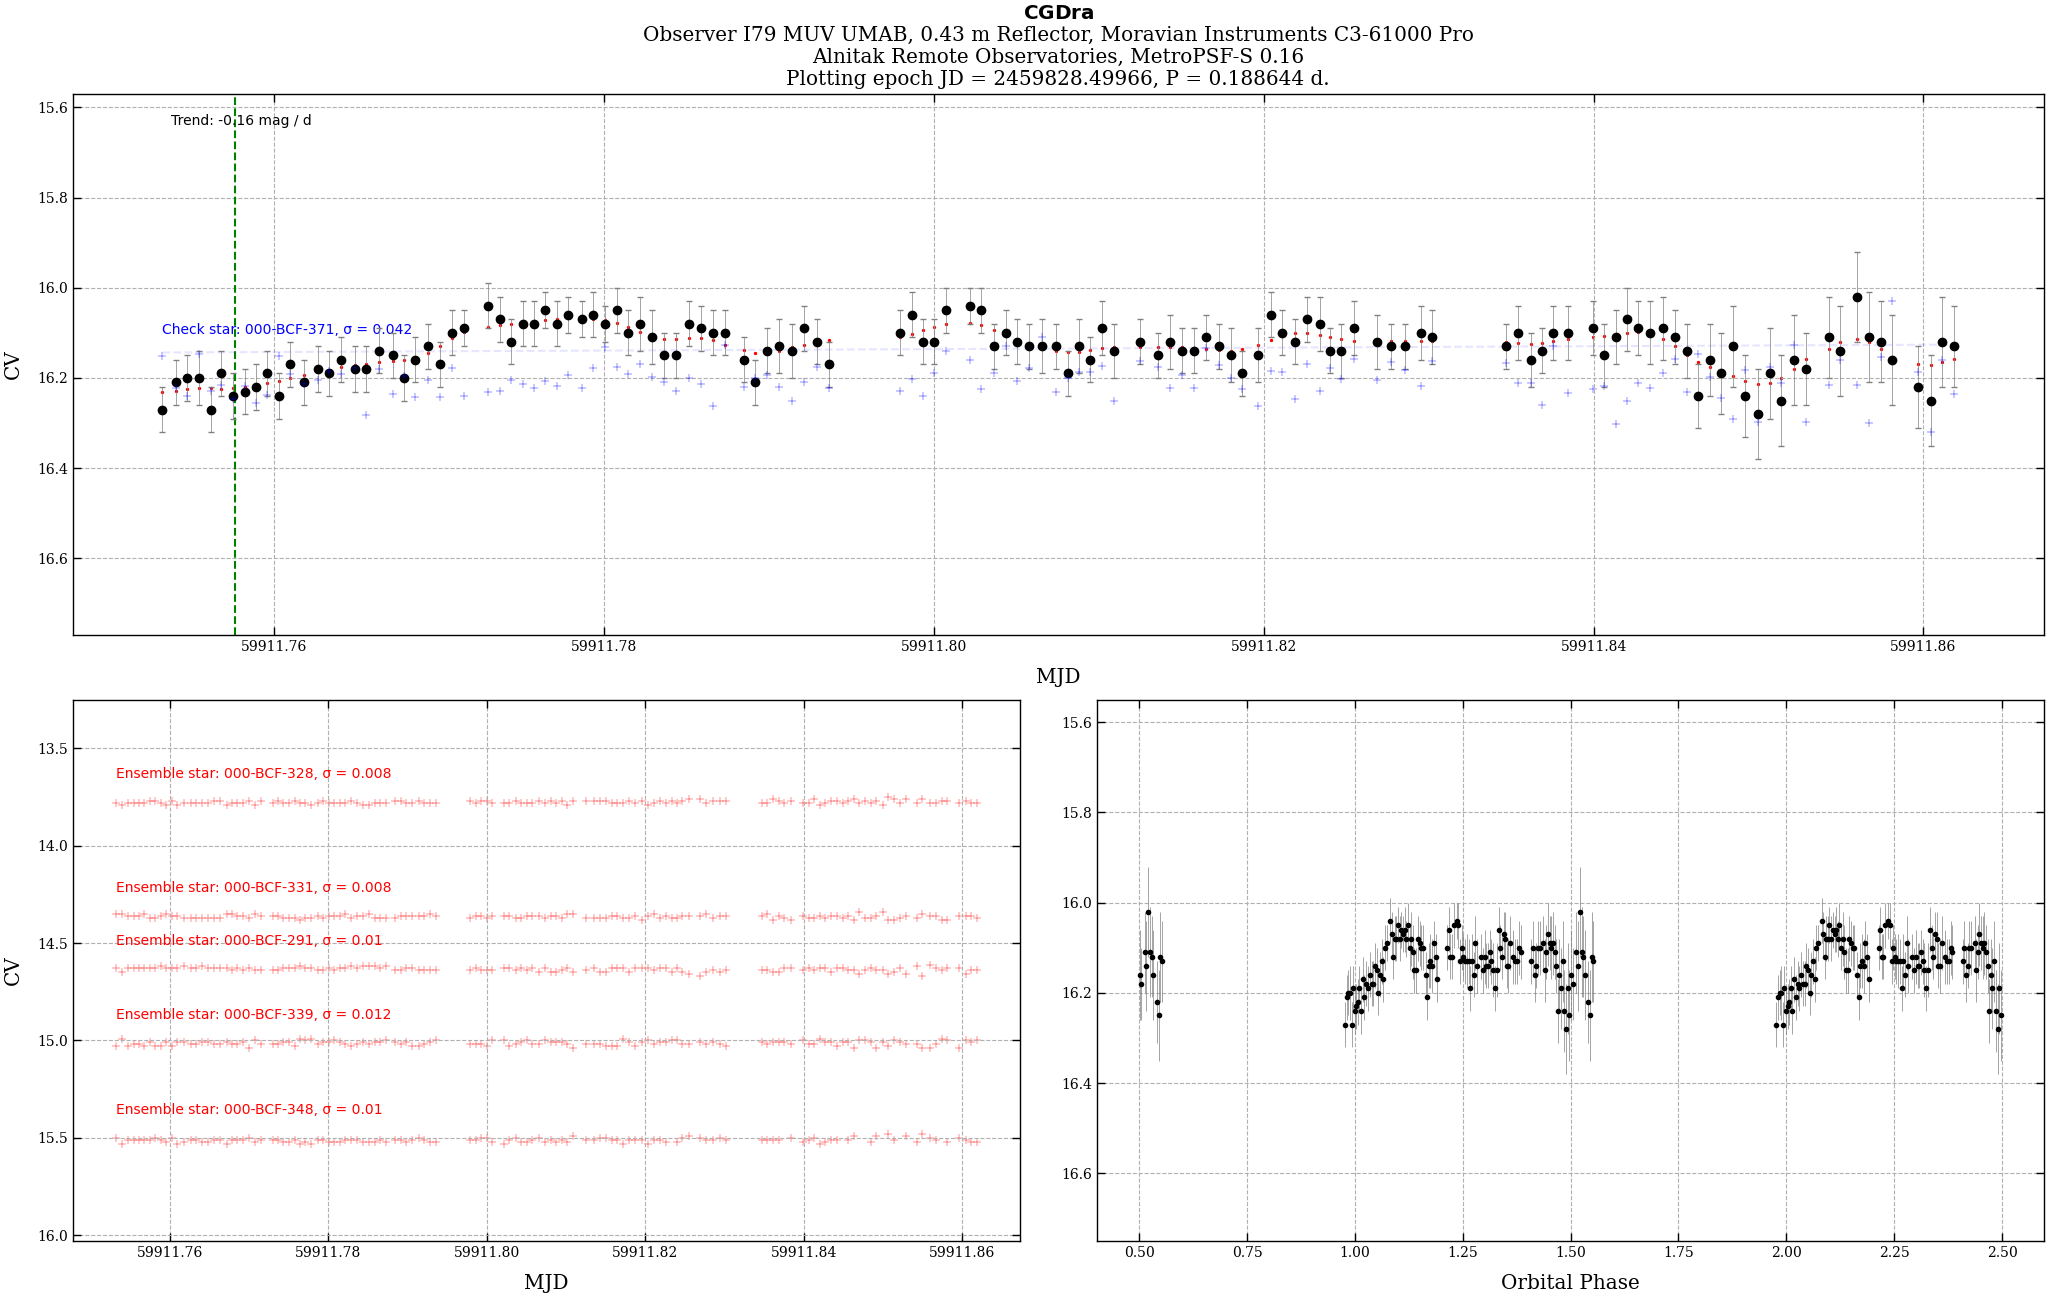
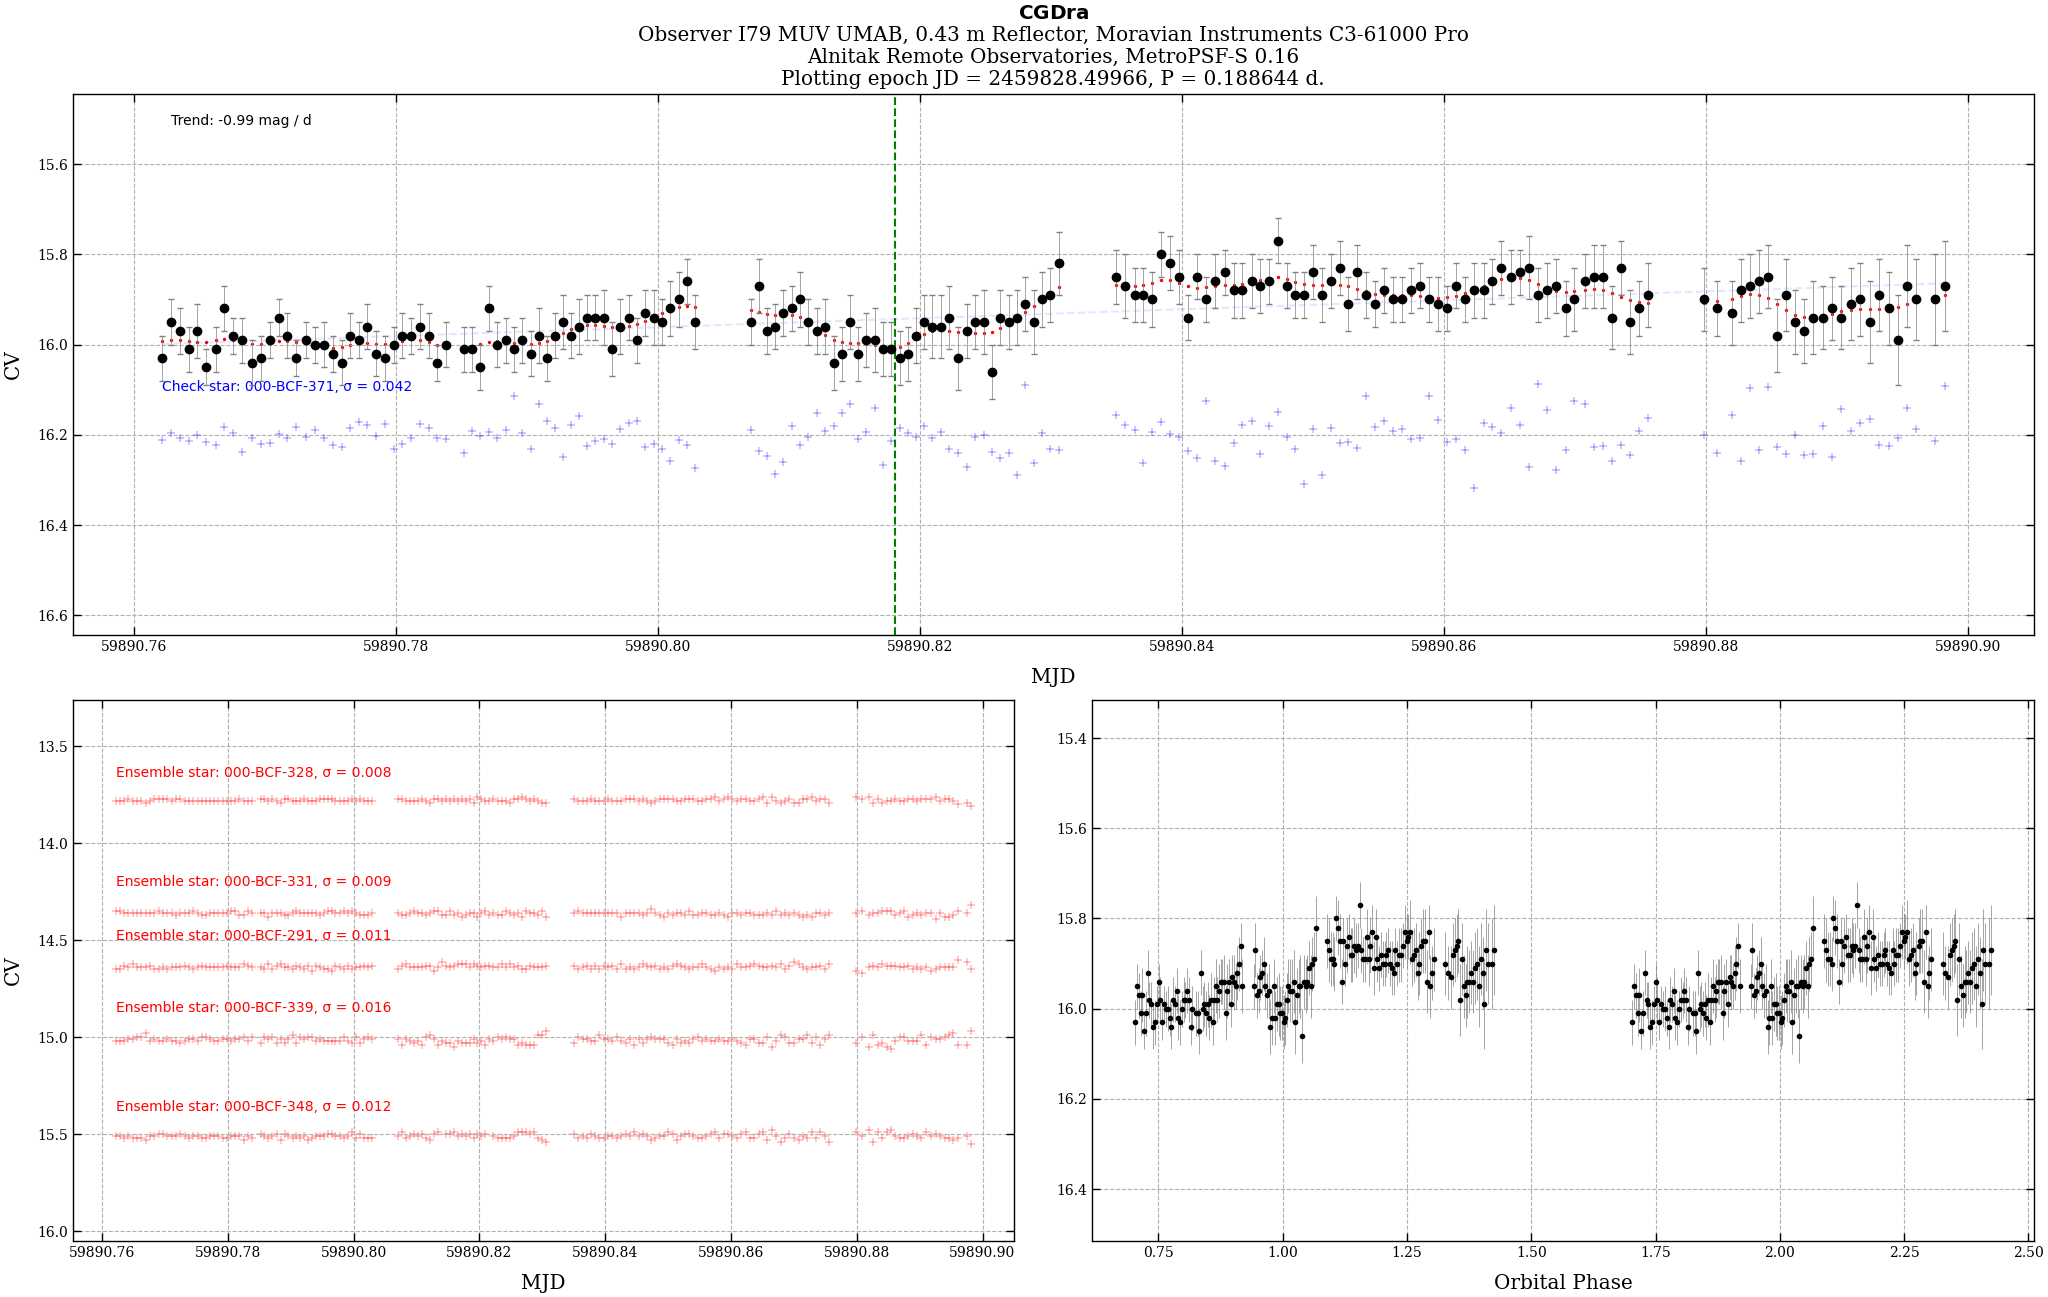
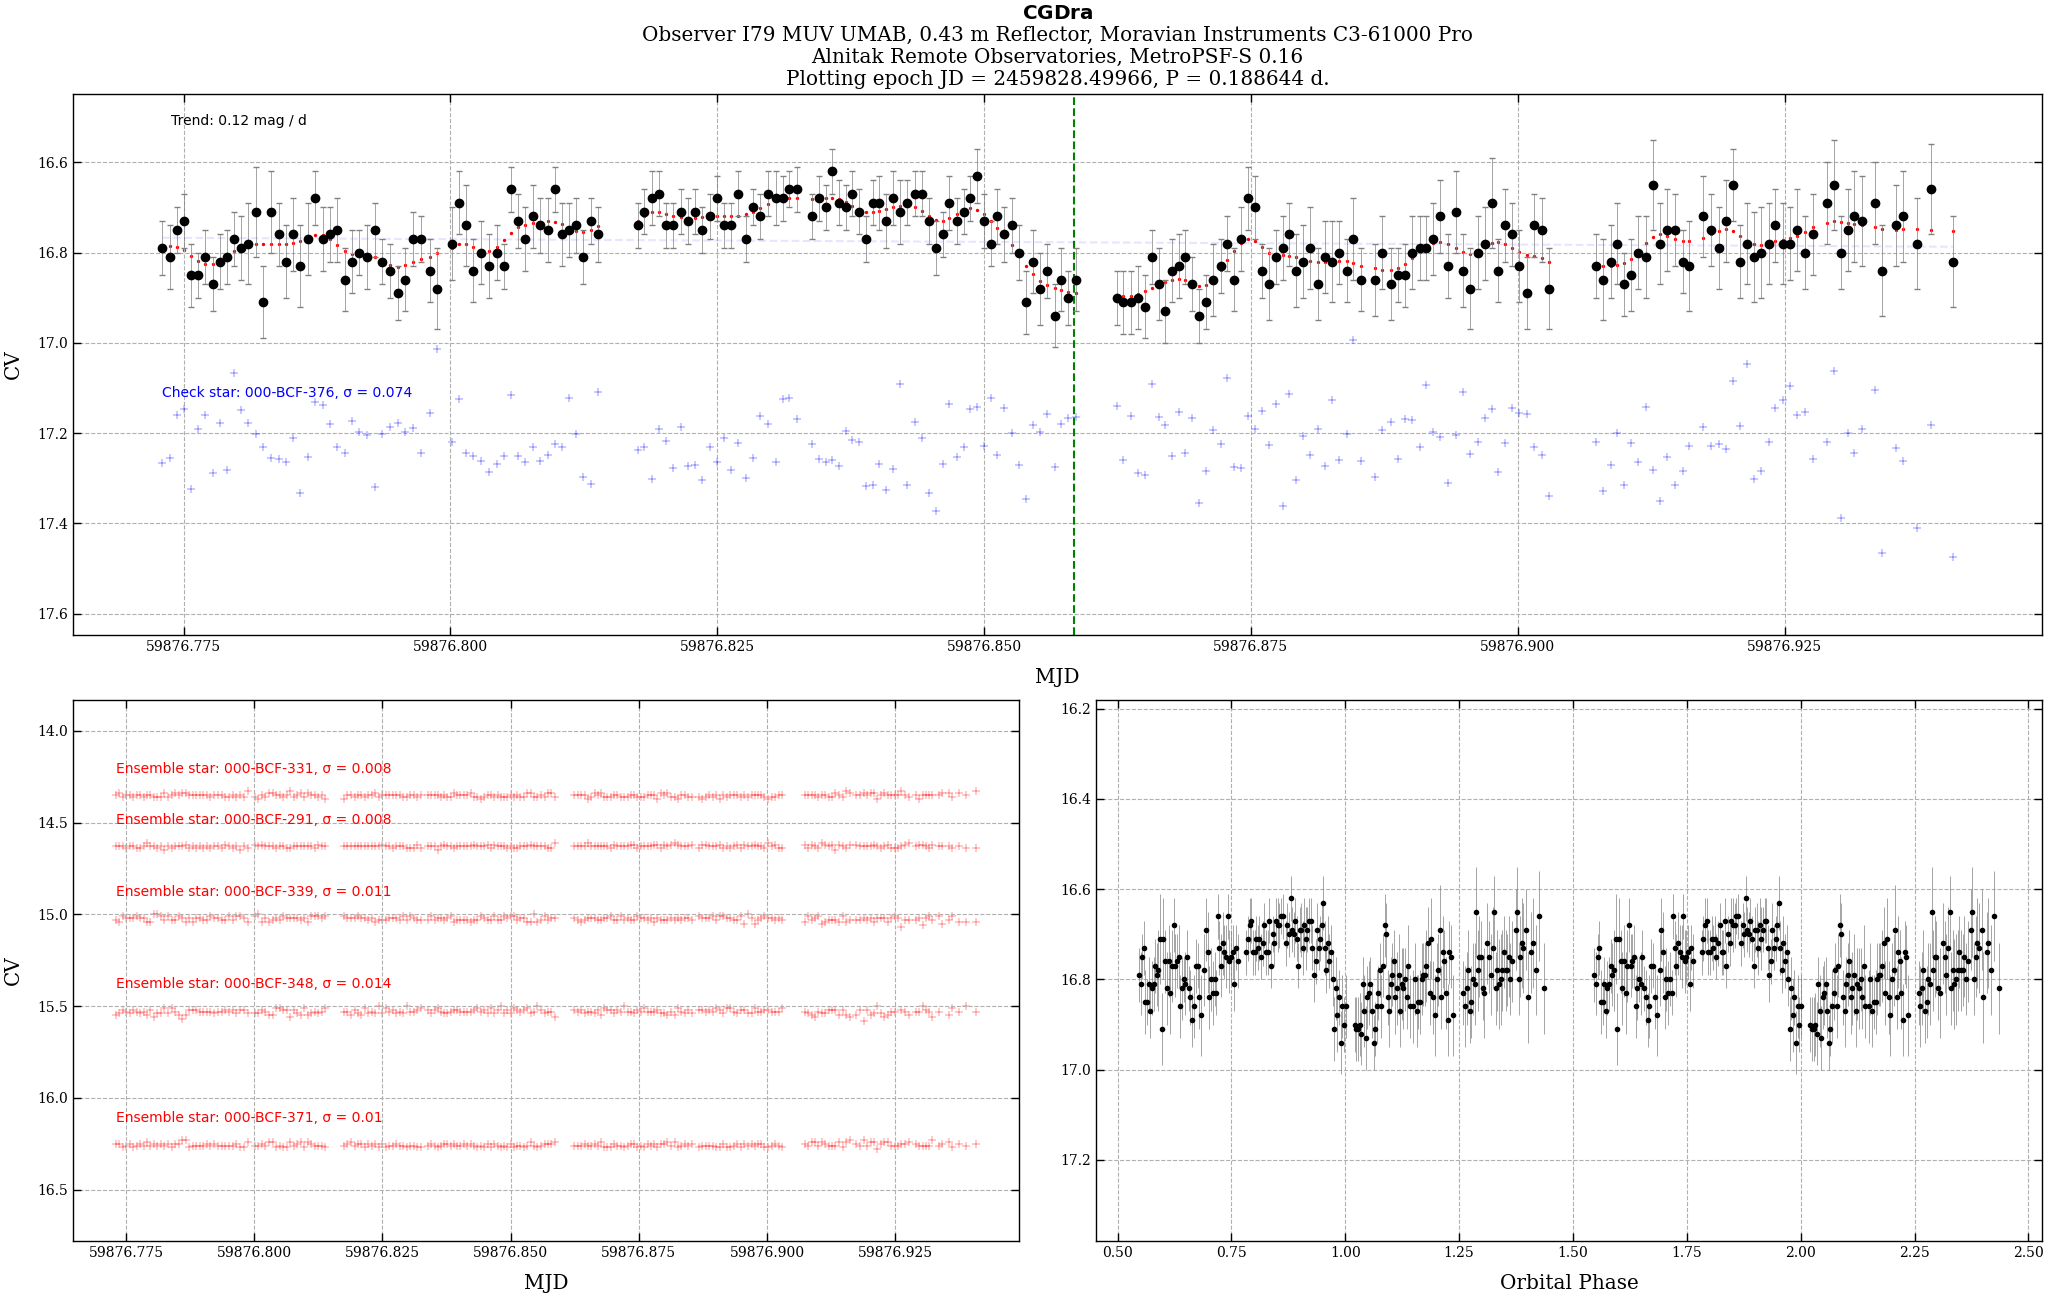
Maxim UsatovParticipantEclipses No(s): 107
State: Outburst or the beginning of a Bright OutburstI’m still here, just that the weather doesn’t really help. CG Dra is visible for only a few hours until it sets too low at about midnight. This coming week, I think, is going to be very important, as this dwarf nova will go into its fourth bright outburst since this continuous light curve effort started, and it would be nice to understand if bright outbursts are indeed as periodic as they seem.
This appears to be a symmetric eclipse, but the orbital hump “iceberg” visible here is of almost 0.2 magnitude amplitude, which is quite odd. In this state CG Dra profile should be accretion disk-dominated, as it’s hot and ionized. As the bright spot supposed to be of constant flux due to the constant mass transfer in the widely accepted outburst model, it shouldn’t appear here at all. I wonder if we are looking at an increased mass transfer episode here, and if so, is this something that triggers bright outbursts?
Max
-
This reply was modified 3 years, 6 months ago by Maxim Usatov.
Attachments:
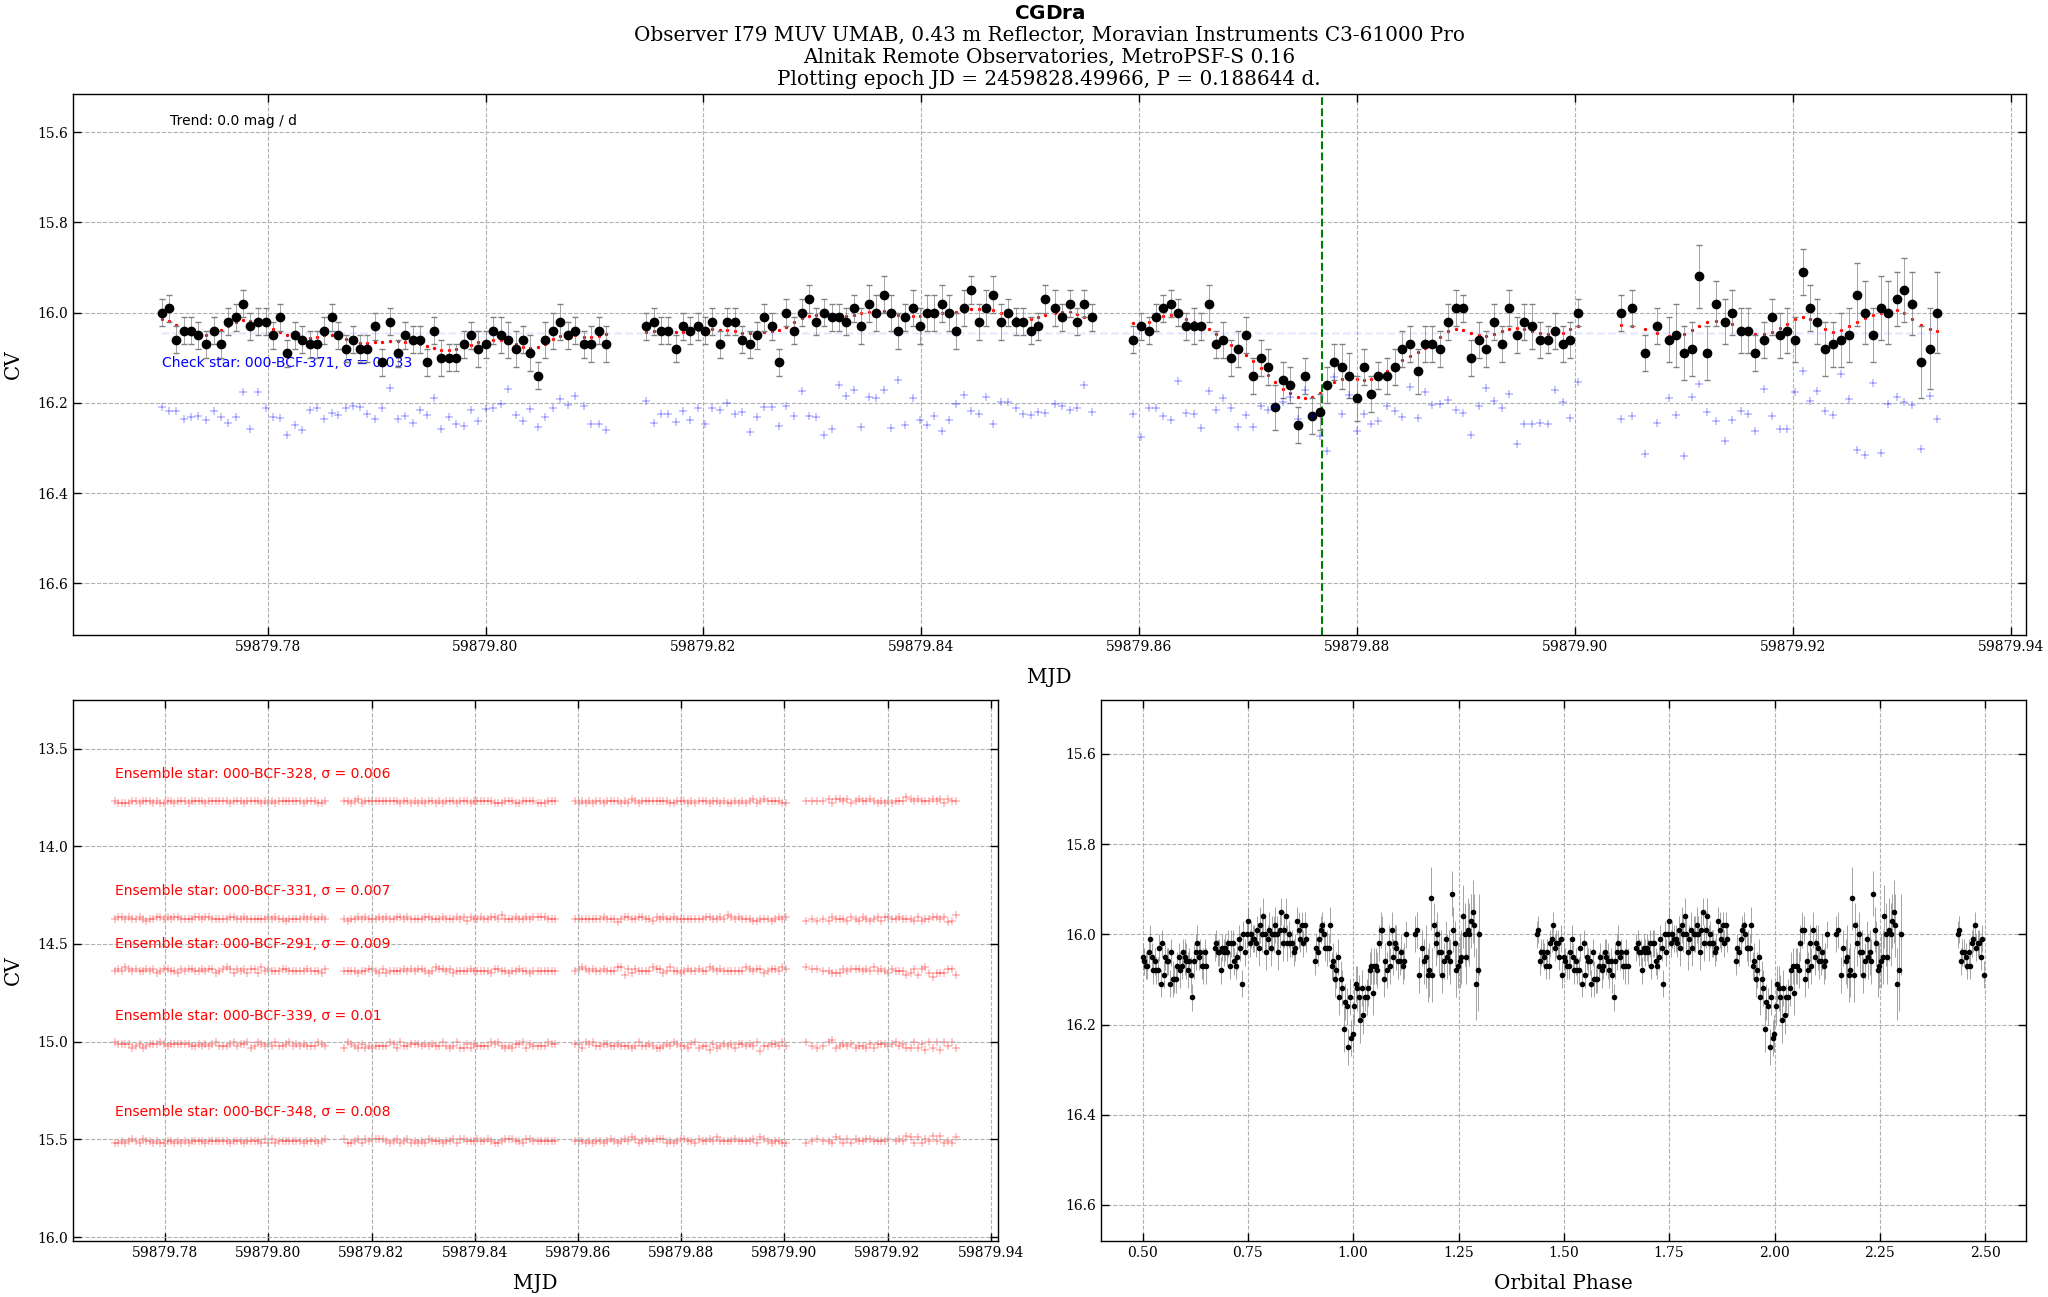
Maxim UsatovParticipantEclipses No(s): 106
State: Quiescence
Bad conditions due to clouds, but we can still make out U/N/A-type profile.
MaxAttachments:
Maxim UsatovParticipantEclipses No(s): 105
State: Outburst
U/H/PEH profile – now seen at all stages of CG Dra except the bright outburst stage.
MaxAttachments:
Maxim UsatovParticipantEclipses No(s): 104
State: Rising
Accretion disk-dominated U/L/S eclipse profile. Appears to be acceptable quality data even during the Moon up high.
MaxAttachments:
Maxim UsatovParticipantEclipses No(s): 103
State: Quiescent
U?/N/A.Attachments:
Maxim UsatovParticipantEclipses No(s): 102
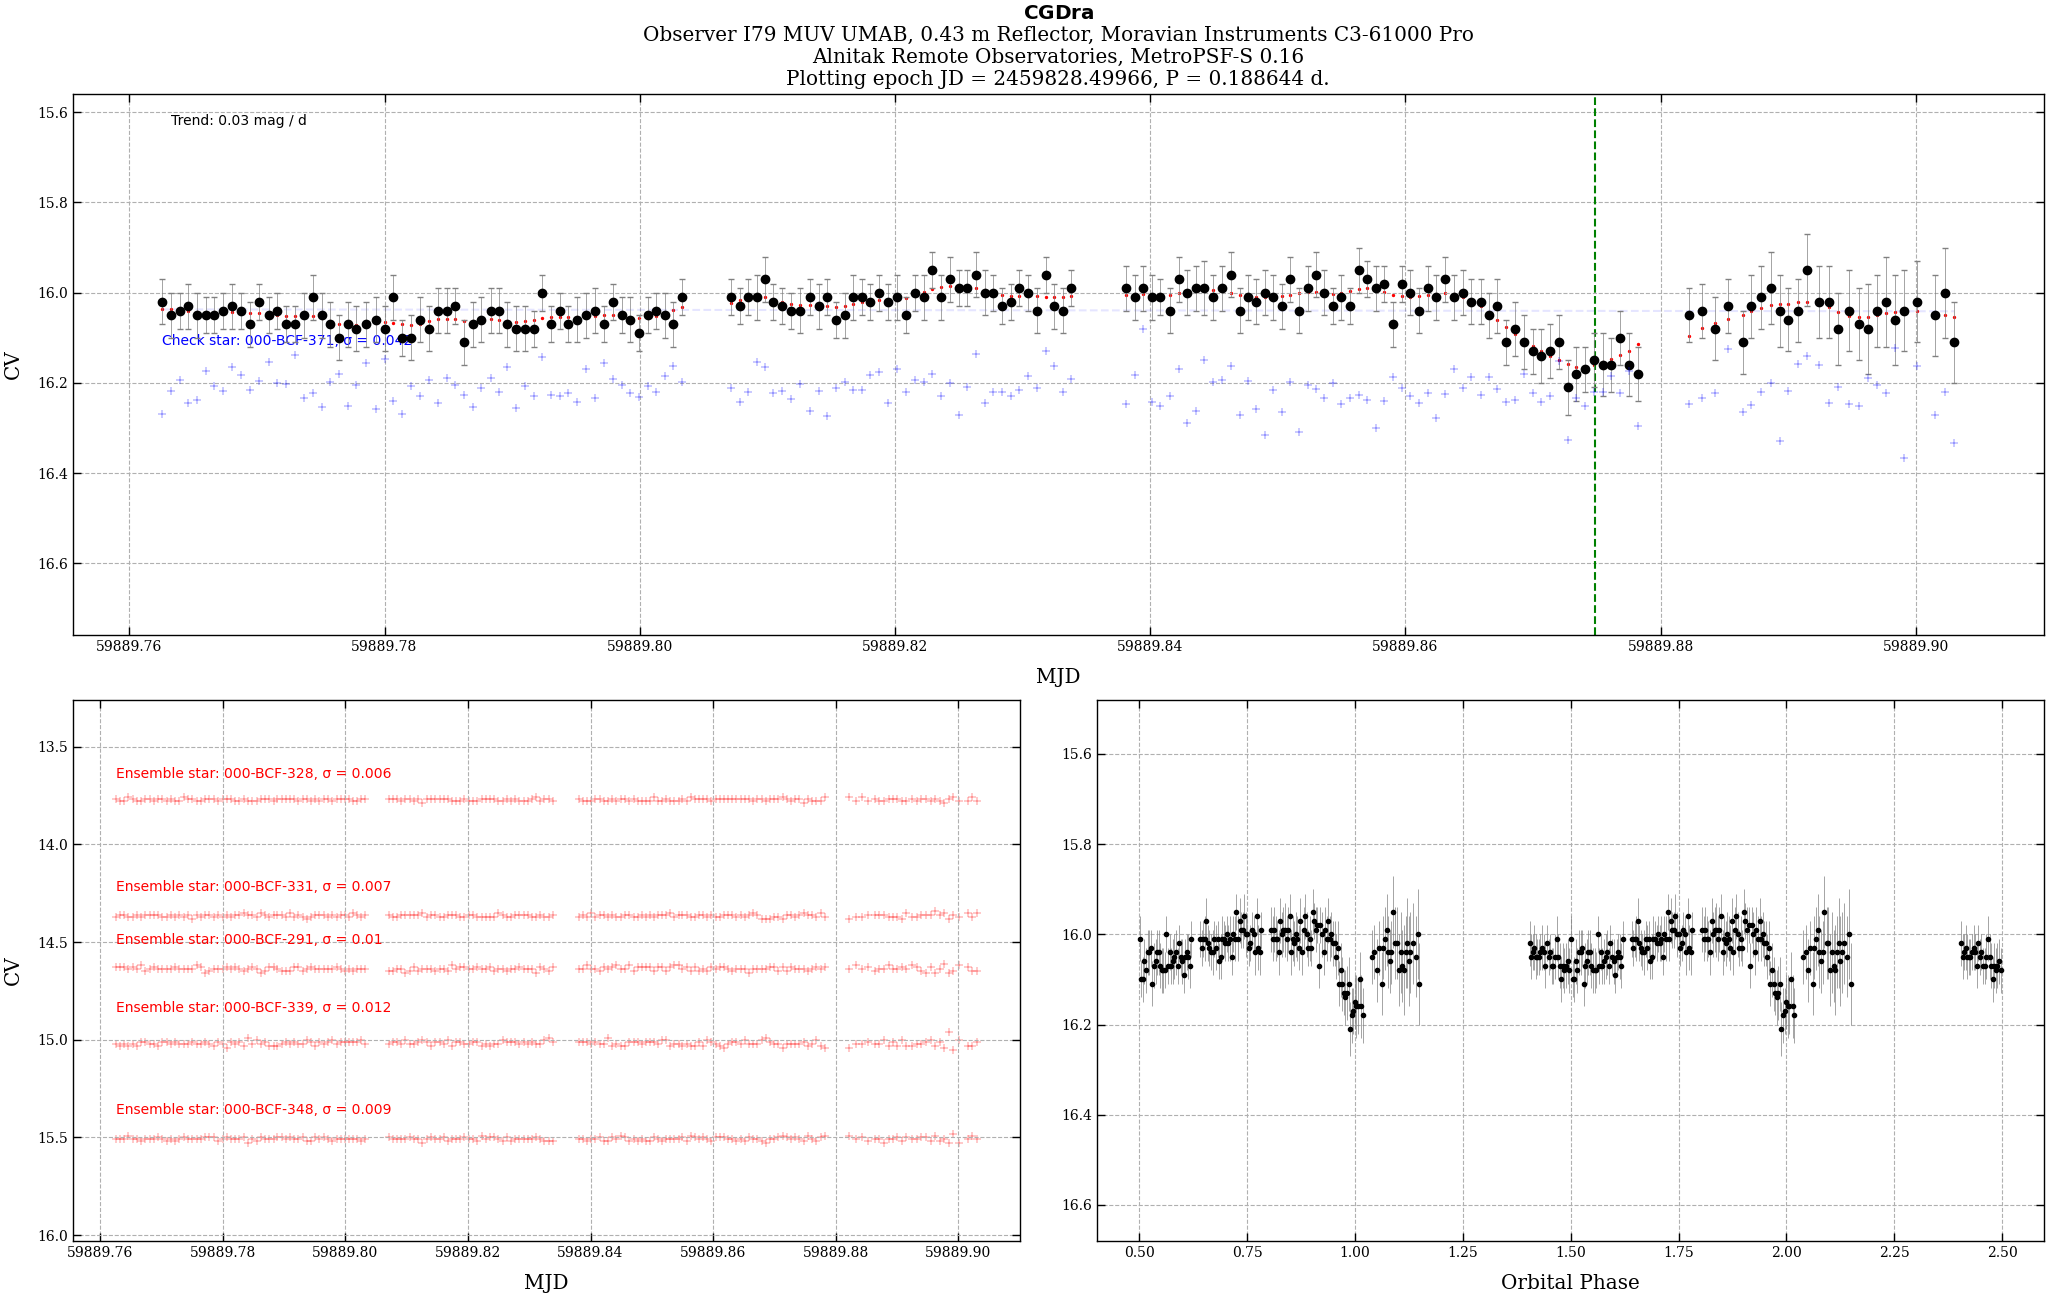
State: FadingAppears to be U/H/PEH again, first seen during the fading stage. Prolonged standstill on the egress, potentially signifying a compact bright spot. Assuming this is correct, post-egress hump (PEH) could be explained with an optically think accretion disk, and not an extended bright spot, although we have seen PEHs appearing during outburst stages as well.
Max
Attachments:
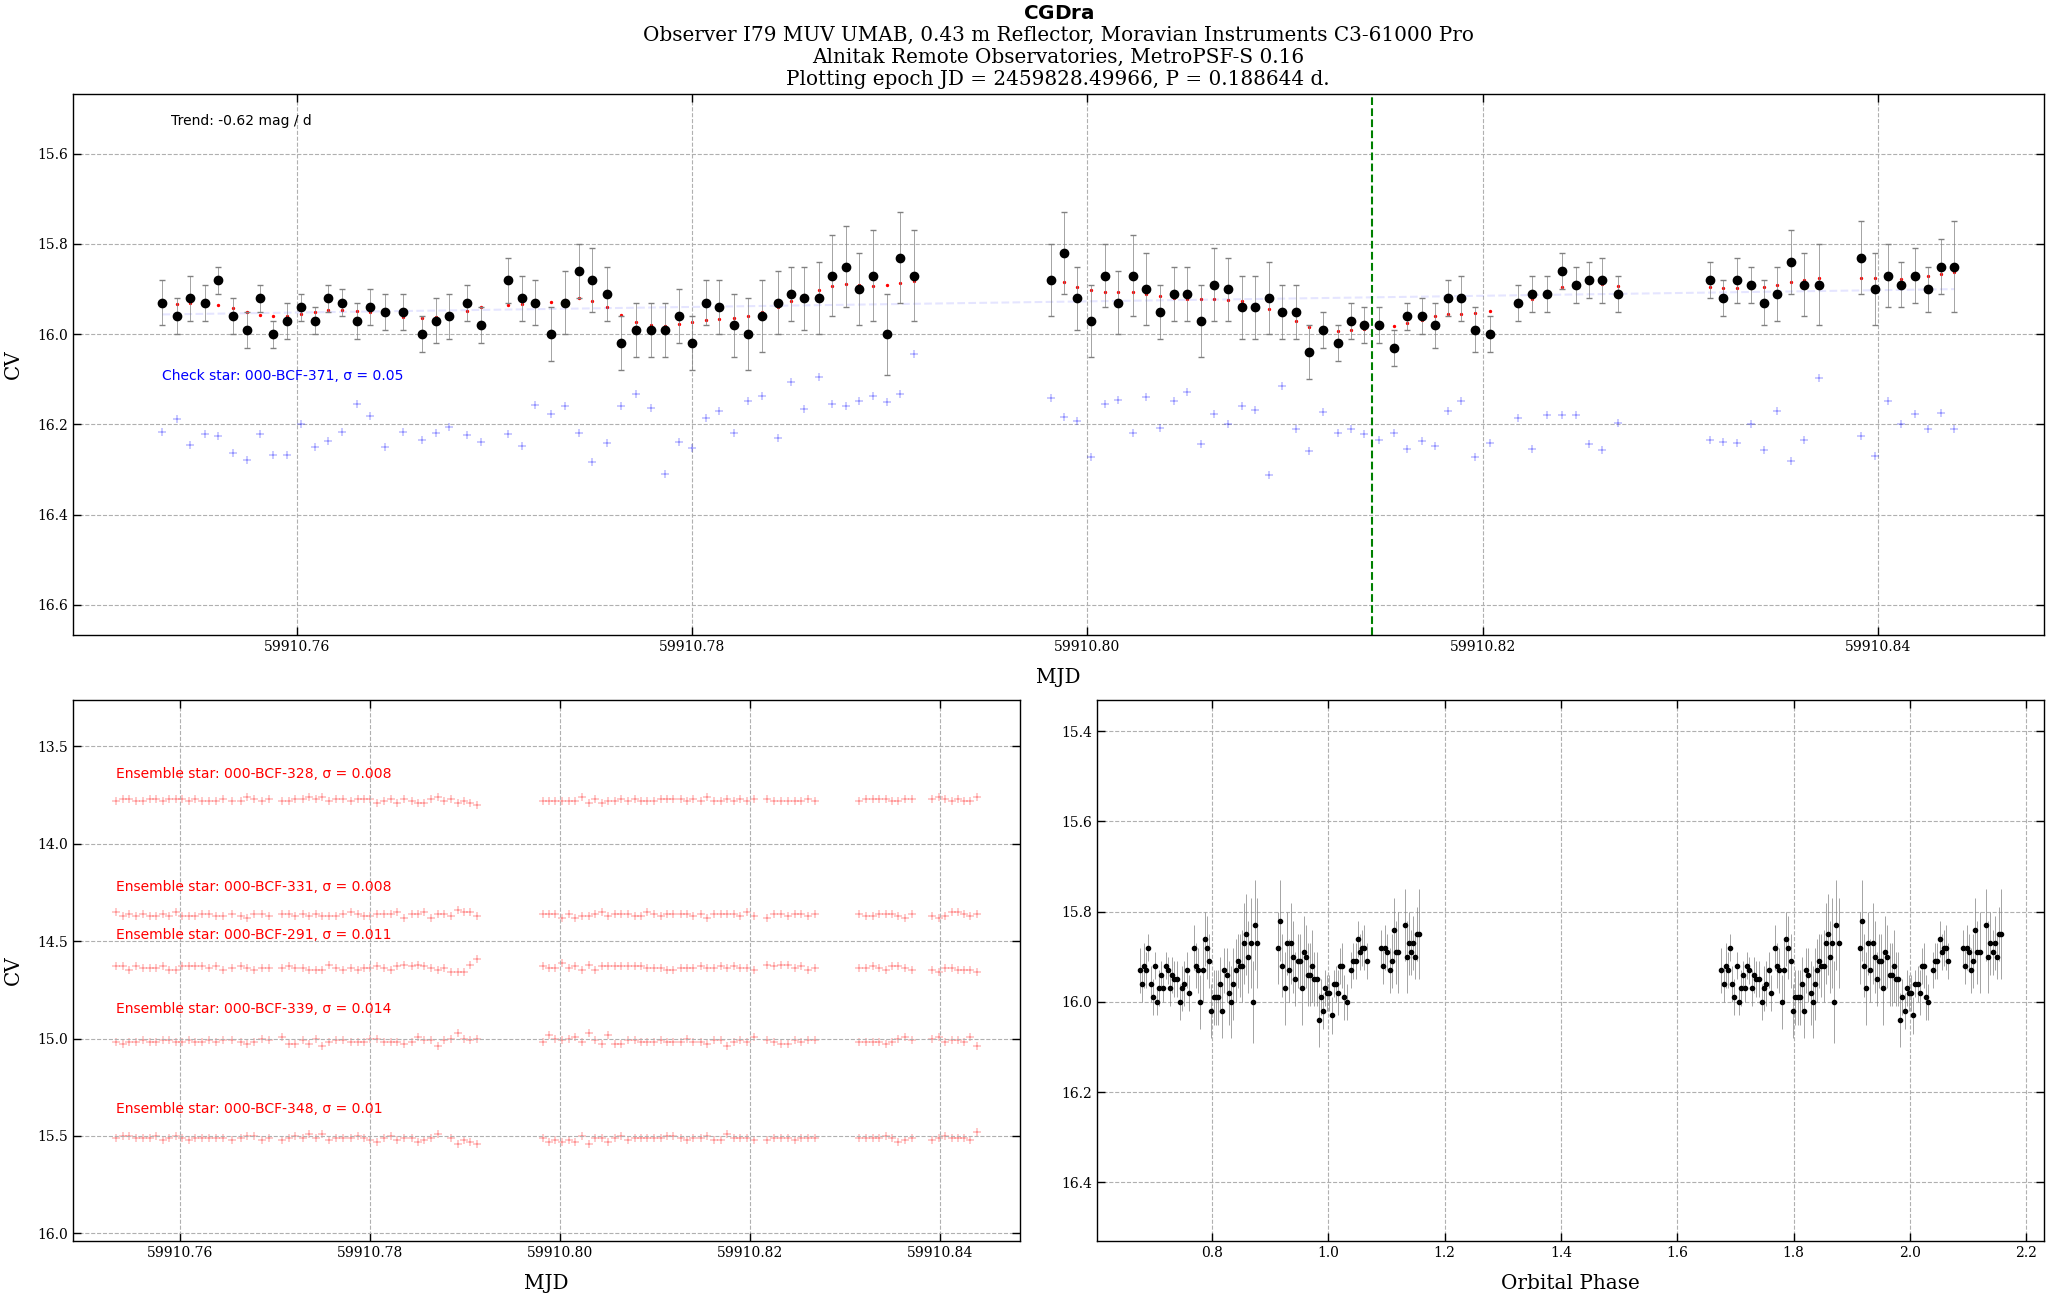
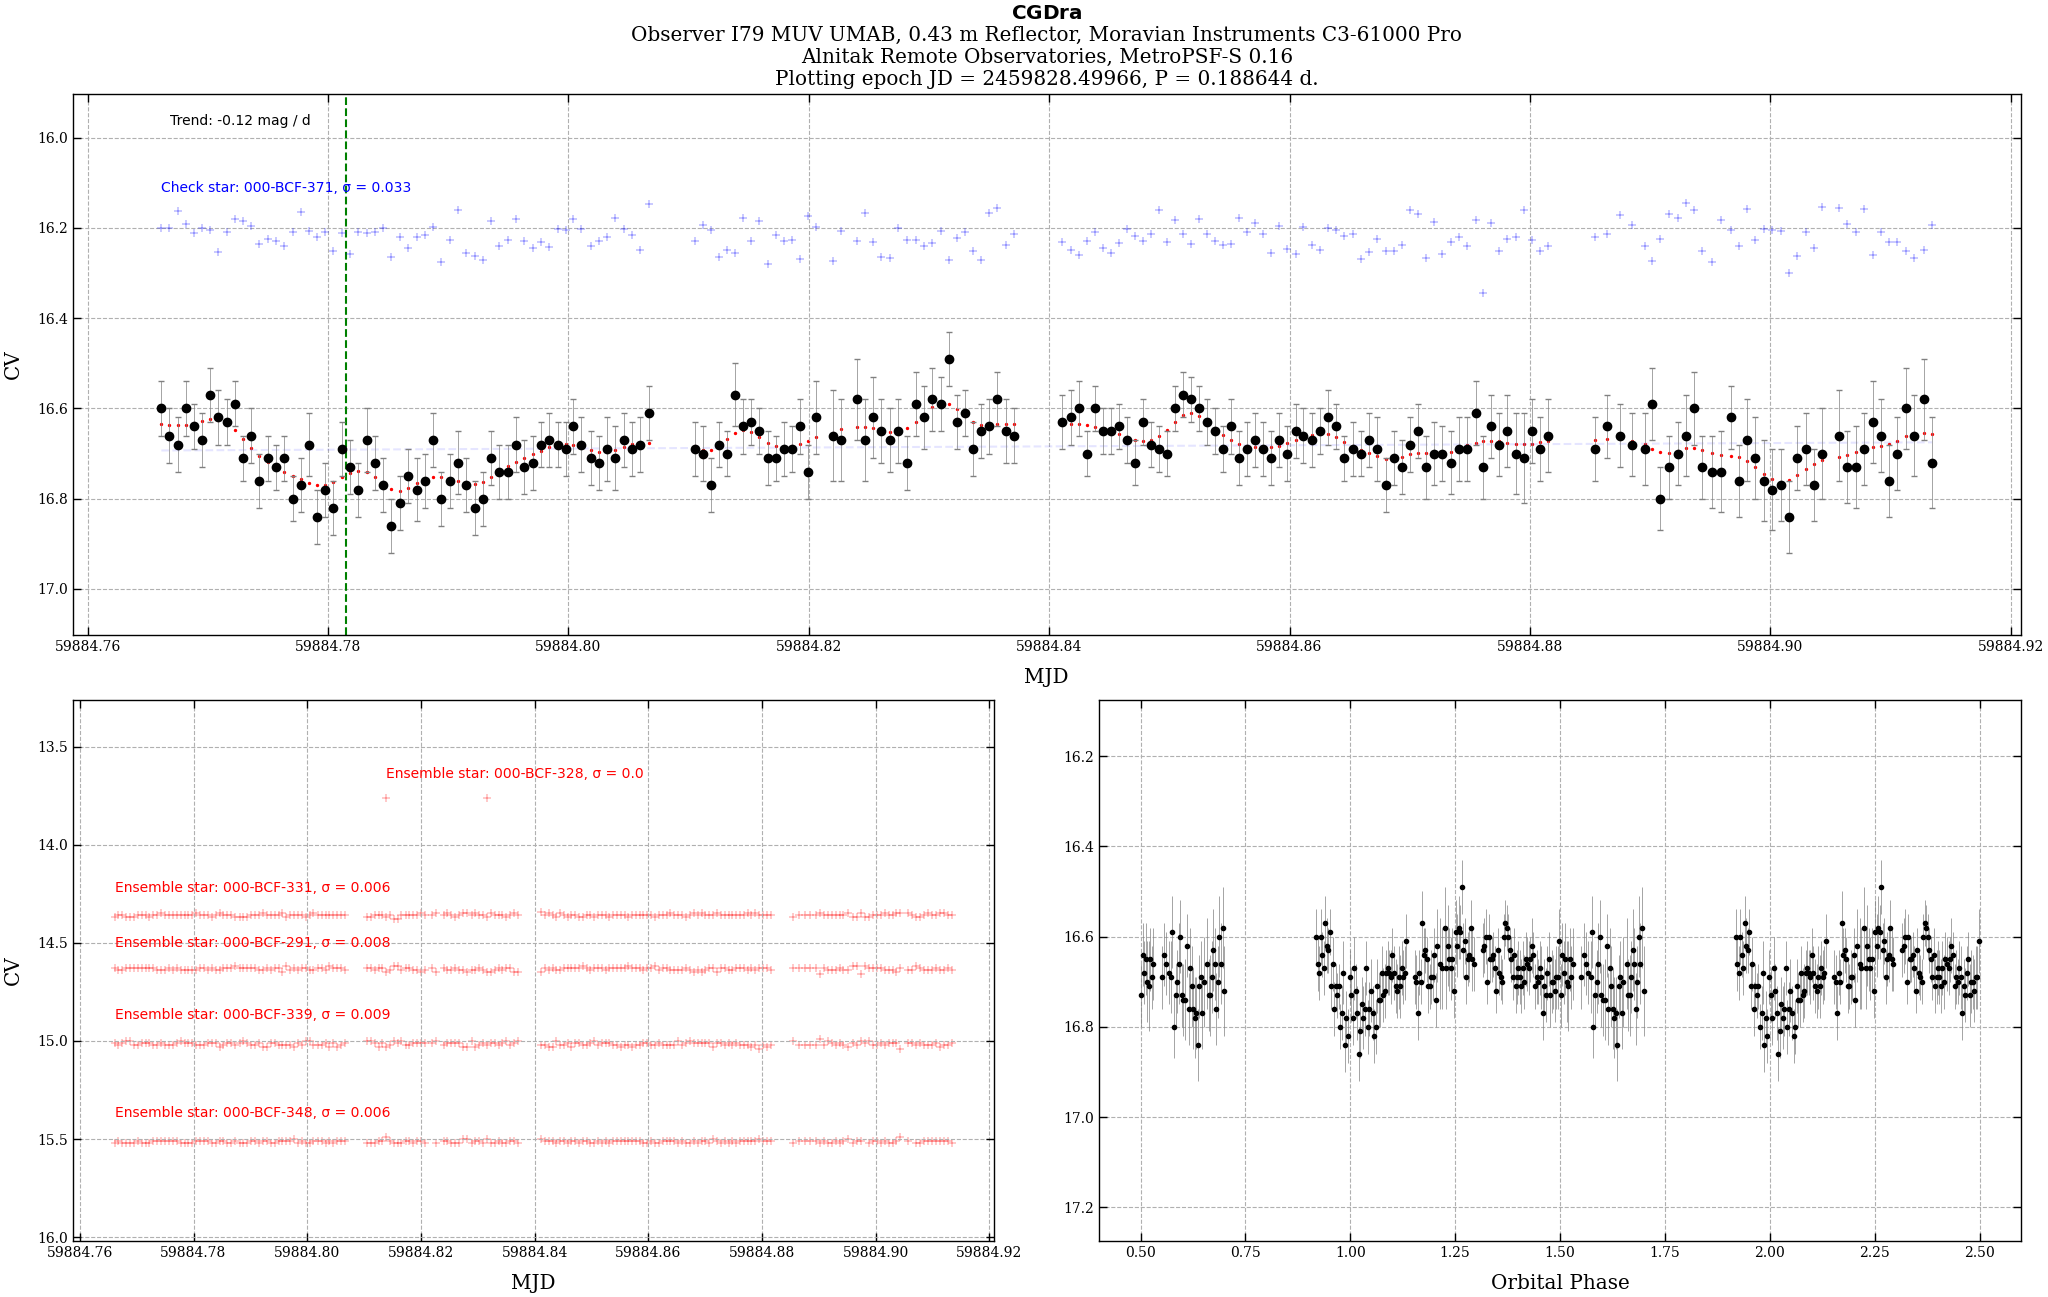
Maxim UsatovParticipantEclipses No(s): 101
State: OutburstJust when I thought I’ve seen it all, yet another surprise from CG Dra. The data is noisy, as it’s getting low on the sky, slightly over 30 degrees at midnight, with the Moon visible early in the night and clouds interfering throughout. The profile appears to be U/L/PEH – U-shaped, low orbital hump, post-egress hump (PEH), however, PEH appears to be very wide, lasting about half of cycle. Almost like an anti-phase orbital hump. I don’t remember seeing this profile before. Note, also, a single spike to almost 15.6 magnitude.
Max
Attachments:
Maxim UsatovParticipantThank you very much for organizing this, Jeremy!
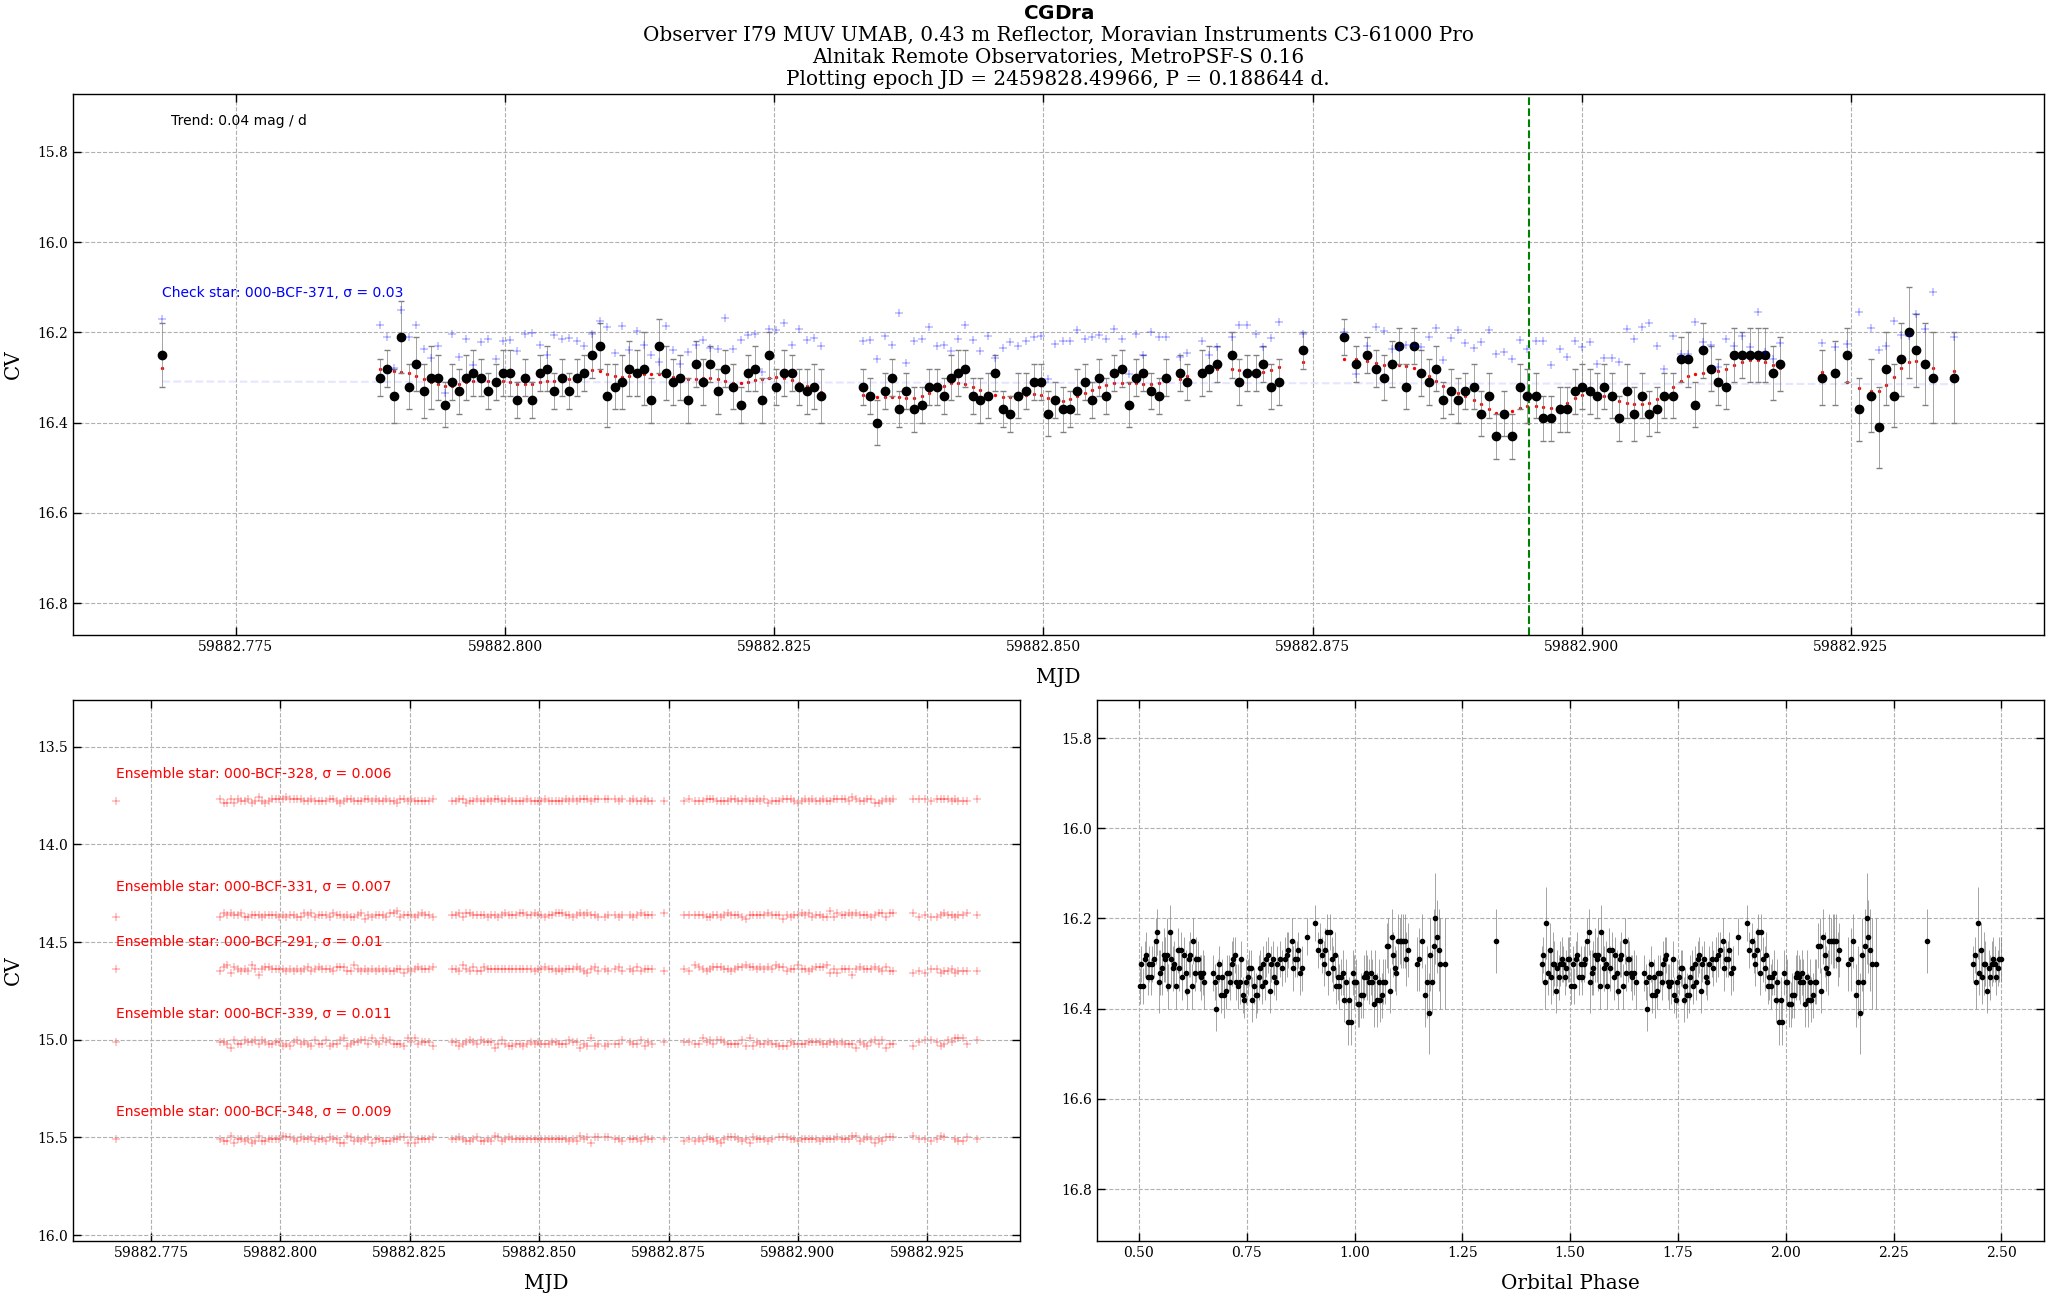
Maxim UsatovParticipantEclipses No(s): 100 (didn’t show a pic for 99th, partial data)
State: Outburst
U/L/S-type eclipse.Attachments:
Maxim UsatovParticipantThese are exactly the cases where the algorithm has failed to fit a Gaussian due to noise or partial data. I also need to resample the data to a finer grid, as described by KvW, to refine the result.
Maxim UsatovParticipantEclipses No(s): 98
State: Quiescent.
U/N/A-type eclipse.Attachments:
-
AuthorPosts