Forum Replies Created
-
AuthorPosts
-
 Robin LeadbeaterParticipant
Multiple wrongly directed links from
https://britastro.org/section_information_/equipment-and-techniques-section-overview/spectroscopySpectroscopy workshop at the Norman Lockyer Observatory October 2015
Alpy 600 Spectrograph workshop, Kintbury, October 2016
Observers’ Workshop on Variable Stars, Photometry and Spectroscopy, 29 Sep 2018
Using low resolution spectroscopy to confirm and classify supernovae (video from BAA meeting January 2018)
Starting in Spectroscopy (video from BAA/AAVSO joint meeting on variable stars, July 2018)
Pushing the limits using commercial spectrographs (video from BAA/AAVSO joint meeting on variable stars, July 2018)
Towards full automation of high resolution spectroscopy (video from BAA/AAVSO joint meeting on variable stars, July 2018)
HST CALSPEC calibrated absolute flux spectra for converting relative intensity to FLAM unitsEDIT No idea where the graphic came from, I just entered the address of the page
“https://britastro.org/section_information_/equipment-and-techniques-section-overview/spectroscopy”-
This reply was modified 4 years, 4 months ago by
 Robin Leadbeater.
Robin LeadbeaterParticipantIs there a way to stay permanently logged in like on the old site ?
Thanks
RobinRobin LeadbeaterParticipantEven allowing for the trailing, that looks quite a bit fainter than the mag 13 Nick reported on 5th. The adjacent bright star is SDSS J081542.48+144838.9 at g mag 15
Robin LeadbeaterParticipantA low resolution spectrum taken last night (3 hours exposure) showing a very broad H alpha emission with velocities up to +-12000km/s
https://britastro.org/observations/observation.php?id=20220207_205606_9d5b2259183a3d41
Cheers
Robin
Robin LeadbeaterParticipantThanks Nick,
I’ve found the original preprints of Comets II are available to download from the Lunar & Planetary Institute. Plenty of reading there !
Robin LeadbeaterParticipantHi Maxim,
Thanks for the reference. ( I am on a steep learning curve here !) I can understand how the Swings effect could enhance or suppress the strength of the resonance emission due to the velocity relative to the sun (The distributions are normalised relative to the intensity at the coma centre so don’t show the absolute strengths) but I don’t follow how that could alter the shape of the CN distribution. Would this be due to the resulting radiation pressure sweeping the CN away from the coma into the tail, like Sodium in 2020 F3 ?
That reference to parent molecules and the Haser model on your Fernandez page 68 did remind me of some comments from Jeff Morgenthaler of the IoIO team on my F3 cross sections.
“CN is produced from a parent molecule, likely HCN. The combination of that double process ends up extending the lifetime of CN to photodissociation (destruction by sunlight). I have not done the conversion of angular scale to distance from the comet on your night of observation, but the characteristic scale length of CN emission when comets are at 1 AU from the sun tends to be about 20,000 km. C2 is a little weirder in terms of parent molecules. It seems to have two dominant ones, leading to a flat profile in the inner few thousand km of the coma. Then it drops off with a profile slightly shorter than CN.”
So perhaps I need to consider the effect of sunlight on both the rate of production and destruction of CN and C2 and follow up on the Haser model.
Thanks
Robin
Robin LeadbeaterParticipant“Is CN also broken down by sunlight, though at perhaps a slower rate than C2 ?”
Actually, answering my own question it looks like that cannot be the explanation as CN is seen widely distributed in the cross section through the tail of 2020 F3. Any ideas of what is going on?
Robin LeadbeaterParticipantSo.. I went looking for what Lee Feinberg actually said in the teleconference. He did indeed say it could be seen with binoculars in Ursa Major, but…… he was talking about the target they were going to use to collimate the mirror (HD84406)
https://www.youtube.com/watch?v=VmD8pefGG2k&t=949s 39 minutes in
Robin LeadbeaterParticipantTo be fair, NASA do have access to some pretty large binoculars !
Robin LeadbeaterParticipantPhew! Now lets hope all the 126 actuators which align the mirror segments work ok. The number of moving parts in the instruments is mind boggling too. NIRSpec apparently has a matrix of a quarter of a million focal plane “microshutters”
Robin LeadbeaterParticipantPerhaps past citations where available could also be added as links from the list of recipients? As well as of individual interest it would reflect the overall achievements of the Association and its members as a whole.
Robin LeadbeaterParticipantI don’t think they are published consistently. I remember looking for my 2019 Merlin Medal in the Journal and could not find one. I recall it was not mentioned at the meeting when I received it either so AFAIK there is no public record of why I received it.!
Robin LeadbeaterParticipantI took another quick look, dodging the showers under poor conditions, this time with the very low resolution faint object setup.
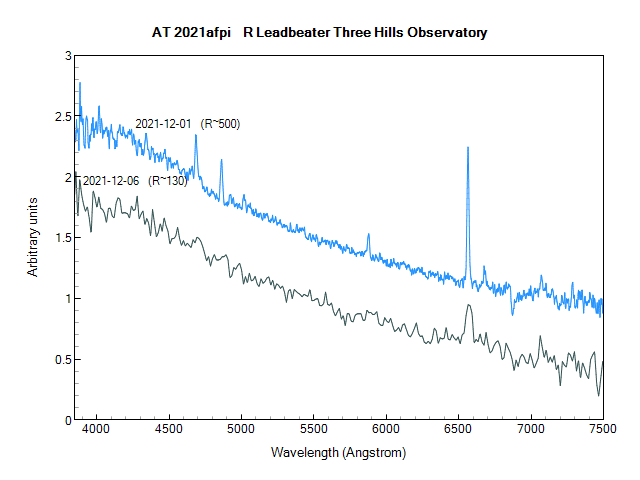
The emission lines are very narrow (which confirms it is not a classical nova) so do not show well at the lower resolution but the blue continuum is unchanged.
Robin LeadbeaterParticipantThe angular size of the lensed star could be inferred from the Gaia parallax, the apparent magnitude and the spectral classification.
Robin LeadbeaterParticipantI can’t offhand think of any way this could be determined spectroscopically. Do you have a suggestion? I am guessing that might be one of the parameters in the light curve fit but I don’t know the details.
Cheers
Robin
Robin LeadbeaterParticipantHere is a similar event back in 2006 which went from mag 11.5 to mag 7.5. There were several papers on this eg this one with members of the amateur community (BAA/CBA etc) as co-authors
https://ui.adsabs.harvard.edu/abs/2008ApJ…677.1268G/abstract
which deduced the lensing object was likely a low mass star or brown dwarf. Their paper also suggested that it could be a a productive technique for discovering exoplanets.
(I believe my first (crude slitless) spectrum was the earliest of this object which alerted the community that this was something unusual though as far as I know that was not mentioned in any of the subsequent papers). I remember there was considerable scepticism at the time as lensing of such a bright target was considered unlikely but there have been a few more bright ones since then.
Cheers
Robin
Robin LeadbeaterParticipantYes the spectrum will be a blend but the lensing object must be very much fainter (or spectroscopically similar) as there is no evidence of any change in the spectrum even though the total brightness (driven by a change in the brightness of the lensed component) changed by a factor of ~25 (3.5 mag) I am not an expert on lensing but I think once we have a complete model we may have a distance and mass for the lensing component. That would also give an idea of how far back in time they would have been resolvable. Perhaps historical deep images would show something? (Of course not if it is a black hole though)
Cheers
Robin
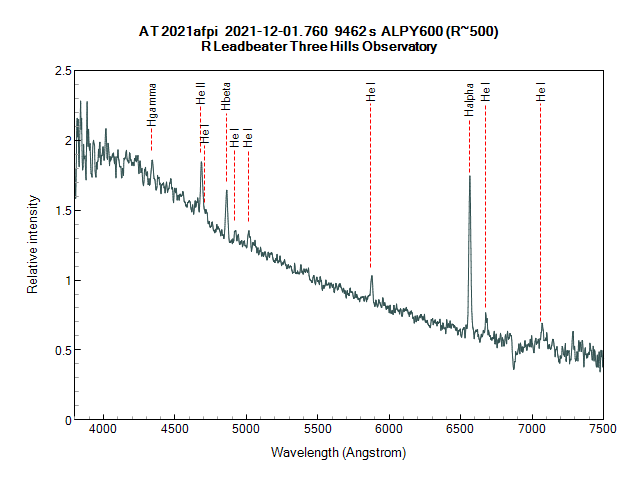
Robin LeadbeaterParticipantHere is the spectrum (~12A resolution) last night
Cheers
Robin
 Robin LeadbeaterParticipant
look out for a ASI120M, they came with a wide angle lens eg currently
https://www.astrobuysell.com/uk/propview.php?view=180950
but better in mono (and the price of this one is too high, they were only about that new)
Cheers
Robin
Robin LeadbeaterParticipantAs well as my classifying spectrum mentioned in VSSC 190, I now have four spectra following this event as it faded down to ~16.3 g. (No change within the uncertainties as expected)
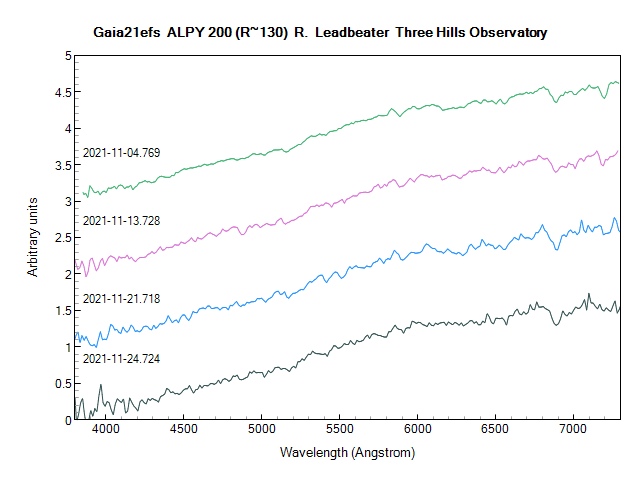
The spectra are in the BAA spectroscopic database but I will also put something on my BAA observations page sometime in the next few days with a few notes about them.
Cheers
Robin
-
This reply was modified 4 years, 4 months ago by
-
AuthorPosts