Forum Replies Created
-
AuthorPosts
-
 Robin LeadbeaterParticipant
I am wondering if using the AOD technique to do a second order extinction correction coupled with our standard reference star technique as a first order correction might be useful, reducing the need to chose the reference star precisely at the same elevation as the target. ie The MILES star need not then be at the same elevation, as the effect of the difference in air mass is calculated separately using a typical AOD.
Robin
Robin LeadbeaterParticipantHi Paul,
Yes it is described in part 4 of the link I posted above.
http://www.astrosurf.com/buil/calibration2/absolute_calibration_en.htm
It seems to be what the pro I talked to was suggesting too. ie separating out the instrument response (which is presumed stable so measured infrequently) and extinction (measured on the night and adjusted for air mass using the AOD)
Cheers
Robin
Robin LeadbeaterParticipantHi Andrew,
Yes I agree, this is an area which definitely needs more consideration. Even Pro-Am campaigns are rarely specified beyond a SNR figure and in most cases I suspect these sort of systematic errors are much greater than the stochastic ones that SNR estimates, and much harder to quantify. These problems are not confined to amateur observations and databases either. For example the continuum of the ELODIE Vega spectrum originally incorporated into ISIS and which has probably used to correct hundreds of spectra in BeSS, is significantly in error.
http://www.spectro-aras.com/forum/viewtopic.php?f=8&t=1369#p6205
and the Indo-US library spectra sometimes suggested as reference stars have a completely synthetic continuum based on Pickles
http://www.spectro-aras.com/forum/viewtopic.php?f=8&t=1582
Cheers
Robin
Robin LeadbeaterParticipantHi Tony,
I have only a couple in BeSS (I also have a few BeSS candidate spectra but those stars are not in BeSS yet)
They are also in the BAA database so you can pick them up there. Note that the V361 Per spectrum there is as I submitted it to BeSS but the BD+55521 is the version outputted by BeSS so has extra fields in the header which BeSS adds.
They are both very noisy but my excuse is they are high resolution spectra at mag 10 so a bit of a challenge.
Cheers
Robin
Robin LeadbeaterParticipantHi Tony,
I need to think about doing it that way as I think ISIS normally does some internal rescaling rather than outputting in ADU counts so the final spectra may not subtract correctly. (you would need to test this) What I was proposing is to produce a single pre processed spectrum image manually with the dark, flat correction and the sky image subtracted already, ready for processing in ISIS without any further dark, flat bias correction or background subtraction to produce the spectrum profile but ISIS may then complain if it is not given any master dark or bias frames.
It seems this might not be as straightforward in ISIS as I thought. Perhaps putting the question on ARAS might be a better bet. Francois Teyssier there would know how to do it in practise.
Cheers
Robin
Robin LeadbeaterParticipantHi Andrew,
A wide “photometric” slit is certainly needed for absolute flux calibration of course but in my experience, provided precautions are taken I have found it is possible to consistently get “reasonable” (+-10% say above 4000A) broad continuum relative flux calibration with my setup using a slit width the same order as the star PSF.
(Except for the effect of changing focus on the original run and an example of the effects of scintillation on the latest run, the continuum errors my two runs using MILES stars I have documented here have been reasonably under control. You can also see some comparisons with professional spectra in what is perhaps a worse case scenario of faint targets using the modified ALPY 200 here.
http://www.threehillsobservatory.co.uk/astro/spectroscopy_20.htm
Comparisons between observers on the same object posted on the ARAS forum using the reference star techniques are also usually (but with admittedly some exceptions) consistent.
Perhaps my success though is due to the not particularly good guiding performance which effectively scans the centre of the star image across the slit.
Speaking to a professional recently, this sort of thing is tough for them too and their approach seemed to be to specifically measure the instrument response using standard stars only occasionally on photometric nights, removing the effect of the atmosphere by measuring at different air masses and then measure just the atmospheric extinction during the observing session, typically making one standard star measurement and correcting for air mass using an atmospheric model generated for their particular local conditions. This gets round the problem of having to find a reference star close to the target but does not address the problem of selective wavelength sampling at the slit which may be what we are seeing here, though I believe that is yet to be proved. (David, perhaps you could try running with a wider 35um or even 50um slit to see if you get any improvement?).
Buil’s ideas on spectrophotometric measurements using a combination of wide and narrow slits are probably worth thinking about in this context too, though adopting the 4 spectra measurement every time would reduce throughput significantly and might still give extinction errors with our fickle weather.
http://www.astrosurf.com/buil/calibration2/absolute_calibration_en.htm
Professionals though probably measure with the slit orientated at the parallactic angle and their CA and positioning and guiding errors are likely much lower than ours in general so perhaps selective sampling at the slit is not a big issue for them
Cheers
Robin
Robin LeadbeaterParticipantHi Tony,
I am not a Be star expert but I would have expected the continuum to be that of the corresponding B star ie a typical hot star spectrum rising towards the blue end. On that basis the flat spectra and that one which dips down at the blue end look strange to me. The stars may be reddened by interstellar extinction though I suppose. For a more experienced view you could ask on the ARAS forum.
Cheers
Robin
Robin LeadbeaterParticipantHi Tony,
If the nebula extends beyond the length of the slit and you want to produce a flux calibrated spectrum then yes, you need to take a separate sky background spectrum image of the sky near the nebula under as near as possible the same conditions and with the same exposure time. I would then preprocess them all with bias, darks and (halogen)flats as usual then subtract the nebula image from the sky image to produce a final image ready for extracting the spectrum profile as usual (without any background subtraction). The instrument response calculated from a nearby reference star is applied in the normal way.
Cheers
Robin
Robin LeadbeaterParticipantHi John,
Your response calculation technique looks sound, otherwise you would note get a good match when applied to the reference measurement. It does seem though that something must have changed between the observations. There are a few things to check
I ran into a similar problem when I first attempted this type of exercise soon after I got the ALPY. In this case it was due to a combination of chromatic aberration and a shift in focus. I have attached the details.
Combinations of chromatic aberration, atmospheric dispersion, focus and the position of the star on the slit can all conspire to give these sort of problems. Christian Buil has a particularly scary page on the problem somewhere. I will see if I can dig it out. Having said that your C6 without focal reducer I would guess does not suffer from too much CA.
Other things to watch in processing is to make sure your binning zone includes all the spectrum and the background zones are free from any spectrum data. If you use the optimised binning in ISIS try switching it off as I found the similar feature in VSpec could distort the spectrum under some circumstances.
Cheers
Robin
EDIT: here is the link I was looking for
Robin LeadbeaterParticipantRe darks:- With my extremely faint supernova spectra, I no longer do a traditional dark correction though i still take them to produce a defect map and use this with the bias frame. I have not taken that step with other spectra yet though. I use cloudy nights to take darks so I have plenty of opportunity to take very large stacks !
re flats:- I always take and use them with slit spectra as I find it is the only way to accurately remove some fine scale QE variations (QE ripples at low resolution and interference type effects at high resolution). Getting a big enough stack to avoid introducing noise without getting saturation is a problem with a halogen flat source and wide spectral range though. (eg ALPY). Again cloudy nights come to the rescue here.
For slitless work I have come to the conclusion that flat correction is effectively impossible so just take a flat so I can avoid any obvious defects and position the star zero order (target and reference) in the same place in the field.
Robin
Robin LeadbeaterParticipantConcerning rectification, I think it depends to what use you are going to put the spectrum. For your own personal use or in a specific study, you just need to do what is required for that application (Which as an extreme example could be all about as accurate as possible wavelength calibration and nothing needed concerning flux calibration if all you wanted to know was the RV) .
The problem comes where you might be uploading data to a general database where you do not know to what use the data is to be put. The rule I apply (which is the philosophy behind the BeSS database) is that you should do all reduction that the user cannot do (eg wavelength calibration, flux calibration by correcting for instrument response) but not steps that the user could do for themselves (eg heliocentric correction, rectification, telluric removal). making sure that the appropriate flags are set in the header.
In this specific case however, If I was uploading this to a database, I would rectify it. To upload it as is including the continuum would be misleading. The reason is that the continuum shape is completely artificial having been made to fit that of a typical star of similar spectral type. For all we know this might bear no resemblance to the actual spectrum. By rectifying it, we are not losing any data, since the continuum shape is not derived from the spectrum and the user should they wish, could add back the continuum shape using their own typical B star spectrum.
Concerning measurements on rectified spectra, EW measurement of absorption lines is no problem as they are measured relative to the continuum. Measurement of emission line strengths is problematic though as the actual flux in the line is usually the important parameter rather than the EW (as in general emission and continuum flux are not related) and measuring the relative strengths of these at different wavelengths (even in relative flux) requires a non rectified accurately flux calibrated spectrum.
Robin
Robin LeadbeaterParticipantHi Kevin,
I don’t know 48 Per specifically but I think what you see is typical in some Be stars. The Be star spectrum is a combination of the normal main sequence B star (dominated by broad winged Balmer lines with He also) plus a Balmer line emission component from the disc, H alpha being the strongest but also sometimes in H beta if the emission is strong. If the ssytem is seen pole on as would seem to be the case here, then there is no doppler component from the rotation of the disc so the emission is a single narrow line which is narrower than the photospheric absorption line (because of the lower gas density in the disc). When the two are superimposed, the H alpha emission can dominate, hiding the whole absorption line including the wings, but where the emission is less as here in H beta we still see the photospheric absorption line with a small emission in the central core. (The same effect is also sometimes seen at H alpha in cases where the emission is particularly weak.)
Robin
Robin LeadbeaterParticipantHi Kevin,
My guiding is also bad enough to get round this problem but there is a good example of this by Tim Lester who has a superbly stable setup running at a resolution R~9000 where in this case his good guiding and sharp star image worked against him.
http://www.spectro-aras.com/forum/viewtopic.php?f=8&t=1240
Cheers
Robin
Robin LeadbeaterParticipantHi Kevin,
Yes ISIS is not very good for comparing and examining spectra. I usually go to VSpec for this but I expect BASS also does this better than ISIS.
This peak in the instrument response can be a problem to correct for accurately for even using a A or B star. Here is the shape of my ALPY instrument response as generated using ISIS (ie including a correction for the lamp black body curve)
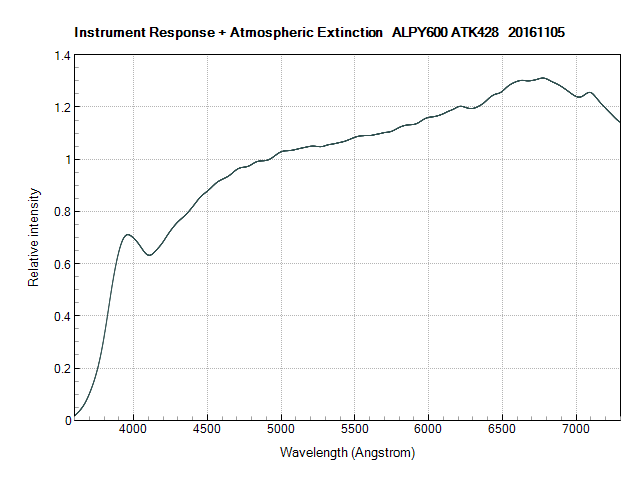
The key is to take care to remove the residual Balmer lines and not to over smooth when generating the instrument response. You can see the hump in the problem area in my instrument response here. It is important it is reproduced accurately in the instrument response. If it is flattened out too much when generating the instrument response it generates a hump in the corrected spectrum.
Cheers
Robin
Robin LeadbeaterParticipantHi Kevin,
Just noticed on your posted spectrum plot that the wavelength scale is way off for some reason
Robin
Robin LeadbeaterParticipantHere are some brief tests I made on the precision of RV measurements with my ALPY
http://www.spectro-aras.com/forum/viewtopic.php?f=8&t=618
Note though these measured the precision/repeatability not absolute accuracy of wavelength calibration
Robin
Robin LeadbeaterParticipantHi Kevin,
Re-reading my post this morning it is a bit rambling so I thought I would summarise my thoughts.
The repeatability of the ALPY is good enough to measure a to wavelength precision of 1.5A given good technique (eg to detect relative changes in radial velocity in a given target) but an absolute accuracy of 1.5A is probably at the limit or perhaps beyond it without an external reference.
Even 1.5A precision can be challenging as many factors come into play at the sub pixel precision level. For example you mentioned the potential skewing of line profiles due to two or more stellar components. A similar effect can occur instrumentally if for example your star is slightly offset in the slit so the measurement is made on the downward slope of the star point spread function. The resulting shift in the centroid of the line can be significant at the sub pixel level. If high wavelength precision is specifically needed with a slit spectrograph then making sure the star image is significantly larger than the slit and even deliberately dithering the star across the slit can help. (fibre fed spectrographs have the advantage here as they scramble any gradients across the fibre aperture)
BTW did you take account of the intrinsic RV of the star (19.8km/s from SIMBAD) and the heliocentric correction which might account for some of the difference ?
Cheers
Robin
Robin LeadbeaterParticipantHi Kevin,
A nice result. the Ca H, K lines are showing up nicely in the violet. If you mean the broad hump around 3950A, I have seen something similar on occasion and I suspect it may be an instrument response problem. The raw instrument response from flat corrected spectra produced by the ALPY peaks sharply in this region, for my instrument at least and it is in the area where the Balmer lines are crowding together so it is difficult to fit the response curve accurately around this wavelength. ISIS attempts to mitigate this to some extent by internally applying an assumed black body spectrum for the flat lamp which tends to flatten the measured instrument response but I dont know if Demetra does anything similar. Have you tried running your reference star spectrum back through Demetra using the calculated instrument response to double check that it ends up looking like the reference?
Cheers
Robin
Robin LeadbeaterParticipantIf it is a radial velocity effect, the wavelength error should be proportional to the wavelength ie the error should be greater at H alpha than at H gamma say. If as you say the error is roughly constant in wavelength and given that Demetra is in beta testing, I think I would double checking against a reduction done using ISIS for example in case Demetra is incorrectly measuring the relative positions of lamp and star spectrum for some reason.
Small absolute calibration offsets between internal lamp and the sky are not uncommon though, due to slight differences in the geometry of the light paths and we are talking a fraction of a pixel here so even if the error persists, it may not be anything connected with the star. (Are you seeing it consistently on any other stars?) Measurements of the solar spectrum (eg the daylight sky) can be used to quantify these sorts of instrumental offsets.
Another thing to check is instrument stability. I measured my ALPY to be very stable but changes in temperature and orientation can produce small shifts. Did you measure the lamp spectrum at the same time as the star with the telescope still aimed in that direction? Are lamp spectra reproduceable before and after the observation
Cheers
Robin
Robin LeadbeaterParticipantAlso the ratio of H alpha/H beta emission in nebulae for example is useful for measuring the amount of interstellar extinction eg as described here
https://web.williams.edu/Astronomy/research/PN/nebulae/exercise2.php
In fact there are a number of interesting measurements you can make based on measuring the relative intensity of various lines in planetary nebulae using just a low resolution spectrograph, as described in Francois Teyssier’s low resolution spectroscopy observers guide
http://www.astronomie-amateur.fr/Documents%20Spectro/SpectroscopieBasseResolution_En.pdf
and detailed on his website here
http://www.astronomie-amateur.fr/feuilles/Spectroscopie/NGC2392.html
Robin
-
AuthorPosts