Forum Replies Created
-
AuthorPosts
-
 Robin LeadbeaterParticipant
There is also a lot of background information and amateur spectra at all resolutions on VV Cep posted on the ARAS forum over the past few years.
http://www.spectro-aras.com/forum/viewforum.php?f=19
Cheers
Robin
Robin LeadbeaterParticipantI was clouded out by the time it got dark enough/cleared the tree line so no spectrum from here. The confirming spectrum (type IIP) on TNS is fairly featureless with a blue continuum at the moment and a small hump at H alpha.
https://wis-tns.weizmann.ac.il/object/2017eaw
This should grow into a nice strong P Cygni line profile over the next couple of weeks though.
Robin
Robin LeadbeaterParticipantHi Andrew, Andy
I come across this format from time to time and it would be nice to be able to convert multispec format spectra to single orders. Storing them in the database in multispec would probably not be a good idea unless they can be output as separate orders as none of the usual amateur fits reading programs can handle them as far as I know.
I have used a very long winded approach involving dismantling the multispec files and importing them into Excel but Otmar Stahl, the professional on the German VdS spectroscopy forum, kindly converted some to separate orders for me a few years back using an IRAF script I believe. You could ask on there or if you get no joy I can try contacting him and see if he would share the script.
Cheers
Robin
Robin LeadbeaterParticipantHi Tony,
Except for a mismatch in the strength of the lines, probably due to a mismatch in resolution, the disparity at the blue end does not look that obvious to me from here. What does the fractional error look like if you divide one by the other and smooth the result?
I (and others) have also found getting a good flux calibration below 4000A tough. Most of the sources of error were probably been covered in this thread.
https://britastro.org/node/9700
and Chrisitan Buil’s site covers chromatic aberration, atmospheric absorption and the effect of position on the slit
http://www.astrosurf.com/buil/dispersion/atmo.htm
I suspect the best (though time consuming) solution when after highest accuracy in the continuum shape at the blue end is to use a spectrophotometric technique using a very wide photometric slit to determine the shape of the continuum and combine that with the resolution of a narrow slit spectrum eg
http://www.astrosurf.com/buil/calibration2/absolute_calibration_en.htm
David found using a wider slit gave better results, though the reason for the improvement was not clear in this case
https://britastro.org/node/9199
Cheers
Robin
Robin LeadbeaterParticipantHi Tony,
These look really good, particularly below 4000A where i had trouble getting a perfect fit. What reference star did you use to calculate the instrument response ? Did you use the same one for all the targets?
Cheers
Robin
Robin LeadbeaterParticipantHi Peter,
You are getting there. The Hydrogen Balmer lines in Denebola in particular are nice and clear.
There’s no Methane in Sirius but the Hydrogen Balmer lines are visible. The H2O telluric line marked should be at an absorption line. The most obvious telluric line is the broad O2 band at ~7620, off the edge of your plot but very clear in the image you posted on “Cloudy Nights” and “StargazersLounge” forums. The other humps and bumps are from the camera’s 3 colour filters. (Monochrome cameras are better in this respect for spectroscopy)
Cheers
Robin
Robin LeadbeaterParticipantHi Paul,
Yes, The way I understand it is if you are using the AOD function in ISIS to calculate and correct for atmospheric extinction then the resulting instrument response just takes into account the instrument (ie not the “IR+extinction” commonly calculated using a nearby reference star.) You are therefore correcting your spectrum in two stages, instrument response and atmospheric extinction. (I understand this is the usual technique used by professionals who know their instrument response and therefore just correct for the atmosphere for that particular observation) You can see an example of the procedure here.
http://www.astrosurf.com/buil/atmosphere/annexe.htm
EDIT: linked from
http://www.astrosurf.com/buil/atmosphere/transmission.htm
Cheers
Robin
Robin LeadbeaterParticipantHi Kevin,
I think the “type wrong” is Brian Skiffs comment against the reference. G8III and K0III are very close but your K0III reference (and your own confirming spectrum of course !) is missing from Brian’s catalogue so it could be worth letting him know so he can add it.
Here’s another oddity currently under investigation (BD-1 2458 referenced as G0v in the literature but clearly much hotter from a preliminary spectrum). Even visually the colour looks obviously wrong for the catalogued classification so it is not clear what is going on here.
https://stargazerslounge.com/topic/289163-s617-triple-star-work-to-do/
Robin
Robin LeadbeaterParticipantHi Andrew,
email sent
Robin
Robin LeadbeaterParticipantIt sounds like the prnu map which ISIS uses. For ISIS this is generated separately, illuminating the sensor disconnected from the instrument
http://www.astrosurf.com/buil/isis/eshel/reduction/echelle.htm
Cheers
Robin
Robin LeadbeaterParticipantHi Andrew,
Ok it would need to be observations going forward then. I can take two sets of flats in future for anything that might be suitable. Probably best not to depend on me short term though as I am back to the ALPY 200 supernova hunting setup currently which is not the most typical of applications.
Cheers
Robin
Robin LeadbeaterParticipantHi Andrew,
Are the low and high ADU flats conventional imaging or spectroscopic flats? The reason I ask is my individual ALPY spectroscopic flats for example can typically range from a few hundred to a few tens of thousand ADU even within the flat due to the instrument response and lamp spectrum. If they are conventional imaging flats I could perhaps take a few of these to supplement my test data set of MILES stars posted on here for you to test.
Cheers
Robin
Robin LeadbeaterParticipantI have had IRAF sitting installed on a spare laptop running Linux Ubuntu for some time, waiting for me to pluck up enough courage to dive in and start using it. This could be the spur I need. I must admit I find the prospect rather daunting though. It is a long time since I used command line programs!
Robin LeadbeaterParticipantThinking about it though, I guess in planetary imaging where focal ratios are invariably very high it is not so much of a problem
Robin
Robin LeadbeaterParticipantThis look pretty good value as a couple of decent wedge prism eg from Edmund Optics alone would be close to this figure. This arrangement though would generate astigmatism placed in a converging beam wouldn’t it? Shouldn’t there ideally be some form of collimator ?
Robin
Robin LeadbeaterParticipantHi Alun,
The ALPY600 is an impressive tool for measuring active galaxy redshifts. For example Etienne Bertrand has found it is possible to get down to mag 15-16 on active galaxy and QSO with a C8 scope. You might be interested in his growing collection that he has been reporting on the ARAS forum here.
http://www.spectro-aras.com/forum/viewforum.php?f=6
His latest ( QSO 1247+267 at z=2 and V mag 16) is here
http://www.spectro-aras.com/forum/viewtopic.php?f=6&t=1663&p=7726
Cheers
Robin
Robin LeadbeaterParticipantAlso some additional comments here which might be useful where a change to 256 colours was needed
http://www.spectro-aras.com/forum/viewtopic.php?f=8&t=1660
Robin
Robin LeadbeaterParticipantHi Peter,
The shape of your spectrum looks different from the one in the library because your spectrum is not corrected for the response of your instrument or the absorption of the atmosphere. You can see an example of this for the Star Analyser in the VSpec tutorial lesson 5 here
http://www.astrosurf.com/vdesnoux/tutorial5.html
You can also see the same process in my BAA Workshop presentations
http://www.threehillsobservatory.co.uk/astro/spectroscopy_10.htm
Cheers
Robin
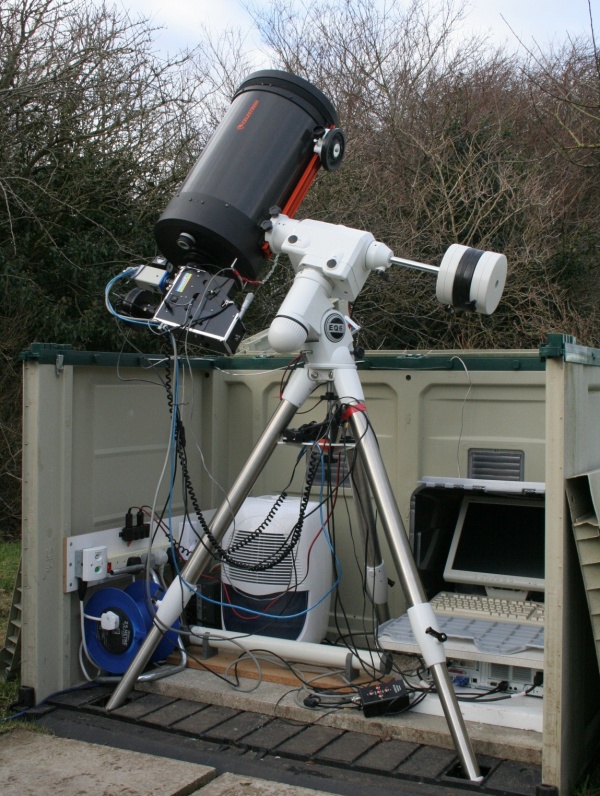
Robin LeadbeaterParticipantYou should try keeping a flip top dry! The moisture condenses on the inside of the open roof and can even rain down on the gear when you close it up. I run a dehumidifier 24/7 (with a tubular heater when it is below freezing), though apart from after I close up, it never seems to be running when I go back to it. The observatory volume is very small though!
http://www.threehillsobservatory.co.uk/astro/observatory/observatory_C11_LHIRES_feb_2010.jpg
Robin LeadbeaterParticipantHi Andrew,
Yes the effect of atmospheric dispersion (particularly if combined with CA) is well known in amateur spectra too eg
http://www.astrosurf.com/buil/dispersion/atmo.htm
but that does not seem to explain this case where the results were ok when the seeing was better, unless the target was also higher in the sky or the location was such that the parallactic angle fortuitously aligned better with the slit
Cheers
Robin
-
AuthorPosts