Forum Replies Created
-
AuthorPosts
-
 Robin LeadbeaterParticipant
There is a nice calculator for this on the CAOS website
https://spectroscopy.wordpress.com/2009/05/22/slitpinhole-flux-calculator/#more-525
which I believe is incorporated in to Ken Harrison’s modified version of Christian Buil’s simspec, the spectrograph design spreadsheet. Plugging in the values for my setup (C11 at f10 and 3 arcsec seeing) it calculates 50% throughput at 23um, 70% throughput at 35um and 85% throughput at 50um slit width. I normally run a 35um slit.
Note that other variables such as guiding accuracy and position of the star on the slit can be as, if not more important though. The definitive test as to how much light you are using is to measure the flux of the spectrum of a star with and without the slit. (or in the narrow and wide parts of a photometric slit of you have one)
Cheers
Robin
27 July 2017 at 3:53 pm in reply to: Measuring radial velocity of planetary nebulae with Alpy? #578384Robin LeadbeaterParticipantImpressive RV precision ! There are various interesting physical properties that can be measured from spectra like this. Francois Teyssier has a worked example on his website
http://www.astronomie-amateur.fr/feuilles/Spectroscopie/NGC2392.html
Robin
26 July 2017 at 2:16 pm in reply to: Measuring radial velocity of planetary nebulae with Alpy? #578376Robin LeadbeaterParticipantHi Paul,
There are some examples of its use with ALPY here which might be useful
http://www.astrosurf.com/buil/redshift/demo.htm
EDIT:
Also described in the ISIS change log under v5.1.0
http://www.astrosurf.com/buil/isis/new/release.html
Cheers
Robin
26 July 2017 at 12:15 pm in reply to: Measuring radial velocity of planetary nebulae with Alpy? #578374Robin LeadbeaterParticipantI think my limited work with the ALPY suggested a few tens of km precision but high RV precision using low resolution instruments is certainly possible though for example as David demonstrated at a BAA workshop using a LISA a couple of years back with if I remember, an impressive 5km/s 1 sigma ?
Robin
26 July 2017 at 11:58 am in reply to: Measuring radial velocity of planetary nebulae with Alpy? #578372Robin LeadbeaterParticipantHi Paul,
a 200km/s error with the ALPY does seem unexpectedly large (roughly a pixel or so). Like you I find the ALPY very stable and I would expect to be able to measure the position of a strong narrow line in an extended object like a PN to better than say 1/5 pixel. In stellar RV work one source of significant error is the position of the target on the slit. (if the star is too small it “rattles” in the slit and even if overspilling the slit, slight offsets in guide position alter the shape of the line profile and move the centroid.) I would not expect these issues with PN though as they are effectively extended objects. Since the error is variable we can also rule out an offset in the calibration lamp spectrum. PN are expanding so show different RV depending on the area examined but I understand these are only a few tens of km/s at most.
I dont know the quality of the wavelength measurement on Plotspectra. Have you tried measuring the lines in ISIS? Also since the ALPY calibration is so stable and you are comparing the PN using lines at the same wavelength, you could try just overlaying the raw uncalibrated profiles of the two PN and look for any shift directly to eliminate any potential errors in wavelength calibration.
Cheers
Robin
Robin LeadbeaterParticipantHi Paul,
It is a bit tricky to tell as the final version is a combination of the two on line documents. “Analysis and interpretation of Astronomical spectra” and “Practical Aspects of Astronomical Spectroscopy” Also the on line copies I have are probably not the last versions that Richard published (mine are v8.6 and v2.0 respectively). Perhaps Marc has a better idea of what has been added/changed significantly. Alternatively a comparison of the list of contents might show up any obvious differences.
Cheers
Robin
Robin LeadbeaterParticipantJust as clarification, CUP gave me complementary copies of these two books in return for my views on the market for amateur astronomy books in general and on spectroscopy in particular which they asked me about this some time ago.
I have long been a fan of Richard Walker’s Atlas in its free on line format for many years and I was pleased to find that CUP did a good job transferring it to print.
I do have some reservations about the accompanying “Spectroscopy for Amateur Astronomers” though which is based on two other on line documents previously published by Richard. It is a useful reference book with a good list of references for further reading but the practical parts are somewhat limited to what Richard has worked on in preparation of his atlas and may have benefited from wider input from other experienced amateurs . For example the use of flats and difficulties of flux calibration he mentions are areas which, while tricky subjects, have largely been successfully tackled by other amateurs. I would have preferred these areas and other areas to have been addressed head on in more detail rather than just put in the “too difficult for amateurs” category.This is my personal view of course which I did convey to CUP when they originally asked for my comments on an early draft.
Robin
Robin LeadbeaterParticipantNo C2 bands or emission lines then ?
Robin
Robin LeadbeaterParticipantA small correction:- Umberto used an ALPY 600 but Paolo used a LHIRES with 150l/mm grating giving a similar resolution.
Robin
Robin LeadbeaterParticipantHi Marc,
It is indeed possible to perform absolute flux calibration of spectra using photometric magnitude measurements as a reference (as opposed to just calibrating the spectra relative to the continuum). It is a technique frequently used by amateurs these days to calibrate broad band (typically low resolution) spectra where an absolute flux calibration is required. The details of the method were developed on the ARAS forum. Tools were built into ISIS software and the procedure was formalised by BAA member here, David Boyd.
http://www.spectro-aras.com/forum/viewtopic.php?f=8&t=897
and has been used in several of his (peer reviewed) papers in the BAA Journal.
It is not strictly valid to use the technique in the way Ernst has done here however as the spectral range covered is not the same as that of the V filter passband The implicit assumption here is that the flux in the V band and in the continuum at H alpha are linearly correlated. This is not always the case and would need to be established, for example by performing simultaneous photometry in V and R bands.
Alternatively more conventional techniques for absolute flux calibration of spectra are also used by amateurs by recording spectra of spectrophotometric standard stars, aided for example by the use of dual width “spectrophotometric” slits available for the Shelyak spectrographs which allow the total flux to be collected. This does need stable atmospheric conditions however during the observation. (analagous to all sky photometry). Again ISIS software has the tools to enable this.
http://www.spectro-aras.com/forum/viewtopic.php?f=8&t=695
Cheers
Robin
Robin LeadbeaterParticipantHi Matt,
Magnitude is a log scale so v(target)- v(comparison) is actually the ratio of the intensities of the two stars, which is independent of the actual count/intensity scaling in the image.
the magnitude of the comparsion star is itself a ratio (To a standard star with vmag =0 eg Vega)
Cheers
Robin
Robin LeadbeaterParticipantHi Marc,
I assume BASS estimates the resolution in a similar way to ISIS by estimating the FWHM of the neon calibration lines, in which case it may not give a good estimate of the resolution on undersampled spectra like this. (Not enough points in the line profile)
There is still something odd about the dispersion value. The native dispersion of the LHIRES 2400 at H alpha is ~12.8A/mm so for example giving 0.083A/pixel with my ATIK314 (6.45um pixels) Your native dispersion should be around 0.06A/pixel so it looks like there is a further 3x binning going on somewhere. In any case I suspect you are losing some resolution compared with other LHIRES III 2400 spectra of the same object. Compare for example the cleanly resolved metal/telluric lines in similar spectra on the ARAS forum as here for example.
http://www.spectro-aras.com/forum/viewtopic.php?f=19&t=362
It seems that H alpha is likely to be well covered so I might take a look in the UV. With the potential for variation in size of both the H alpha disc and the M star. It could be important to establish the extent of the M star independent of the disc. It is a more difficult area to work in but I had some success in this area with the similar but much fainter eclipse of AZ Cas
http://www.threehillsobservatory.co.uk/astro/spectra_43.htm
There is a discussion involving Phil Bennett about this area here
http://www.spectro-aras.com/forum/viewtopic.php?f=19&t=1233
Cheers
Robin
Robin LeadbeaterParticipantHi Marc,
I had not planned to specifically follow VV Cep but could contribute on an ad hoc basis. Are there any more details of the campaign? Is there any professional involvement? (Phil Bennett was mentioned as PI in a post on the ARAS forum a couple of years ago
http://www.spectro-aras.com/forum/viewtopic.php?f=19&t=1219
but the link to page given there and in the document you posted on the astronomical spectroscopy yahoo forum just leads to a blank page under construction and the rest of his pages on VV Cep linked from there are dead)
There also appears to be something odd about the dispersion figure on your graphic. At 0.33A/pixel your maximum resolving power R would be at best 10000 at H alpha, not 12000 (limited by the Nyquist sample interval) 0.33A/pixel however is much too large a figure in any case for a LHIRES III and 2400l/mm grating with the pixel size of your DSLR unless you are binning.
Cheers
Robin
Robin LeadbeaterParticipantMarc wrote:
“Unfortunately until mid July we must undergo the annual period of the so called “gray nights” or twilight nights. Fortunately the beginning of August will give enough dark nights to register the start of the VVCep eclipse!”
With careful background subtraction VV Cep should be bright enough and far enough from the sun to follow at high resolution throughout the summer from where you are. For example I am further north than you (55N) and was able to follow eps Aur under much more extreme conditions.
http://www.threehillsobservatory.co.uk/astro/spectra_40.htm
Cheers
Robin
Robin LeadbeaterParticipantHi Marc,
But the time on your spectrum graphic is 10:19 UT. Are you observing in daylight?
Cheers
Robin
Robin LeadbeaterParticipantHi Marc,
I’ve just noticed the times on your VV Cep spectra. Where are you observing from?
Robin
Robin LeadbeaterParticipantHi Paul,
Here’s mine with the ALPY 200 from my reasonably dark rural site, from this poster paper
http://www.threehillsobservatory.co.uk/astro/spectroscopy_20.htm
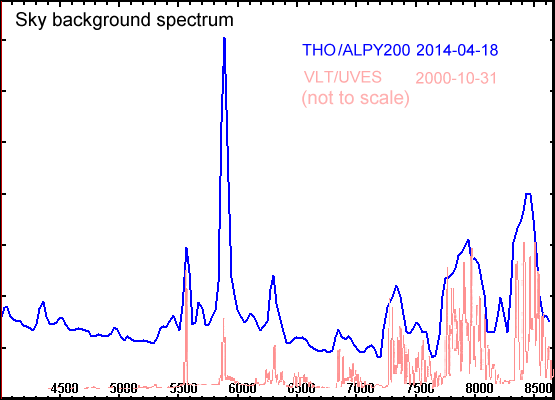
The comparison with the VLT was interesting. (note the high natural pollution from OH band emission in the IR)
It has certainly become worse over the years in quantity and complexity though with a shift locally from LP sodium to a mix of HP sodium, metal halide and now LED, particularly the ones high in blue. Sky background subtraction does indeed work very well eg as here where the signal is much lower than the sky background (It still adds noise though and I think is ultimately limiting my sensitivity)
http://www.threehillsobservatory.co.uk/astro/spectra_46.htm
Cheers
Robin
Robin LeadbeaterParticipantPaul,
The relatively low level of the Na D line in your spectrum is interesting (The narrow band from LP sodium lighting still dominates in my spectrum) Is this not used in your area at all these days ?
Robin
Robin LeadbeaterParticipantHi Matt and welcome to the BAA !
Sorry I did not get back to you on the stargazer’s lounge thread about your latest spectrum of S617b. This one is much less noisy and as you say now seems to match much better with what would be expected for a G0v star. I am not sure why it looked so much bluer than its companion in your image though. (It is hotter (compared with the late G/early K companion) but not as much as the image colour difference might suggest) Overlaying your latest spectrum of the b component over the spectrum of the a component or A comparison of B-V for the two stars should clarify the colour difference.
Precise spectral classification is a bit limited with the Star Analyser as the resolution is not really high enough (you really need around 10A resolution or higher to do this) It is not so bad at showing the difference between hot eg A stars and cool M stars but in the middle temperature range say mid F to mid K, you get hundreds of metal lines which merge at Star Analyser resolution. You can get an idea from the shape of the spectrum continuum but interstellar extinction can distort this so you have to be careful. Spectral classification is all about what lines appear and how strong they are so matching the details in the spectrum with the Pickles library can help decide what type as star is. I suggest overlaying the Pickles spectra on your spectra looking for matches in the features and general shape.
Cheers
Robin
Robin LeadbeaterParticipantI was able to get just 10 mins on this object with the modified ALPY 200 before the clouds rolled in last night. This is a bright target for this setup though so it was enough to get a decent low resolution spectrum (R~130). Here is my spectrum overlaid on the confirming spectrum from 14th May posted on TNS.
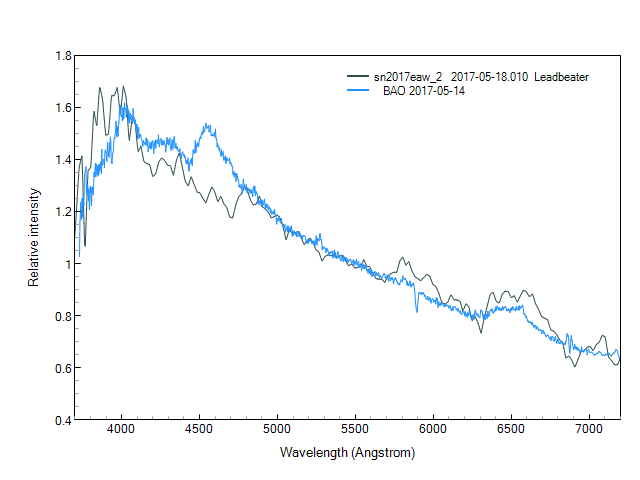
The Supernova identification program SNID confirms from my spectrum it is a type IIP near maximum light. There have been some significant changes in the spectrum over the past 3 days which is expected.
The blue shifted absorption component of the H alpha P Cygni profile is clear now in my spectrum and can be used to estimate the explosion velocity (~11600km/s)
Cheers
Robin
-
AuthorPosts