Forum Replies Created
-
AuthorPosts
-
 Robin LeadbeaterParticipant
Hi David,
All is not lost. There is a field star showing a nice telluric absorption band at ~7620A which you can use to get an approximate wavelength calibration. (~25A/pixel off the posted image but that may have been reduced down from the original)
Robin
13 April 2021 at 3:08 pm in reply to: SN 2021hem – an apparently “hostless” supernova in Hercules #584092Robin LeadbeaterParticipantThis one also looks to be at maximum
https://alerce.online/object/ZTF21aaqwjlz
Assuming the z = 0.035 in TNS estimated from the classification spectrum equates to 150Mpc distance, this puts the absolute V magnitude at -19.7, about right for a typical type Ia with no extinction
Robin LeadbeaterParticipantIt looks like it is now close to maximum.
https://alerce.online/object/ZTF21aarqkes
At a distance of 40Mpc (from NED) an apparent magnitude of 14.6 gives an absolute mag of -18.4 not allowing for any extinction
An ALPY200 spectrum from last night continues to give a good match to a type Ia at the host redshift
Cheers
Robin
Robin LeadbeaterParticipantA couple more spectra of QSO at higher redshifts (4.41, 4.564) from the PS-ELQS catalogue here
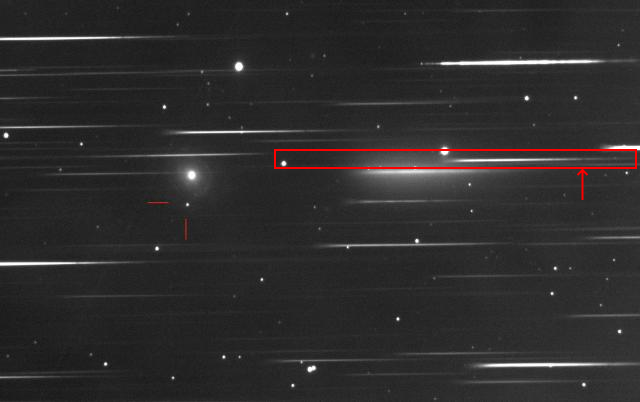
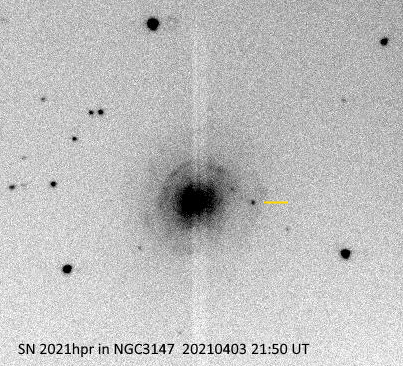
Robin LeadbeaterParticipantI see Ivan Walton caught SN2021hpr on the night of 2nd April 14 hours after discovery in this member’s image
crop below
 Robin LeadbeaterParticipant
I’ve just realised this is the second supernova in this galaxy this year. SN 2021do (type Ic) reached mag 16.5 mid January but is now down to mag 20
https://alerce.online/object/ZTF21aaaubig
Cheers
Robin
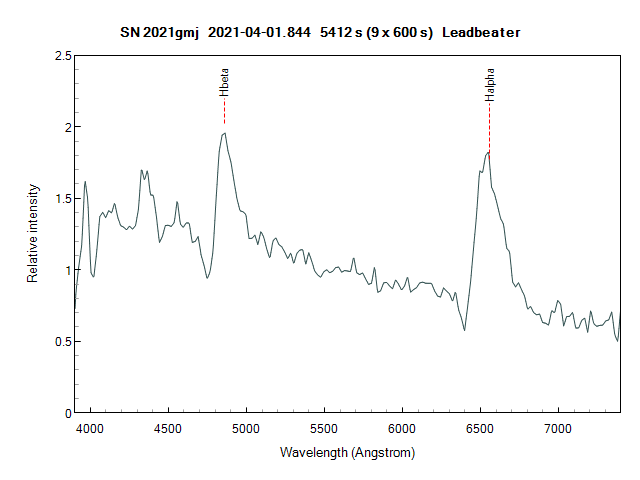
Robin LeadbeaterParticipantIt was bright enough for a slitless spectrum using the Star Analyser last night
https://britastro.org/observations/observation.php?id=20210406_144443_9e1c6a4cf219d14d
Cheers
Robin
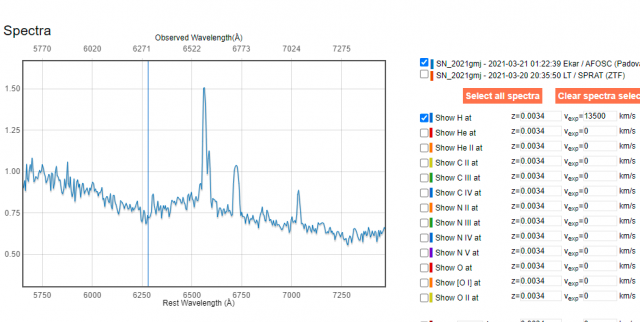
Robin LeadbeaterParticipantI normally just measure the shift of the absorption minimum, either relative to the line rest wavelength corrected for z if known or the emission maximum. I guess there must be higher velocities out to the edge of the line where it meets the continuum but my resolution is so low it would bias the result. It looks like the 13500km/s measured in the very early classification spectrum was based on where the broad H alpha emission met the continuum.
 Robin LeadbeaterParticipant
The spectrum at maximum (15.8 ZTF g) showing nice broad Hydrogen Balmer line P Cygni profiles
 Robin LeadbeaterParticipant
ZTF report mag 14.5 (ZTF g) this morning and still rising
4 April 2021 at 11:49 pm in reply to: SN 2021hem – an apparently “hostless” supernova in Hercules #584054Robin LeadbeaterParticipantI just did a quick back of envelope check based on the LMC. using 0.9 integrated v mag and 50kpc distance gives an absolute magnitude of ~-17.5. At a distance of 150Mpc (z=0.035) this would give an apparent magnitude of ~ 18.5 which would be easily visible in the SDSS image
Cheers
Robin
4 April 2021 at 11:03 pm in reply to: SN 2021hem – an apparently “hostless” supernova in Hercules #584053Robin LeadbeaterParticipantYes you would need a very deep image to be sure but the two confirmed hostless examples here
https://arxiv.org/pdf/1505.03407.pdf
are at significantly higher redshifts than this one so it should be possible to determine if it is truly hostless given time on a big telescope.
(There is no sign of anything in the DSS, SDSS 2Mass images)
Cheers
Robin
Robin LeadbeaterParticipantThe Padova-Asiago classification in TNS was type I (uncertain – either Ic-BL or Ia). This has now been revised to type Ia based on a spectrum from ZTF (LT/SPRAT)
https://www.wis-tns.org/object/2021hpr
I am just reducing my spectrum taken last night.
Cheers
Robin
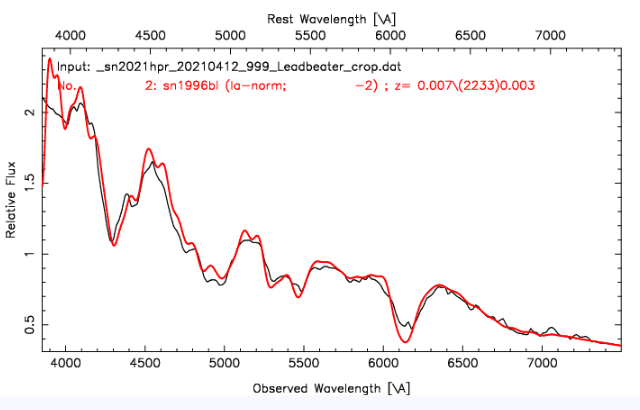
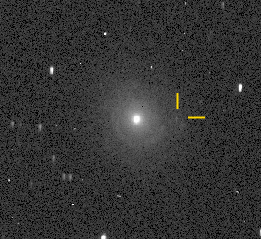
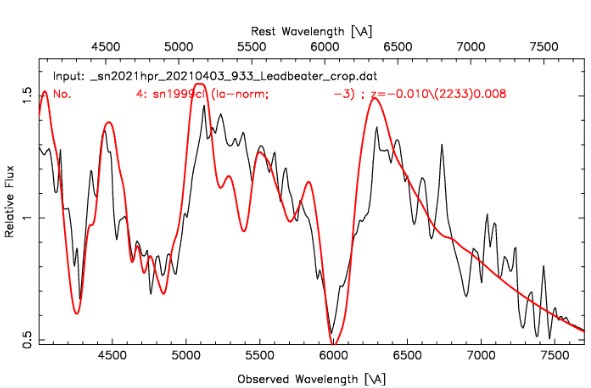
Robin LeadbeaterParticipantAt ~mag 17 last night this was near my limiting magnitude for spectra but the strong features confirm a type Ia so it should get a fair bit brighter yet. Here is my spectrum compared with a match from SNID
and my spectrograph guider image
 Robin LeadbeaterParticipant
The links do indeed now work as intended. (Using “open new window” ensures the reader can visit the links without closing the BAA website tab)
Thanks Dominic!
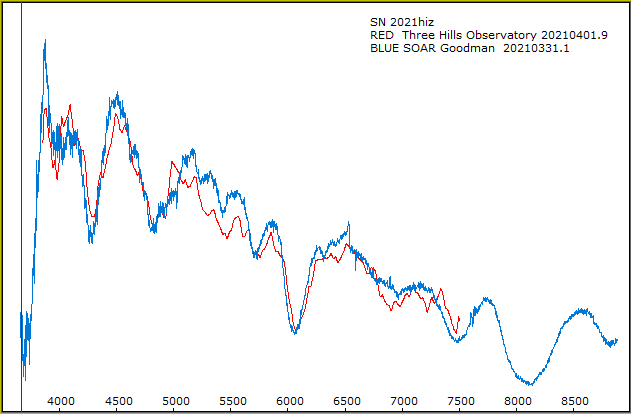
Robin LeadbeaterParticipantA comparison of the spectrum from last night with the SOAR Goodman classification spectrum from TNS and described in Atel 14500 taken 2 nights earlier
 Robin LeadbeaterParticipant
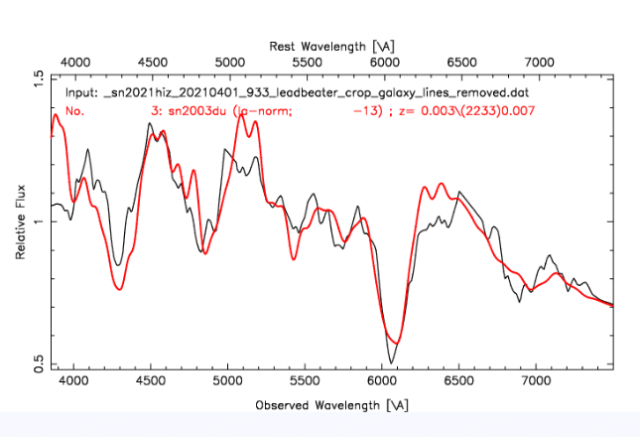
The spectrum from last night with some contamination from galaxy lines
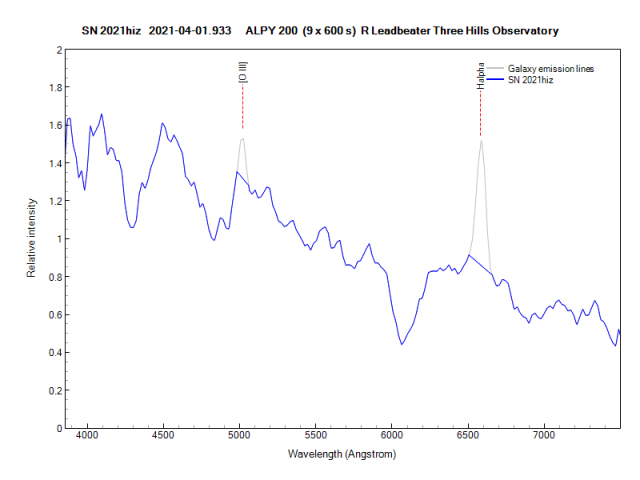
SNID confirms a good fit to a young type Ia several days from maximum
Cheers
Robin
Robin LeadbeaterParticipantLooking at the details for the object in the GSC, I see it is classed as 3 – “non stellar”
http://vizier.u-strasbg.fr/viz-bin/VizieR-5?-ref=VIZ6066f68a1b2892&-out.add=.&-source=I/254/out&GSC=0028800235
so perhaps GSC 00288 00235 was detected in GSC as an area including the bright knots in the galaxy directly above it with an integrated brightness of mag 12?Robin LeadbeaterParticipantRainer Ehlert has pointed out on the RSpec forum that there is a Mag 12 star GSC 00288 00235 listed at the same position (with an arcsec) but this does not appear in images from DSS,SDSS PanSTARRS and there is certainly nothing that bright there now. (SN2021hiz is definitely a type Ia SN at a redshift matching UGC 7513)
Could there be an error in the GSC catalogue and the exact coordinate match a coincidence or is there more to this ? Any ideas ?
Cheers
Robin
Robin LeadbeaterParticipantThanks Dominic,
While I have your ear ;-)… I embedded some links in the description of the image and selected the “new window” option expecting it to open the link in a separate window but it closed the original window. Is this how it should work ?
Cheers
Robin
-
AuthorPosts