Forum Replies Created
-
AuthorPosts
-
 Robin LeadbeaterParticipant
similarly this one
https://britastro.org/observations/observation.php?id=20201130_172000_14eeb4c49a70db2e
Robin
Robin LeadbeaterParticipantpinched optics, mirrors with turned edges
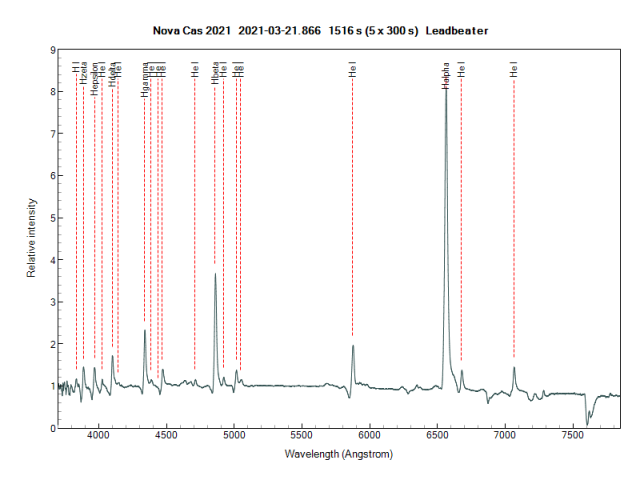
Robin LeadbeaterParticipantFinally got my spectrum a couple of days later. A nice full set of H Balmer and HeI P Cygni profiles
Cheers
Robin
Robin LeadbeaterParticipantFor specific targets I like Roger Wesson’s https://observability.date/
Robin
Robin LeadbeaterParticipantNow classified as a type II. Not surprising for a star burst galaxy I guess
Robin LeadbeaterParticipantArgh !
It was clear last night here too and I was looking round for interesting targets for spectroscopy. This would have shot to the top of the list but nothing on vsnet-alert. Where better should I be monitoring ?
EDIT: I see it is on vsnet-alert. My brain did not register the alerts for some reason I think I must have thought Cze was some obscure southern constellation and moved on. 🙁
Cheers
RobinCheers
Robin
Robin LeadbeaterParticipantFold over a number of rotations perhaps? (A good test for low read noise CMOS technology)
Robin LeadbeaterParticipantDoes it work using ATIK’s own Artemis Capture ?
Robin LeadbeaterParticipantHi Jack,
To home in on the source of the problem I would check the following
Is the camera installed correctly ? As Tim said, check the Device Manager the camera should be listed under USB somewhere and should report that it is working properly. If not try reinstalling the driver
Once it is installed correctly, try the ATIK capture software. If it is working there then the problem lies with MAXIM DL somewhere.
Cheers
Robin
Robin LeadbeaterParticipantThen I am stumped I am afraid. If it pops up again you could perhaps try moving the micrometer a touch to see if it moves with the spectrum and/or move the spectrum along the slit a bit to see if it is a localised defect
Robin
Robin LeadbeaterParticipantHi Kevin,
I suggest checking your flat image in this area. This double line effect looks typical of that produced by a dust donut. Take a profile across the flat at the location of the spectrum. I was discussing with Jack Martin the other day who saw something similar (at a different location). It turned out to be a defect visible in the flat which for some reason we don’t quite understand was not corrected by the flat (The defect was weaker in the flat than in the image)
Cheers
Robin
Robin LeadbeaterParticipantI used to work for a Swedish paper company and when discussing aurorae with a colleague who worked in forestry there he commented unprompted on hearing crackling during strong aurorae which I assumed was a local electrostatic effect.
Robin LeadbeaterParticipantThanks ! Very similar to what my current setup is
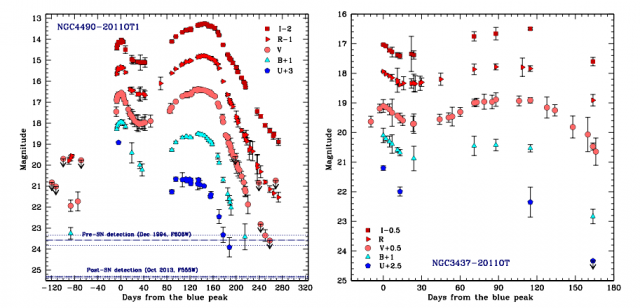
Robin LeadbeaterParticipantThe light curve of some of these objects bounces back though as they redden as the reference I posted shows so it would be interesting to take a comparison image in a few months time
 Robin LeadbeaterParticipant
I think we can agree though it has indeed turned out to be a “Potentially interesting transient in NGC 4631″
Robin LeadbeaterParticipantIndeed, as I already reported
https://britastro.org/comment/10041#comment-10041
I never said it was a supernova and posted the classification as soon as it became available
Cheers
Robin
Robin LeadbeaterParticipantMy current observatory PC is showing signs of age. I normally use cheap refurbished desktops which last typically 3 years before expiring in the less than ideal conditions but this sounds an interesting alternative. How much space is left after a Win 10 pro installation? (I don’t need too much as I offload to a separate server at the end of each run and don’t have any huge megapixel cameras but 64gb sounds a bit tight ?
Thanks
Robin
Robin LeadbeaterParticipantI remember imaging that with my modified webcam and CCTV camera
http://www.threehillsobservatory.co.uk/astro/astro_image_37.htm
and the spectacular light echo images from the Hubble. I took over where the Hubble left off 🙂
http://www.threehillsobservatory.co.uk/astro/v838Mon_anim.gif
Robin LeadbeaterParticipantIt has now been classified as a probable Luminous Red Nova.
http://www.astronomerstelegram.org/?read=14360
I have to confess I had to look up what that was. Fascinating !
https://ui.adsabs.harvard.edu/abs/2019A%26A…630A..75P/abstract
Robin
Robin LeadbeaterParticipantI thought I was going crazy for a moment there replying to imaginary posts !
-
AuthorPosts