Forum Replies Created
-
AuthorPosts
-
 Robin LeadbeaterParticipant
A short clear spell tonight. Not long enough to get a spectrum but off the spectrograph guider it looked about a magnitude fainter than on 8th
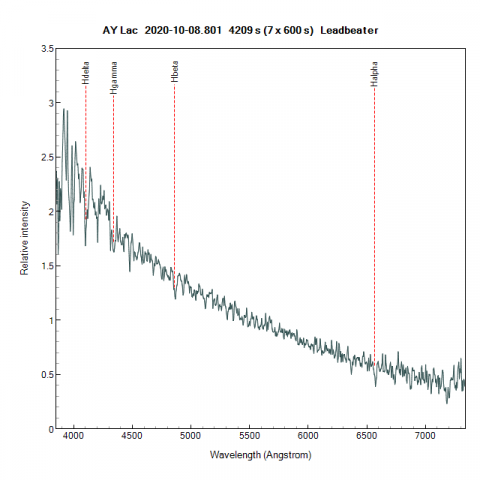
Robin LeadbeaterParticipantALPY 600 ~12A resolution. A blue continuum with weak Balmer absorption
 Robin LeadbeaterParticipant
Sorry Andrew, I missed this
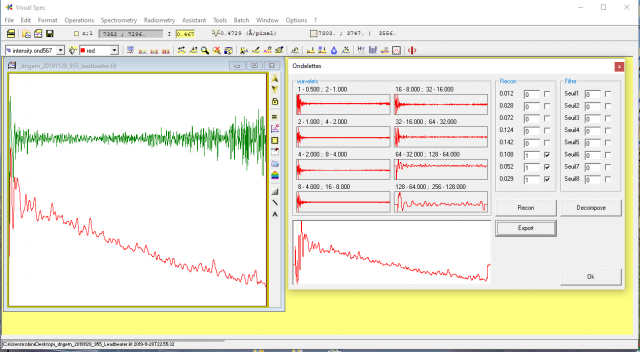
Impressive. I have just updated my copy of Visual Spec and I see Valerie has added a wavelets feature
 Robin LeadbeaterParticipant
“It’s amazing how people go on finding creative ways to waste their time and resources”
I have to say I’ve done my fair share of that in astronomy too 🙂
Robin LeadbeaterParticipantI like that the residuals follow the expected shape, noisy at the ends of the spectrum where the sensitivity is lower. It gives confidence that you are removing noise, not signal
Robin LeadbeaterParticipantNow classified as a type Ia supernova by Italian amateur Claudio Balcon using a home built spectrograph designed around the Star Analyser. Congratulations to Claudio and the XOSS team for their discovery !
Robin
Robin LeadbeaterParticipantAn interesting example has just popped up showing the problems a rogue warm pixel can cause
Robin LeadbeaterParticipantLooks like it is flickering for a few minutes when it drops. Drifting over a hot/cold pixel perhaps ?
Robin
Robin LeadbeaterParticipantI don’t have any experience with CMOS (yet) but with my CCD cameras I redo them every few months. Bias frames take no time at all but getting enough long exposure darks eg 1200 sec can take all night so I just leave the camera running on a cloudy night. I then produce a defect map from these and scale the master darks depending on exposure. I find the only significant changes have been with hot and warm pixels (and with one camera a faint line defect appeared) These are not a disaster as a cosmics removal tool normally zaps them but it is better if they can be fixed at source using an up to date defect map
With spectroscopic flats it is important to redo them if you move the wavelength range. I normally do them for each observation with the LHIRES and once a night with the ALPY. it takes little time with the built in calibration units though the results with the LHIRES at the blue end are very suspect due to light leaking past the slit.
I aim to sum at least 20 exposures (30 for ALPY flats where the light level is very low at the blue end)
Cheers
Robin
Robin LeadbeaterParticipantEstimates from Stan Howerton last night give SN 2020rcq 12.5 V so still rising but SN 2020qxp at 14.5 so probably sub-luminous near maximum as suggested by the TNS classifiers
Robin LeadbeaterParticipantMagnitude estimates from Odd Trondal on ISN_chat last night SN 2020qxp ~14.5 SN 2020rcq ~13.4
Robin LeadbeaterParticipantSN 2020qxp is now also confirmed as a Ia and the classifiers suggest it should be near maximum light in which case it should in theory be approaching ~mag 11 excluding extinction in the parent galaxy. They also compare it though with SN 2007on which was classed as “transitional” (ie with a luminosity lower than normal for a 1a but more luminous than sub luminous 91bg-types). SN 2007on was considered a good candidate for a white dwarf merger supernova event eg
https://arxiv.org/abs/1802.09469
The light curve of SN 2020qxp could be interesting
Cheers
Robin
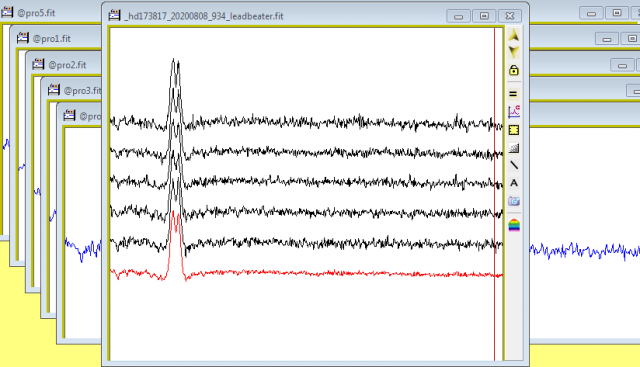
Robin LeadbeaterParticipanta quick example, red is the final profile from the individuals
 Robin LeadbeaterParticipant
Hi Andrew,
If you untick the box that deletes the intermediate files, ISIS saves the individual profiles in a time series (as @pro_n.fit)
Cheers
Robin
Robin LeadbeaterParticipantHi John,
There was an excellent detailed commentary on the evolution of nova spectra by Prof Steve Shore during the Nova Del 2013 ARAS campaign here
http://www.astrosurf.com/aras/novae/Nova2013Del.html
He has also issued an ATel on the current nova based on amateur spectra
http://www.astronomerstelegram.org/?read=13939
Cheers
Robin
Robin LeadbeaterParticipantA bit closer still, same part of the sky (unfortunately). Confirmed as a 1a. Rising rapidly, heading for ~mag 11 ?
https://wis-tns.weizmann.ac.il/object/2020rcq
Robin
Robin LeadbeaterParticipantThanks David,
I approached this not knowing much about it just to see what might be possible to measure but think there is other pro work like this around, though most of it seems to be concentrated on the coma rather than the tail. I’ve not seen anything like this by amateurs though. In fact I cannot recall seeing amateur tail spectra of any comet and it was quite a surprise when I recorded it as it looked so different to the coma spectra you usually see, with CO+ in place of C2. The Sodium distribution looks similar to what the PSI team got which is what I was mainly interested in trying to pick up.
https://psi.edu/news/neowisesodiumtail
How far the CN spreads surprised me. I suspect the distribution across the tail actually spreads much further even than my plot suggests. The measured distribution approaches zero steeply rather than gradually tailing off suggesting it is clipped. It likely extended beyond the ends of the slit so was clipped when I used the edges of the field to subtract the sky background.
It would be nice to measure further out along the tail but I already had to stitch 2 slit lengths together to cover the width of the tail even this close in.
Cheers
Robin
Robin LeadbeaterParticipantI have finally completed the analysis of my spectroscopic cross sections through coma and tail taken 2020-07-13 and added a poster to my members page
https://britastro.org/node/23655
It shows some interesting differences in the distribution of the various components which make up the cometary material.
The CN and Sodium components are seen in both coma and tail but the C2 component which dominates the coma emission spectrum is absent in the tail, replaced by the CO+ component.
The spatial distributions are significantly different for the various components. In particular the sodium emission in the coma is confined to a narrow central region but the CN component is widespread in both the coma and tail. The Sodium distribution in the tail is skewed anticlockwise relative to the dust, consistent with the presence of a separate sodium tail.
Cheers
Robin
Robin LeadbeaterParticipantHere is the region from H beta and redwards covering the “Fe curtain” region at R~1950 with the LHIRES and 600l/mm grating
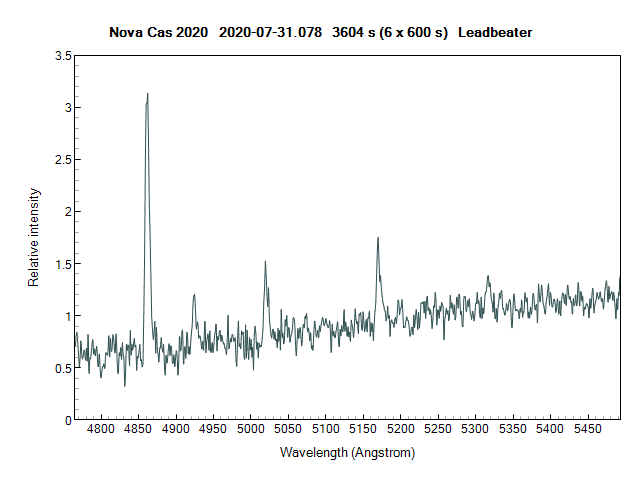
The H beta FWHM is ~360km/s after correcting for the spectrograph resolution but there may be some higher velocities redwards in the line profiles
Cheers
Robin
Robin LeadbeaterParticipantHi David,
I would not bother attempting flat correction of slitless spectra. Normal flat correction techniques do not work because each point is a mix of spectral and spatial information. (The technique used on professional setups is complex and involves generating effectively a “flat cube” for each wavelength at each point in the field.) My advice would be to take a conventional flat beforehand to check for any obvious dust donuts etc and place your target and reference star zero orders as near as possible on the same pixel avoiding any dust spots so any gross flat effects eg vignetting etc cancel.
Cheers
Robin
-
AuthorPosts