Forum Replies Created
-
AuthorPosts
-
 Robin LeadbeaterParticipant
The amateur spectroscopic monitoring was very extensive and as far as I know remains untapped by professionals. It would be interesting to know how our data fits the various models.
Cheers
Robin
Robin LeadbeaterParticipantI think it is still valid though. Similar to a colour index, sort of (V-I)
Cheers
Robin
Robin LeadbeaterParticipantI mean for identification (ie shorthand to identify the line in question) not for stating the measured wavelength. (I can measure that to a precision of up to 0.01A). In papers on astrophysics you only need to say for example Na 5890, Na 5896, He 6678, DIB 6613 etc for the reader to know the line you are talking about. That’s what I meant by avoiding the ugly decimal point.
Robin LeadbeaterParticipantQuite literally (I’ll get my coat)
Congratulations to JS
Robin LeadbeaterParticipantnm I can cope with (though the need to include a decimal point when defining well known lines is ugly). It is the use of Janskys for flux in optical spectra instead of the traditional (but definitely not SI) erg/cm2/sec/Angstrom that really throws me when I see it as being based on frequency, it completely changes the shape of the spectrum.
Robin LeadbeaterParticipantActually I debated that briefly. The wavelength range in the images is approximate as the dispersion is non linear and it is a crop and I could not be bothered to work out the exact wavelengths to the nearest Angstrom. I used nm as 10 Angstrom was close enough 🙂
Robin LeadbeaterParticipantThis relatively modern paper sums it up (I did not realise before that some of these lines do not always track the dust or even each other)
Robin LeadbeaterParticipantWhen I first saw it I expected it to be atomic in origin because it looks so narrow (Think NaD or K 7699 interstellar lines) but I found no matches. Apparently it is probably (I should say possibly, nothing seems very clear from the literature I have found) formed by a high molecular weight PAH molecule but exactly which one is not clear. It is fascinating that something that is seen in so many spectra and has been known about for many decades is still a mystery
Cheers
Robin
Robin LeadbeaterParticipantPerfect ! Thanks David. (I had tried underlining but that did not work so did not explore further.) I have changed my recent post. I think Bold, Italic looks quite good 🙂
Cheers
Robin
Robin LeadbeaterParticipantAn R~5500 LHIRES spectrum of Halpha/He I 6678 last night.
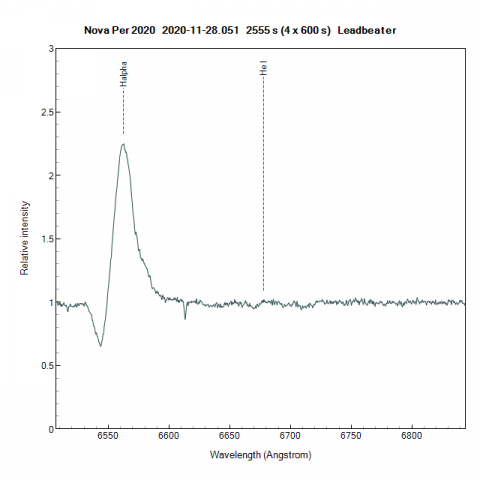
Lots of evolution over a day in spectra in BAA database
The interstellar line at 6613 is strong too. (I did a bit of Googling on that last night and it seems although it is thought to be molecular in origin, the species does not seem to be known. Does anyone know more about this )
Robin LeadbeaterParticipantLong exposure astro cameras with higher dynamic range are certainly better for photometry but I played around with 8 bit camera photometry a few years back and found it was possible to do high(ish) precision photometry with 8 bit cameras (even exoplanets, just) provided you sum many frames to get the counts. eg
http://www.threehillsobservatory.co.uk/astro/Photometry_GO_Com.htm
http://www.threehillsobservatory.co.uk/astro/TrES_1.htm
One thing to watch though with these cameras is that the gamma is set to 1 so the response is linear.
Cheers
Robin
Robin LeadbeaterParticipanthttp://www.astronomerstelegram.org/?read=14224
The confirming spectrum was taken with an ALPY600 and 10 inch telescope
(Here it was clear earlier last night but the arrival of the alert in my in box coincided with that of the clouds)
Robin
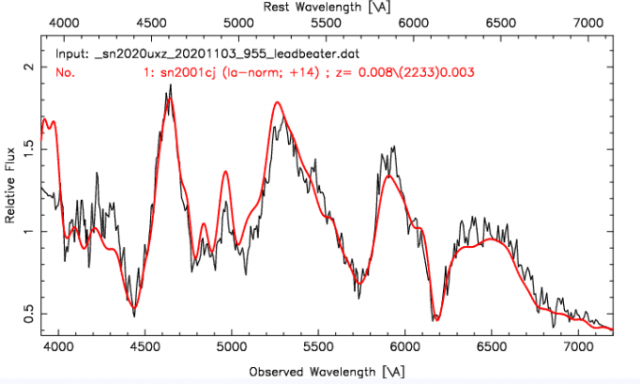
Robin LeadbeaterParticipantAnother spectrum at ~12 days past maximum. Still bright at ~mag 14.5 but interfering moonlight reduced the SNR. Significant evolution since the pre maximum spectrum
https://britastro.org/specdb/data_graph.php?obs_id=8176%2C8020&multi=yes&legend_pos=ne
but still a good match to a typical type Ia
 Robin LeadbeaterParticipant
Yes this one is against a bright background. This can be subtracted out using regions above and below the target in the slit but it does depend on this being uniform (both in brightness and spectroscopically) so you have to watch for galactic features.
The last time I checked the ATels this group were suggesting the spectrum resembles that of an F star. This rather rang alarm bells with me though as that is that is what might be expected from the integrated light from the galaxy. I see now here though it has been classified as an Fe II nova. What brightness would you estimate? (Not that I am going to be observing any time soon from the forecast. As I am writing this the hailstones are hammering on the window)
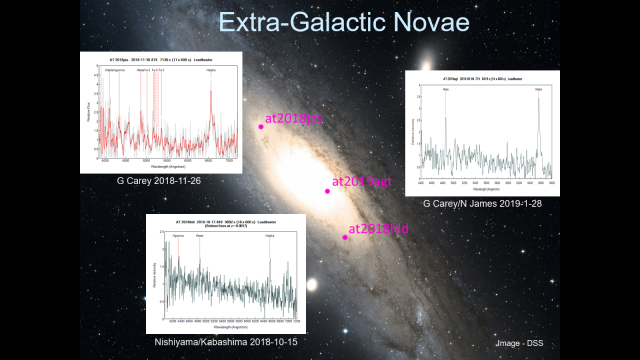
Robin LeadbeaterParticipantThese are some I have managed to tease out in the past (full scale in the attachment)
 Robin LeadbeaterParticipant
Hi Nick,
Has 2020vak been positively identified as an M31 nova? I am not saying it isn’t but it wasn’t clear from the amateur spectrum posted on TNS
https://wis-tns.weizmann.ac.il/object/2020vak
Cheers
Robin
Robin LeadbeaterParticipant“Today I noticed the graphs had gone from my posts . I have put the latest back into the 26th Oct post. Any thoughts on the reasons? Are some formats preferred?”
file size perhaps? jpg of graphical images tend to be larger and poorer quality than png for example
Robin
Robin LeadbeaterParticipantInterestingly there was another transient AT2020ftc discovered the same date 10 hours earlier at almost (but not quite) the same coordinates I wonder if it is the same object, one with incorrect coordinates or perhaps an asteroid?
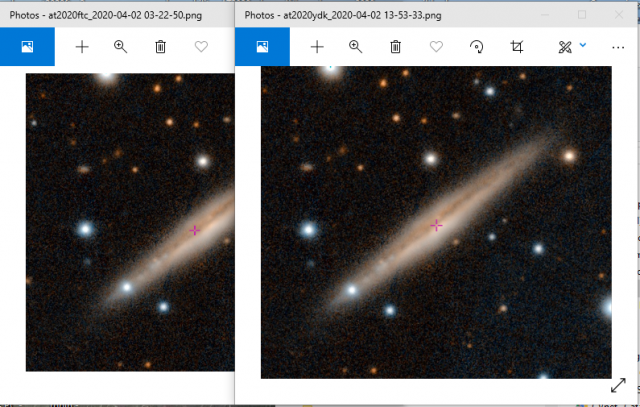 Robin LeadbeaterParticipant
Forget it. I have just noticed although it has just been put on TNS the discovery date is 2020-04-02. A bit late for them to be announcing it !
Robin LeadbeaterParticipanthttps://www.bbc.co.uk/iplayer/episode/m000nysp
at 22min 43sec
Advisory – not suitable for astronomers of a nervous disposition or those with high blood pressure
-
AuthorPosts