- This topic has 152 replies, 42 voices, and was last updated 5 years, 2 months ago by
 Bill Ward.
-
AuthorPosts
-
19 July 2020 at 10:58 pm #582874
 Robin LeadbeaterParticipant
Hi Hugh,
It was done rather crudely in this example. The spectra are flux calibrated using a nearby reference as normal. I then just subtracted the Pickles G2v spectrum scaled relative to the comet spectrum in a region where there is just the dust continuum. It is pretty good at removing the solar absorption lines and most of the dust continuum but leaves a residual shape in the continuum dependent on the broad reflectance spectrum of the dust so not good for quantitative measurements. It would be better to modify the G2v spectrum first to better fit the dust continuum leaving just the emission.
Cheers
Robin
19 July 2020 at 11:00 pm #582873Robin LeadbeaterParticipantdeleted
(The reply to posts is not working correctly. I replied to #121, not #122 !)
19 July 2020 at 11:32 pm #582872 Jimmy FraserParticipant
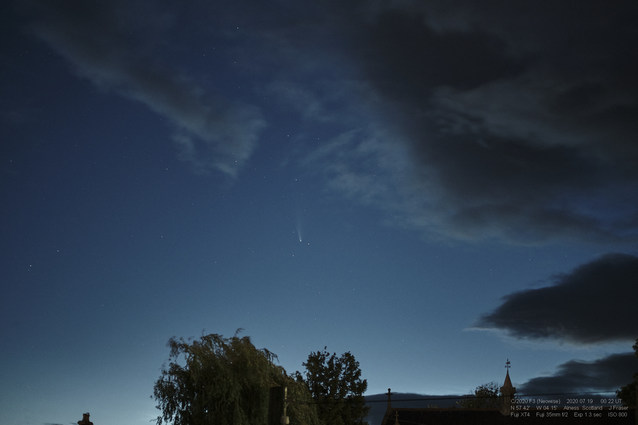
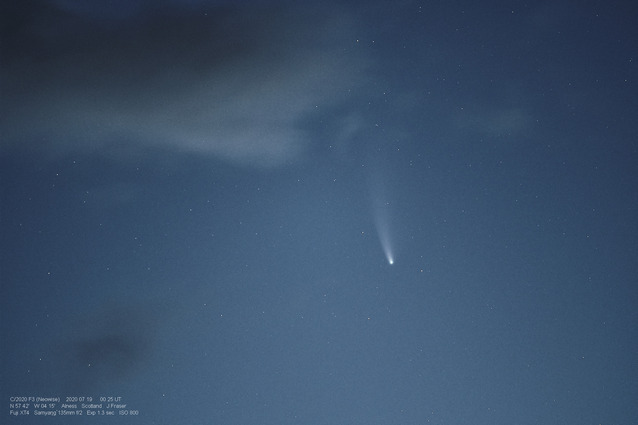 Not had much luck seeing this comet for the last two weeks. I got a brief view last night July 18-19. Still have strong twilight in north Scotland. Images taken from the bedroom window due to a neighbouring weeping willow.
Apologies to Allen and Hugh – I hit the wrong ‘reply’ button.
20 July 2020 at 8:08 am #582875 Nick JamesParticipant
There is a lot of detail in the centre of the coma too https://britastro.org/node/23370
20 July 2020 at 10:23 am #582876 Philip MasdingParticipant
I’ve just posted a picture of the comet I took the other day. The problem I have is in the processing stage when I use Deep Sky Stacker to try and track on the comet and stars to produce an image in which both look sharp. I can get either an image tracked on the stars or the comet but it crashes when I try to do both.
Does anyone know a way round this? Or are there any recommended alternatives to DSS for this.
Any help would be great!
20 July 2020 at 4:37 pm #582878 David StrangeParticipant
This is a comparison of raw spectra taken 8 days apart showing depletion of sodium emission but increase in C2 and CN.The comet looks like it has now lost its golden colour and images are picking up more blue/green in the coma perhaps due to this increase?
David
22 July 2020 at 9:58 am #582883David StrangeParticipantNorman Lockyer Observatory members gather for the first time since lockdown for a news bulletin on Comet Neowise for ITV’s News at Ten.
https://m.youtube.com/watch?v=2ciG0yTR6Q4
David
22 July 2020 at 10:35 am #582884 Grant PrivettParticipant
For me the comet is still naked eye and about 5-6 degrees long. It was a bit hazy last night so tougher to see by direct vision but still there: https://britastro.org/node/23435
No obvious sign of banding in the dust tail but when using Live View the coma was clearly green.
Its been a real treat to have some tolerable weather and a comet with two bright tails.
We should start to see some images from Aus in about 10 days time… Hope its stays bright for them.
22 July 2020 at 1:44 pm #582886David C Rayment
ParticipantA response to zen32156
I wonder if stacking images taken over a shorter time period may help.
There is an interesting video on Youtube by Peter Zelinka entitled “Editing Comet Neowise with Photoshop”. He mentions Deep Sky Stacker and not using sigma clipping average method to process images. Unfortunately I have only ever used an old version of Photoshop Elements so am unfamiliar with the software in the video which looks way above my area of expertise. However, if you look at the video starting at about 9 minutes in it may answer your questions or at least give you a few ideas. Others may also find the video of interest.
22 July 2020 at 4:04 pm #582887 John CoffinParticipant
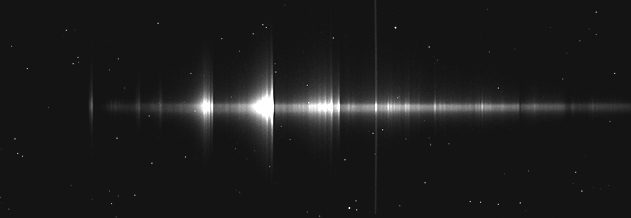
Hi, I live on the Essex marshes with views almost to the horizon, so managed to get a spectrum of the coma of this comet on Tuesday am. Didn’t try for the tail. The Swan Bands are stunningly beautiful (to a spectroscopist). The image is the raw unprocessed spectrum.
This is an annotated plot of the spectrum, the relative intensity of the emission lines is not reliable because the instrument response was calibrated using Merak which was at an altitude of 20 deg but the comet was at only 10 deg. Neither the sky background or the solar spectrum was subtracted when processing the spectrum. The emission lines were labelled according to data in Richard Walker’s Spectral Atlas and on the following website http://web.gps.caltech.edu/~mbrown/comet/all.txt
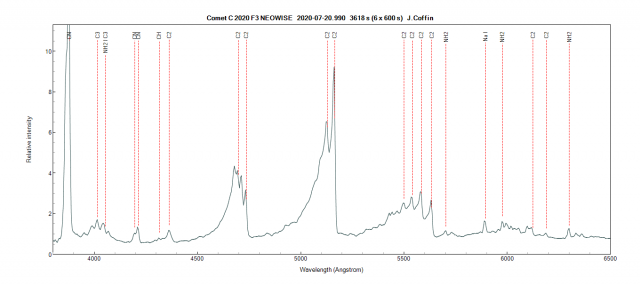
The full size images are attached.
Robin can advise on whether the annotations are reasonable. John.
22 July 2020 at 4:09 pm #582889John CoffinParticipantHi Robin, What exposure time did you need to capture the spectrum of the tail and what scope and camera did you use?
Thanks
John
22 July 2020 at 4:28 pm #582890Charles Beton
ParticipantWhilst the comet is invisible here to the naked eye, due Birmingham’s light pollution, I immediately found it on July 20, in 10×50 bins and thanks to the chart Nick had posted, at 01:30 BST and again at 23:15 BST. (My brother in Maidenhead reports a similar experience.) Mostly cloudy here since.
23 July 2020 at 11:36 am #582898Robin LeadbeaterParticipantStunning indeed. The sodium emission is dropping away fast now. I wonder how far out from the sun we will be able to detect it? Here is a quick raw spectrum image (yet to be reduced) of the NaD line region from 2020-07-20.
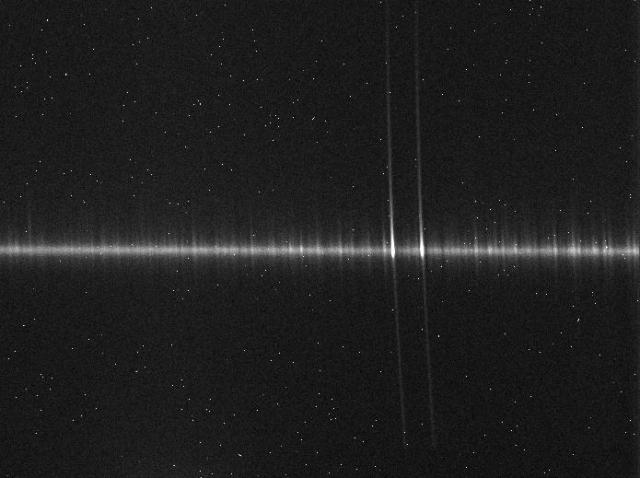
Compared with the same 10 days earlier, the sodium lines are now almost superimposed on the sky lines here as the Doppler shift drops to zero as the comet passes us.
Cheers
Robin
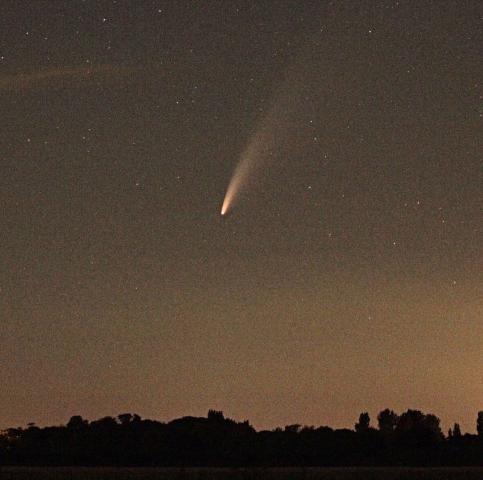
23 July 2020 at 3:19 pm #582891John CoffinParticipantThis is a photo taken with an astro-modified Canon 350D on a tripod on 13th July at 0100. Exposure 3 secs, F4, ISO 6400, focal length 55mm.
 23 July 2020 at 3:44 pm #582899
 Alan ThomasParticipant
I must say I am a little (OK, a lot!) envious of members down in places like Devon, Somerset, Dorset etc. as I have been out on three occasions so far at unearthly hours here in Warrington and been thwarted by cloud each time. As I write, a leaden sky is pouring rain over my observatory (the back lawn). But I am enjoying the many superb images of NEOWISE that have appeared here – and I’m still hoping to get a glimpse before the month’s end. Upwards and onwards!
23 July 2020 at 4:26 pm #582900 Dr Paul LeylandParticipant
Now that I´m back in Tacande I’ve been able to see the comet for the first time. In the UK I had an obstructed northern sky which is brightly lit by Cambridge city. Here (at latitude 28 degrees north) UMa sets behind the mountains around midnight or so but was well above the horizon at about 2100 local time (circa 18:45 UTC).
The comet was an easy naked-eye object. I guesstimated a roughly 3-degree tail when viewed through 7x50B. The sky was slightly hazy so perhaps more could have been seen under ideal conditions.
Far too big for me to photograph much more than the coma, so I won’t even try.
25 July 2020 at 4:49 pm #582920 Bill WardParticipant
Hi,
An alternative look at the comet.
The polarisation of sunlight being reflected and scattered by dust particles around the nucleus and in the tail can be easily mapped.
Image one is from a sequence centred on 0050UT 19/7/20.
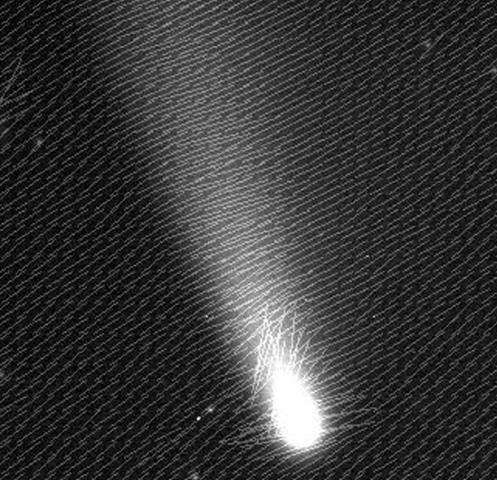
The lines represent the orientation and magnitude of polarisation. The light in the tail is polarised ~4%. There is other stronger polarisation, ~6% across the nucleus, possibly due to a much greater density of particles. additionally there is quite strong polarisation oriented ~60 degrees from the tail polarisation closer to the nucleus.
Initially I wasn’t sure if this was real or an artifact….
Image two is from a sequence centred on 2358UT 23/7/20.
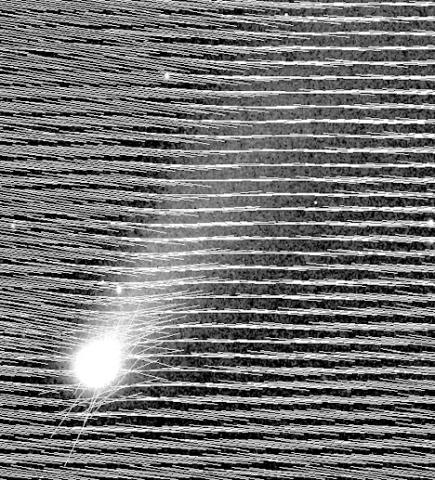
Interestingly, is the stronger polarisation is again seen around the nucleus but with a different orientation and location. It still could be an artifact but it may suggest possible Mie scattering from larger particles. The change in position may be due the rotation of the comet, from a jet or other active area.
Cheers,
Bill.
26 July 2020 at 1:57 am #582924Robin LeadbeaterParticipantHi John
C11 + ALPY600 + ATIK428. Total exposure time was 45min (9x 300s)
Cheers
Robin
26 July 2020 at 7:55 am #582925Nick JamesParticipantBill, this is very interesting. Can you give a bit of an explanation of how you got these maps. Did you take images in two orthogonal polarizations and then difference them? If so, how do you calibrate them unless they were taken at the same time.
26 July 2020 at 11:05 am #582926David StrangeParticipantCompiled from images using 28mm – 300mm lens, 100mm f/6 refractor, 50cm f/4 newtonian from Salcombe Regis & NLO, Sidmouth.
https://www.youtube.com/watch?v=Q35MKbjnWZM
David
-
AuthorPosts
- You must be logged in to reply to this topic.