Forum Replies Created
-
AuthorPosts
-
 Robin LeadbeaterParticipant
Hi John
C11 + ALPY600 + ATIK428. Total exposure time was 45min (9x 300s)
Cheers
Robin
Robin LeadbeaterParticipantHere is a link to the handbook. (dated feb 2016)
https://www.sxccd.com/handbooks/Handbook%20for%20the%20SX%20Spectrograph.pdf
The spectrum images there show very bad astigmatism, which is claimed to be an advantageous feature ! (It is not for serious use) though the spectra in the video did not look as bad as this so perhaps some improvements have been made.
Robin
Robin LeadbeaterParticipantI don’t believe the lack of remotely operating spectrographs is necessarily due mainly to the lack of suitable instruments. There are spectrographs such as the ALPY and DADOS which need no adjustment (In fact the SX spectrograph should not need adjustment in normal use with a suitable size camera really) and others like the Eshel which is capable of fully remote operation but you see very few operated this way. Remote operation of slit/fibre fed spectrographs is much tougher than imaging, particularly if you want to automatically acquire targets. (Andrew will be able to advise on that) Spectroscopy also needs a lot of telescope time which is expensive on rented telescopes.
Cheers
Robin
Robin LeadbeaterParticipantHi Grant,
There are several good reasons why beam splitter guiding was abandoned in favour of the more expensive mirror slit guiding option by all the other manufacturers (SBig, Baader and Shelyak). Focusing and positioning the star on the slit is absolutely critical. You cannot guarantee long term the splitter image will remain parfocal and in the perfect sub pixel alignment with the slit you need and realignment is problematic working effectively blind, particularly with a spectrograph like this showing astigmatism where you have no idea if the star is in focus on the slit for best throughput. (Terry stated in the video that the XY slit position they supply with the spectrograph could not be guaranteed and the user would need to tweak this to place the star precisely on the slit but this is far from straightforward in practise.) The symptom is low throughput which was seen by users of the LHIRES copy designed by Ken Harison for example and eventually replaced with a mirror slit guider in the commercial version. (This also failed commercially for other reasons). Additionally when guiding on field stars, these need to be 2-3 magnitudes brighter compared with a mirror slit because of the 10% split
Cheers
Robin
Robin LeadbeaterParticipantHi Grant,
Dont get me wrong, it would be good to have some competition for Shelyak who dominate the market currently and reflective optics are indeed a big advantage, mainly due to the lack of chromatism (ask David Boyd about his LISA) than the extended UV response, but designing one suitable for astronomy rather than for bench use is tough. The one Maurice reviewed was far from free of astigmatism though which limits its use. The field distortion looks suspect too in that video. The length of the slit is very short but the calibration lines were significantly curved even over that short distance, fine for a bench instrument but you are going to struggle to produce spectroscopic images of comets like this for example with this instrument
https://britastro.org/comment/8942#comment-8942
Availability of calibration lamps and guider modules is a given these days. The calibration lamp is just the same fluorescent lamp starter discovered by Swiss amateur Richard Walker and adopted by Shelyak for all their instruments and all other other offerings currently use a mirror slit guider rather than a beam splitter which has practical alignment issues and was abandoned by other manufacturers (This was touched on in the video where it was said that the user would be expected to tweak the guide position to position the star on the slit, critical for throughput and potentially challenging when you cannot actually see the slit in beam splitter designs so it remains to be seen how this will work in practise)
I did not intend criticising the instrument. Difficult really since I have not used one, though I do see some potential issues and did ask various questions about it when it came out which remain unanswered because of the lack of experienced users publishing results. (The limited knowledge of the dealer/customer? in the video was embarrassing). I agree with Eric, we are lacking an in depth practical appraisal by experienced spectroscopists. Contrast this with how much we already know about the design and performance of its direct competitor out in commercial form later this year.
http://www.spectro-aras.com/forum/viewtopic.php?f=45&t=2577
For example
https://www.shelyak.com/wp-content/uploads/SMSW2_Buil_UVEX.pdf
http://www.spectro-aras.com/forum/viewforum.php?f=45
Cheers
Robin
Robin LeadbeaterParticipantThe lack of understand of what this instrument does compared with the slitless (Star Analyser?) spectrum of M42 shown there was amusing considering the ~30x difference in cost.
That spectrograph (in non automated form) has been around a few years (Maurice Gavin did a youtube review on it). I’ve yet to see a published spectrum using one though. There have been quite a few failures by companies bringing instruments into this field in the past few years. I would say to succeed it needs to get into the hands of a few observers who can show what it can do and get some results out there. That is why the Star Analyser and the instruments from the leading supplier in this high end field succeeded where others have struggled. Their latest UVEX spectrograph, also using reflective optics is coming out in commercial form later this year but is already well known from the results produced using 3D printed kit built prototypes. Getting potential customers directly involved in product development has proved to be a good way of ensuring a market for the final products.
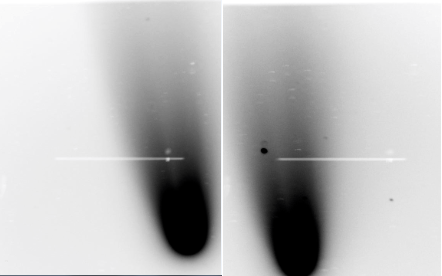
Robin LeadbeaterParticipantStunning indeed. The sodium emission is dropping away fast now. I wonder how far out from the sun we will be able to detect it? Here is a quick raw spectrum image (yet to be reduced) of the NaD line region from 2020-07-20.
Compared with the same 10 days earlier, the sodium lines are now almost superimposed on the sky lines here as the Doppler shift drops to zero as the comet passes us.
Cheers
Robin
Robin LeadbeaterParticipantdeleted
(The reply to posts is not working correctly. I replied to #121, not #122 !)
Robin LeadbeaterParticipantHi Hugh,
It was done rather crudely in this example. The spectra are flux calibrated using a nearby reference as normal. I then just subtracted the Pickles G2v spectrum scaled relative to the comet spectrum in a region where there is just the dust continuum. It is pretty good at removing the solar absorption lines and most of the dust continuum but leaves a residual shape in the continuum dependent on the broad reflectance spectrum of the dust so not good for quantitative measurements. It would be better to modify the G2v spectrum first to better fit the dust continuum leaving just the emission.
Cheers
Robin
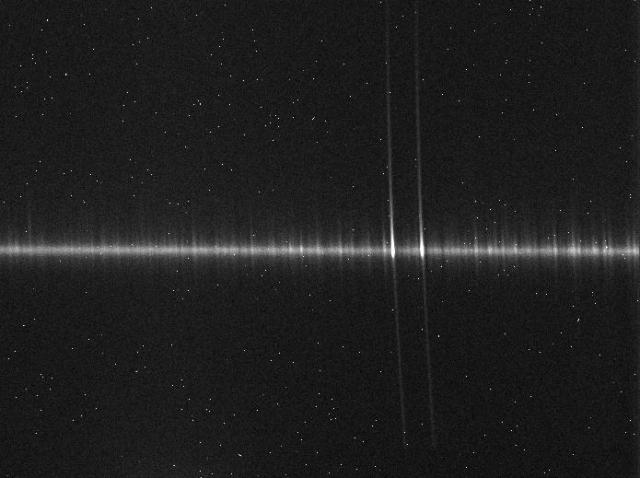
Robin LeadbeaterParticipantA spectrum of the emission lines from the comet tail.
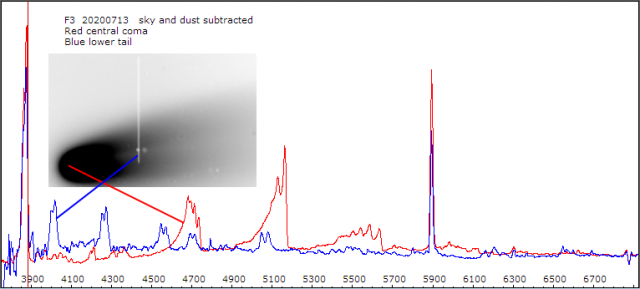
It is very different to those of the coma usually seen in amateur spectra and is dominated by CO+ emission lines (the absolute intensity in the spectrum is only ~1% of that in the coma spectrum)
Cheers
Robin
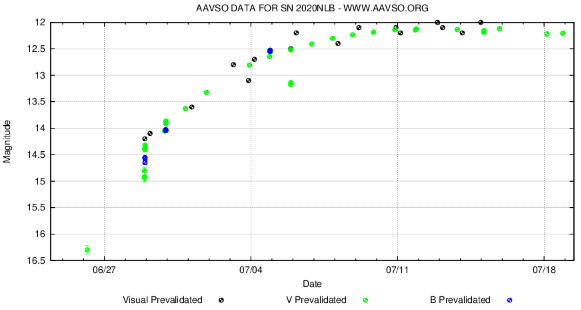
Robin LeadbeaterParticipantIt looks like it has finally reached maximum (Vmag 12.2) 3 weeks after the very early discovery. Curiously, the classification spectrum submitted to TNS has still not been made public though.
 Robin LeadbeaterParticipant
That’s great. There is definitely no Na extending out that far sideways in my image so combining the two images we see just Na near the centre of the coma and streaming out in the tail direction.
Cheers
Robin
Robin LeadbeaterParticipantHi Hugh,
Interesting. This cross section through the coma appears to show a different story to this vertical section.
https://britastro.org/comment/8942#comment-8942
Perhaps there could be some directional effects in the differences between Dust,Na D and other emission bands with the gas emission moving off the slit to the left relative to the dust. I have some cross sections across the tail still to analyse which might shed more light.
Cheers
Robin
Robin LeadbeaterParticipantA (sky subtracted but uncorrected for instrument response) spectrum image showing a cross section through the coma, taken 20200713.985 with the ALPY600 (An extreme non linear gamma contrast stretch had been applied to reveal the outer regions while not saturating the inner coma) Full size image attached
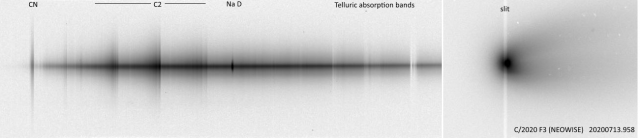
Although very intense, the sodium emission is confined to a narrow region of the central coma, particularly compared with the CN band which is visible well beyond the dusty region.
Robin
Robin LeadbeaterParticipantI’ve finally got round to analysing the high resolution spectrum from 10th July. The velocities relative to sun and earth are satisfyingly close to those published by JPL Horizons
https://britastro.org/node/23284
Robin
Robin LeadbeaterParticipantI have indeed. (Taken with the ALPY)
I just need to get round to reducing them (I am currently just finishing off the Doppler shift calculations on the high resolution spectrum)
Robin LeadbeaterParticipantI have checked with the SPI team who have confirmed that their published image was mirrored so their observation now agrees with Torsten’s ie the sodium tail is anticlockwise relative to the dust tail
Robin
Robin LeadbeaterParticipantThere’s now a NEOWISE image showing the sodium tail embedded within the dust tail.
https://psi.edu/news/neowisesodiumtail
This image is close in though so perhaps the sodium tail emerges from the dust tail further out to produce the narrow reddish tail. Not sure why it is at a larger angle than the ion tail rather than between them like Hale Bopp but perhaps that is a geometry effect ?
Robin LeadbeaterParticipantThere has been some discussions about this reddish tail on Cloudy Nights.
https://www.cloudynights.com/topic/716780-comet-neowise-high-resolution-spectrum/?p=10332533
I wondered about sodium but the neutral sodium tail seen with Hale Bopp fell between the dust and ion tails rather than at a larger angle as here. I am wondering if it could be from NH2, the emission bands of which fall in the red region of the spectrum. Perhaps some mechanism separating ions by molecular weight, CN, C2 being heavier ?
Robin
Robin LeadbeaterParticipantHi Mike,
Yep definitely a little orange image of the comet complete with tail in the spectrum there.
-
AuthorPosts