› Forums › Spectroscopy › VV Cephei news
- This topic has 43 replies, 9 voices, and was last updated 8 years, 6 months ago by
 Mr Jack Martin.
-
AuthorPosts
-
13 July 2017 at 8:18 pm #573789
 Mr Jack MartinParticipant
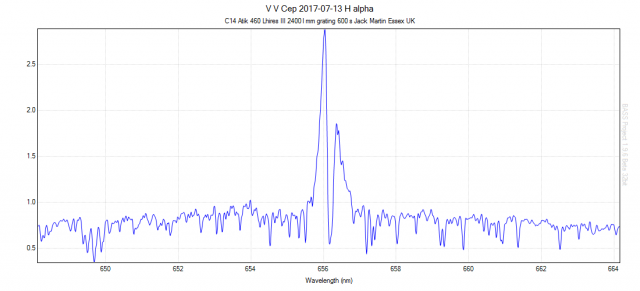
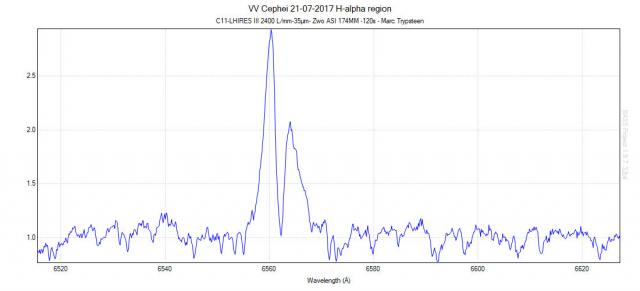
So, here is my latest spectrum of VV Cephei, not showing much change in the blue wing of the H alpha emission line yet !
The eclipse begins early August and I am continuing to monitor it.
My tally so far is 84 nights of data since 2015-08-26, which I am now close to reducing and hope to post results in due course.
Regards to all,
Jack
Essex UK
Attachments:
14 July 2017 at 2:15 pm #578335 Tony RoddaParticipant
Hi guys,
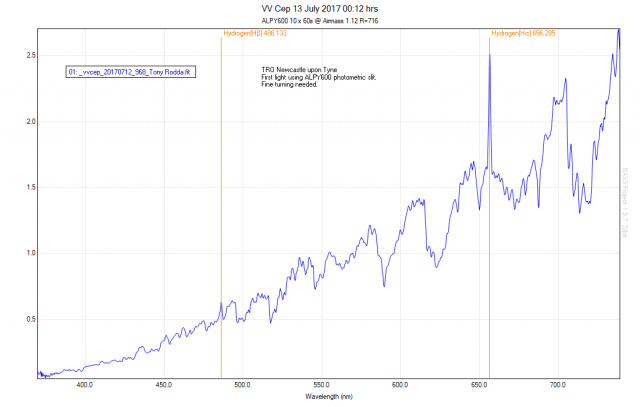
I’ve been following the thread with interest so when the first clear (dark!) night, for what seems like several decades, occurred on Wednesday I couldn’t resist a shot at VV Cep. Fascinating object.
Too low resolution to be of any scientific interest but this was ‘first light’ after a summer of faffing about – and I’d fitted a photometric slit to my Aply which I was fine tuning. (n.b. 23 um narrow slit used for this obs).
Regards
Tony
 19 July 2017 at 8:24 pm #578347
 Hugh AllenParticipant
Hi Tony,
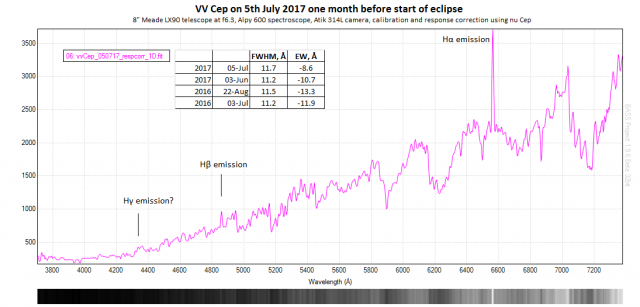
That’s a great looking spectrum. Would you upload it to the database? There are not many low resolution spectra on there – I attach the last one that I uploaded from 5th July. I agree that the most interesting science will come from high resolution spectra but I’m sure there’s a lot to be learnt from our low resolution Alpy spectra. Apart from the general evolution of the intensity of the hydrogen Balmer emission (I estimated the Equivalent Width EW of the H alpha emission from the baseline spectra that I’ve captured over the last year) I think it will be very interesting to see how the spectrum evolves down at the blue end – how visible is the spectrum of the Be star down at those wavelengths, I’ve read contradictory remarks on that. Anyway, it was great to see your result, let’s hope we get some clear skies soon!
Cheers
Hugh
 27 July 2017 at 10:26 am #578382Mr Jack MartinParticipant
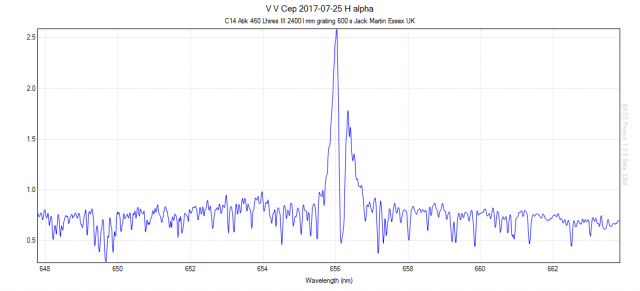 27 July 2017 at 3:07 pm #578383
 MARC TRYPSTEENParticipant
Hi Jack, the same here, no major changes, baseline indicates slow decline.
Last days unfavourable weather, forecast for coming week unfortunately not good in our region.
Kind regards,
Marc.
28 July 2017 at 10:41 am #578378Mr Jack MartinParticipantAttached is last nights 2017-07-25 result.
Still no change in the V H alpha emission line.
Regards,
Jack
Essex UK
28 July 2017 at 8:03 pm #578387 Ernst PollmannParticipant
Hi Tony and Hugh,
I am just back from the OHP meeting and saw your postings concerning low resolution spectra of VV Cep in the visible spectral range. In principle such a spectra does have also a certain scientific value, no question. In general they could reflect certain flux variations caused by variable mass flow from the super giant to the accretion disk.
But to detect this in the visible spectral range, a very precisely instrumental correction is required. In such a way corrected spectra, should show during the eclipse small continuum variation caused of the mass flow variation of the M star wind.
But again: instrumental correction is here very important.
In addition it should be also possible to detect, the disappearance of the B star (not Be) during the eclipse and its appearance after this event. On the other hand, the more important observations period at present is the eclipse itself and the expected eclipsing-time difference of the blue and red component (not the wings as you said) of Halpha. This is more precisely to detect in high resoluted spectra, taken with the LHIRES and 2400 L/mm grating. If you can do that, please upload your spectra at the BAA data base. That is the more comfortable way.Ernst
28 July 2017 at 8:11 pm #578388Ernst PollmannParticipantHugh,
you wrote: I’ve read contradictory remarks on that.
Would you be so friendly, to give information corresponding to that more in detail?Ernst
28 July 2017 at 10:08 pm #578389Mr Jack MartinParticipantMarc,
I am using a 23 micron slit as opposed to 35 micron.
So would the difference in slit width account for changes in the baseline ?
The weather here in the UK is not good.
Regards,
Jack
Essex UK
28 July 2017 at 11:20 pm #578390Mr Jack MartinParticipantMarc,
Perhaps the difference between our spectra is due to the fact that you use Angstrom units and I use nanometers so a factor of 10 out.
Ernst take note but I am sure you account for this when combining our results.
Regards,
Jack
Essex UK
29 July 2017 at 2:52 pm #578391MARC TRYPSTEENParticipantHi Jack,
Of course a different slit width influences the spectral recording behaviour. Indeed to better compare the two spectra I recommend converting the X-axis scale to Å and dito cropping between 6520 – 6620Å. However the spectral information of both spectra is very similar, taking in account the different moment of observation.
Increasing the slit width increases the incident light intensity and amplitude, but in this case slightly decreasing the Resolving Power. The incident light intensity increases proportional to the square of the slit width, so a compromise must be made to end up with a nice PSF,a good spectral baseline and SNR. In case of the newest CMOS camera’s impressive reduction of exposure times can be reached by optimal gain settings, cooling to -20 C° and appropriate dew/condense control.
Kind regards,
Marc.
30 July 2017 at 12:32 am #578403 Robin LeadbeaterParticipant
There is a nice calculator for this on the CAOS website
https://spectroscopy.wordpress.com/2009/05/22/slitpinhole-flux-calculator/#more-525
which I believe is incorporated in to Ken Harrison’s modified version of Christian Buil’s simspec, the spectrograph design spreadsheet. Plugging in the values for my setup (C11 at f10 and 3 arcsec seeing) it calculates 50% throughput at 23um, 70% throughput at 35um and 85% throughput at 50um slit width. I normally run a 35um slit.
Note that other variables such as guiding accuracy and position of the star on the slit can be as, if not more important though. The definitive test as to how much light you are using is to measure the flux of the spectrum of a star with and without the slit. (or in the narrow and wide parts of a photometric slit of you have one)
Cheers
Robin
30 July 2017 at 12:34 am #578401Robin LeadbeaterParticipantHi Marc,
I am not sure where the throughput being proportional to the square of the slit width comes from. There are trade offs between slit width, SNR and resolution but the change in throughput with slit width depends on various factors. Ignoring diffraction effects, for an extended source the increase would be proportional to the slit width but with a stellar source it depends on the FWHM of the star image relative to the slit width. A good guide is to aim for a slit width equal to the star image FWHM. With a slit wider than that you are gaining little in throughput but losing resolution. If the slit is set narrower you will increasingly lose more throughput but you may prefer to take the resulting increase in resolution if you still have enough signal to still give the required SNR.
Regardless of the camera or gain, shorter exposures means fewer photons and thus higher shot noise (which dominates at high SNR). There is no free lunch here
Robin
30 July 2017 at 12:57 am #578404Robin LeadbeaterParticipantIt is interesting to estimate the net difference in flux between Marc’s and Jack’s setup. (A C11 with a 35um slit compared with a C14 with a 23um slit.) at 3 arcsec the slit throughput is 70% and 40% respectively but because of the higher collecting area of the C14 the difference in flux is reduced. The net effect is the total flux after the slit should be quite similar (Jack’s is ~5 % lower) Jack’s resolution will be ~50% higher though because of the narrower slit.
A good estimate of the actual resolution can be made from the FWHM of the internal calibration lamp lines.
Robin
31 July 2017 at 11:28 am #578411MARC TRYPSTEENParticipantHi Robin,
Many thanks for your concern and experienced viewpoints. much appreciated !
To clarify something first: With ” incident light intensity” I did not ment throughput. It concerns the light bundle falling in on the grating of the spectrograph coming directly from the slit. Hence: Intensity depends on the energy and is proportional to the square of the Amplitude, which is sinusoidal and proportional to the slit width. Two effects are multiplicated here : increasing slit width increases the spatial fraction or area of the light bundle and besides that the spectral fraction. It is a common way to express the theoretical behaviour in analytical spectroscopy like absorption/emission/fluorescence type.
Throughput is the final result of the “Spectrograph train” and is proportional to the Bandpass/slit width.
Excellent Idea to compare the two set ups. I already used the CAOS calculator to see the preliminary difference, thanks Robin.
Anyway I’m certainly interested in the “set up result” comparison with Jack. As soon as he has uploaded his spectrum to the database we will start comparing fluxes. Also the excellent work input from Ernst, who always gives an evaluation of the recorded spectrum is very valuable. Last evaluation indicated a perfect and reliable match of the EW for the V and the R component on the baseline so far, so this is excellent news for this short exposure. We’ll see how it evolves…
Photometric slit recording tests are already foreseen, I hope Jack has also such a slit, so we can compare those also. Very interesting and scientifically important experiments.
Have a nice day,
Kind regards,
Marc.
6 August 2017 at 8:57 pm #578426Mr Jack MartinParticipantHello all,
I would attach a calibration lamp spectrum.
But bigger than 2 MB is there any way round this ?
Regards,
Jack
Essex UK
6 August 2017 at 9:37 pm #578427Mr Jack MartinParticipantMarc,
I use Shelyak SE0002B Lhires III 4 position slit NOT the photometric slit as advised by Olivier Thizzy sometime ago.
Regards,
Jack
Essex UK
7 August 2017 at 11:37 am #578428Robin LeadbeaterParticipantHi Jack
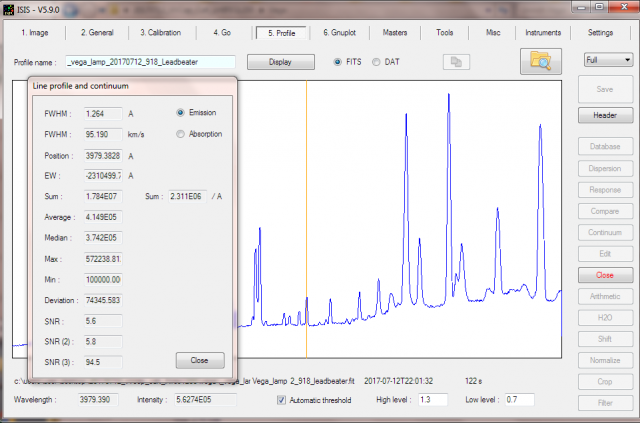
ISIS automatically estimates the resolving power from lamp line widths for you and adds it to the fits header (SPE-RPOW) or if you want to manually measure it (for example on different lines across the field) you can produce a spectrum profile using the lamp image and measure them directly using the FWHM function.
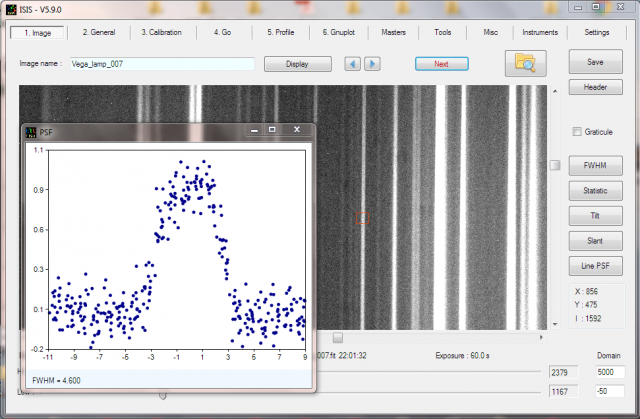
In ISIS you can even measure the width of the lines (in pixels) directly off the image using the PSF function – useful for checking if you have best focus.
Cheers
Robin
7 August 2017 at 8:16 pm #578429 Steve CuthbertParticipant
Hi Jack
You could just do a screen grab!. Get the spectrum on screen then press prt scn button (some keyboards show it as print or scn ) this copies a grab of the screen which if you then open an app like Microsoft Paint then press ctrl and v together this will show the grab you took which you can then save as a JPEG which will be a lot less than 2mb.
HTH
Steve
8 August 2017 at 9:35 pm #578432Mr Jack MartinParticipantRobin,
I am keen to submit my data for further analysis as suggested by Marc, BUT I use BASS not ISIS to do my data reduction.
Thank you for your input, any further comments welcome.
Jack
Essex UK
-
AuthorPosts
- You must be logged in to reply to this topic.