Forum Replies Created
-
AuthorPosts
-
 Dr Paul LeylandParticipant
Well, my forum avatar is a mugshot of me. Unlikely to be of much use though unless you had a 4d-aware camera at the time. 😉
Dr Paul LeylandParticipantI attended the meeting of 1991-09-20/22 in Durham so there’s a chance that I may be on some of the photos. Not spotted me yet but there are a number of folks barely visible behind others. Perhaps I am on some of the unpublished work.
Also a nice motorbike ride from Bucks. as I remember.
Dr Paul LeylandParticipantAlas poor Heather! I knew her, David, a woman of infinite jest, of most excellent fancy.
Heather Couper and I knew each other from our Oxford days. She once gave a talk to OUAS (the Oxford University Astronomical Society) and greeted me with the phrase: “Hello Paul, my old sausage, how are you doing?”. This caused a little surprise in the people near by, one of whom asked me: “What did she just call you?”.
She was often called “Heather Cowpat”, but never in her hearing AFAIK.
Very sad.
Dr Paul LeylandParticipant“no reason why we can’t regard the first decade of the Common Era as having only 9 years”. I can think of an excellent reason and it is entirely a matter of etymology. “Deca”, from the Greek Δεκα, meaning “ten”.
If you wish to refer to the first few years CE as a nonade please go ahead and do so — I will support you whole-heartedly.
Dr Paul LeylandParticipantMy thanks to Andy and Robin for their helpful advice. I was aware what is held in the DB but that explanation should be useful to others. The suggestion to contact the PI is a good one and as I will be keeping all the raw (but calibrated with darks and flats) images that will remain a possibility for those who may wish to re-analyse my data.
Most people, though, are unlikely to be that finicky and would like to have an overview of the light curve which is sufficiently good for their purposes without having to spend a great deal of effort. With that in mind, I will stack the images such that the integrated SNR is at least 30, yielding a statistical uncertainty of ~30mmag, easily good enough to pick up the pm 110mmag variation reported so far. As the database holds an explen field for each entry, I don´t see that it matters whether three subs or a dozen are stacked for each individual measurement — as long as the total duration and effective mid-exposure time is recorded of course, as it will be.
FWIW, I store essentially every image ever taken, with its metadata in a PostgreSQL database, because disk space is cheap and I have yet to reach even a terabyte of data. Multiply that by a few hundred observers, especially if they are taking high frame rate videos, and I can see it starting to become a problem.
Dr Paul LeylandParticipantThanks. You understand my proposal and I was specifically thinking of the analysis phase. That should have been made clearer.
Unfortunately from the analysis point of view, the database stores only a magnitude and its uncertainty at a particular JD. The last is an annoyance but nothing more as conversion to the more useful HJD or BJD is a tedious but straightforward computation. The first two destroy some of the information held by the intensity counts of the VS, the sequence stars, local sky backgrounds and the latter’s variance. Further, it does not store the data pertaining to other stars in the image which can be used — with care — to give a tighter estimate of the ZPM and its uncertainty through ensemble photometry. Needless to say, I keep all the raw data around for subsequent re-analysis. Please note that I am not saying that the database structure should be changed!
Perhaps I should submit the raw 30s results with their 0.05 to 0.1 magnitude uncertainties and let others smooth them as they wish for their analysis. I can pretty much guarantee the 3.2-hour variability will not be visible without such smoothing.
Dr Paul LeylandParticipantMore 30s captures of U Leo are coming in to add to the hundreds already stored. This is all rather tedious so I have been thinking about data processing and, in particular, about stacking the images. The SNR of each sub varies between about 10 and about 20, depending on sky transparency, air mass, etc. A desirable SNR might be 30-50 so perhaps 9 should be stacked.
So far, so simple. I could just divide up each night’s observations into consecutive and non-overlapping sub-sequences of length 9, stack them and use the mid-exposure time as the date of each measurement. However, it seems that there is nothing particularly magic about any particular selection of 9 consecutive images. If the first image, say, was deleted by accident the process would yield much the same output but would contain a sample of the light curve slightly displaced from that which would have been created from the full set of images.
If this is the case, why not create 9 light curves, each with a temporal displacement from its neighbour set by the cadence of the subs?
Each curve would have no more information than any other, and the sum of them would be just as noisy in intensity values but would have more temporal sampling. Might not this assist subsequent processing to extract a smoother light curve from the noisy data? If not, what am I missing? To me it appears related to a simple running-average smoohng process. It’s late and I am sleepy so could well be overlooking something which should be obvious.
Dr Paul LeylandParticipantHi Grant,
You are probably aware of the material below, as it has a long history, but it is posted here for the amusement and possible education of others.
Zeroth Law of Optimization: First get it right, then get it fast.
You can do anything arbitrarily quickly as long as your code is not required to get the right answer.
First Law: Intelligence trumps code.
Use a good algorithm. Optimizing a bad algorithm is akin to polishing turds.
Second Law: Know what is going on.
Unless you profile your code and take timing measurements most everywhere, you don’t have a clue what is worth optimizing.
Third Law: Don’t do it.
Only calculate stuff you actually need. You might be surprised at how much extraneous garbage is computed in libraries, etc, without your knowledge.
Fourth Law: Don’t do it now.
Covers a number of issues, including lifting computations outside loops and storing stuff in registers or cache-friendly memory.
Dr Paul LeylandParticipantGood work Grant!
Could you point me at the source code please, or perhaps mail me a copy? It has been a few years since I last wrote GPU code (CUDA then, ought to be OpenCL these days) and perhaps I may be able to get off my backside and do something if given a sufficiently large kick incentive.
There are tens of thousands of images stored on a server at home in the UK and it would be nice to see what can be dug out of them.
Thanks.
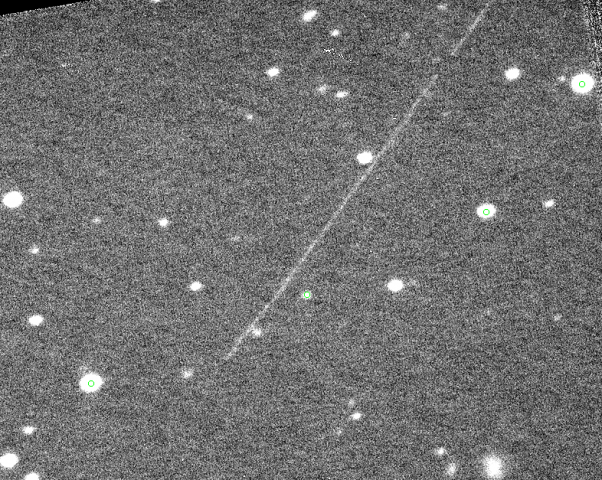
Dr Paul LeylandParticipantI made the claim As long as any satellite trails (or cosmic ray hits for that matter) do not intrude on the object or its immediate neighbourhood, our work is completely unaffected. Here is some supporting evidence which turned up quite by chance.
Below is an image from my work on U Leo and is the average stack of 32 exposures each of 30 seconds duration, two of which caught a very bright satellite in transit. The gap in the trail shows the movement during period the CCD was downloading its data between successive images. Even when diluted 31-fold the trail is still very obvious. U Leo (the central marked star just to the right of the trail) and it comparison stars are identified; none lie anywhere near the trail so photometry is unaffected. The VS is measured to be V=17.52 +/- 0.05 at 2020-01-21T00:30
 Dr Paul LeylandParticipant
Unfortunately the software released is Windoze only, which rules out a large number of astronomers. Oh well.
Looks like a free implementation should be created. Time to track down the references given in a paper on the Tycho site.
Dr Paul LeylandParticipantYou may wish to consider running Linux on your Mac. In my experience, which is extensive on all three operating systems, Linux is by far the most developer-friendly environment. In one sense, Linux is closer to MacOS than either are to Windows. MacOS is a fancy graphical environment built on top of BSD Unix. Windows is starting to catch up now that Linux binaries can be run natively, notably the bash shell.
With the recent demise of support for Win7 the migration route to Linux for my TCS is well advanced. As far as I can tell everything I need for imaging, guiding, pointing, focussing, etc, runs well under Linux.
Dr Paul LeylandParticipant“Given this star is rather faint, at mag 17.3, it is a target for CCD observers. It will require long and unfiltered exposures to get a reasonable signal-to-noise ratio.”
It is rather tedious sitting here waiting for photons to arrive so I am trying to get ball-park estimates of what is likely to be achieved. As the autoguider on the 0.4m Dilworth / unfiltered CCD combination still doesn’t work I restrict each exposure to 30 seconds. The sky tonight is fairly dark but not exceptionally so. The SX 814 has a very low dark noise and so the major limit on SNR is sky glow. I have found that averaging 20 subs, for a total exposure time of 10 minutes, gives a SNR of 50 to 55 when U Leo is at altitude of 60 degrees. It will be worse at lower altitudes, of course, or if the Moon is above the horizon. A SNR of 50 corresponds to a precision of 0.02 magnitudes. The light curve in the VSS Circular suggests that the peak-to-peak amplitude is perhaps 0.1 magnitudes. A period of 3.2 hours corresponds to 192 minutes. Accordingly I can hope for at most 19 samples per period at an amplitude precision of 20%. In practice it will be less because of download times and inevitable discarded images from poor tracking.
It is going to take a lot of heavy duty signal processing to get robust results from my observations alone. If I had perhaps ten times the data I should be able to get something useful. We need lots more observers, in other words.
One unexpected side benefit is that U Leo lies in a rich field of galaxies, including a bright face-on spiral known as 2MASX J10234921+1357083 (it appears on Jeremy’s finder chart roughly halfway between U Leo and the bright star in the lower left corner; an edge-on spiral of around 17th magnitude lies to its left). Only a few hints of spiral arms have appeared on a large stack but a “pretty-picture” may yet be possible. The galaxy’s magnitude is g=15.9 and r=15.2 so it shows up on every single sub. There are many more galaxies brighter than 20th magnitude within a few arc minutes of U Leo; they are starting to appear in my data as the stacks get deeper.
Added in edit: since typing the above text the SNR has almost doubled. Presumably the sky has become notably brighter for some reason I do not understand. Perhapsthe signal processing may be easier than feared.
Dr Paul LeylandParticipantOK, CV it is then. The sequence for AT 2019xim must have been added after I took the data, which is not surprising. My observations were completed within 48 hours of the ATEL being released.
My SOP for all variables except the very brightest is to take 30-second subs and stack in real time. That way I can estimate the SNR and move to another object when it is high enough or very obviously too faint to be measured with sufficient precision. Stars which can vary by several magnitudes between successive observations can easily turn out to be saturated or invisible if purely dead reckoning is used to set exposure lengths.
Dr Paul LeylandParticipantI took 100 minutes of unfiltered 30s images in the wee hours of 2020-01-20, though the SNR is so low that to get adequate SNR they will probably have to be co-added a few at a time. Another run took place on 2020-01-04. They, as well as some precision photometry in Johnson V and Sloan r´, still need to be processed. Perhaps this data is too early for the INT run; I will try to take some more in the next few weeks.
A question arises from our earlier discussion in the forum about the use of non-standard sequences for VS observations to be submitted to the BAA-VSS database. There is no standard sequence for unfiltered data. Advice would be welcome, whether here, in the original thread, or off-line via email. Another case without any standard sequence concerns the observations of AT 2019xim reported on my members page. I have specifically withheld submission of the results for this reason.
Dr Paul LeylandParticipantcontains two, one at 143 and the other at 153. Both are inconveniently distant at around 15-20 arcmin (a guess from the chart scale – I have not measured them).
Personally I´d use them to measure the instantaneous brightness of other stars closer to the SN and then measure the SN with respect to them. If the images of the fields are taken within a few minutes of each other, it is very unlikely indeed that all the secondary comparisons are variable on that timescale, and not very likely that even one will be. If one or more is a LPV, who cares? It’s constant for all practical purposes.
If you discover that one or more field stars varies from night to night, that in itself is worth reporting.
Dr Paul LeylandParticipantI am now at the telescope taking a long series of exposures and a satellite or meteor just went through a frame. Very faint. Stars down to 17th mag are easily visible but the trail only just shows up above the sky noise. Guess 15th or so? It is going to be completely invisible in the final stack.
Not sure how relevant this is to the current discussion but it shows that we don´t need Starlink to be able to pick up the present vermin of the skies.
Dr Paul LeylandParticipantGood point.
Presumably one could monitor the field and avoid taking data during the satellite pass. Could be an interesting exercise writing software for motion detection in the autoguider camera.
How do you deal with satellite trails now?
Depending on whether I am doing photometry or imaging (which includes astrometry for present purposes) I either discard the sub before average-stacking or rely on median-stacking to discard the satellite for me. In either case, such concerns are of interest only when the satellite passes inconveniently close to the objects of interest, otherwise it is just ignored.
There again, I take as many 30 to 60 second subs as are needed to reach a satisfactory SNR (which depends on sky brightness, for instance) and then move on to another target. A cheap and simple way of optimizing the productivity of telescope time. Vary rarely does a single exposure exceed a couple of minutes.
Dr Paul LeylandParticipantI think that post can be counted as a success and that my client, often known as The Great Deceiver, will be well pleased.
You appear to have been led to believe that a reduction by a factor of pi in the number of degrees in the complete sky is an improvement. In terms of the average number of satellites per square degree, however …
😉
Dr Paul LeylandParticipantSpectrosopy is as unaffected, no more, no less, than photometry and astrometry.
-
AuthorPosts