Forum Replies Created
-
AuthorPosts
-
 Hugh AllenParticipant
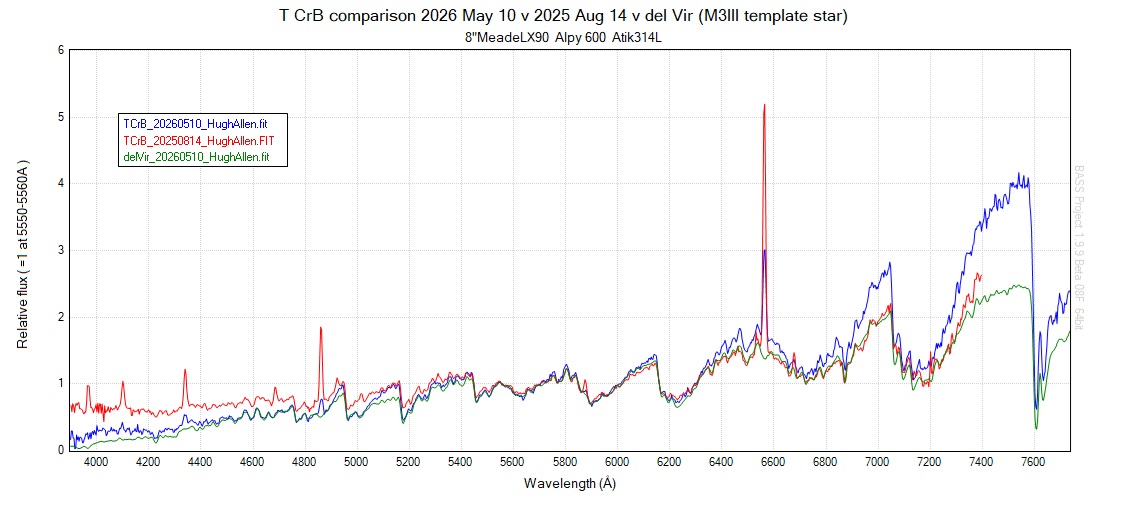
Thanks Mike for preparing this light curve comparison. The spectrum has shown interesting changes too over this date range (see attached comparison 2025 Aug 14 v 2026 May 10). The emission line changes have been much discussed. But in agreement with the light curves you have compiled from AAVSO data, the spectrum seems to have reddened significantly. It now diverges signifcantly from the shape of the spectrum of del Vir which I think is considered a template M3III type star, the spectral type of the red giant in the T CrB system. I wonder too what is occurring?
Hugh AllenParticipantHi Jeremy, is it likely to be recorded? I would love to attend this meeting but am on holiday unfortunately 🙁
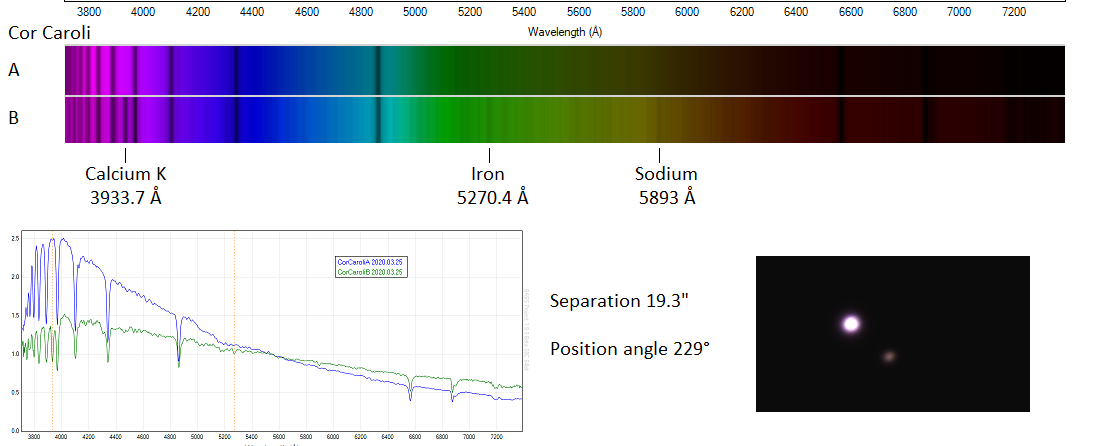
Hugh AllenParticipantCor Caroli, a beautiful double star to observe visually and in a spectroscope
Attachments:
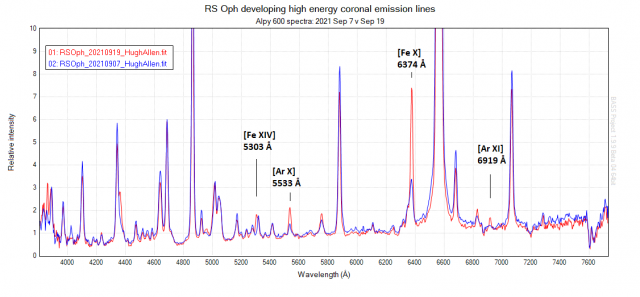
Hugh AllenParticipantDue to collision shock between the white dawrf nova explosion and red giant wind, the growth of very high energy coronal emission lines in the RS Oph spectrum now appears to be in full swing. Would others agree with my identification of these lines in the attached comparison?
Cheers
Hugh
 Hugh AllenParticipant
Hi Robin,
That’s a very convincing B-V curve – so the photometric and spectroscopic eclipse mid-points are in good agreement, like they were also in the two studies I cited in my paper from the late 1997-98 eclipse. Could some variability in the red supergiant be a factor in the changes in the eclipse measurements? It’s hard to understand and makes the next eclipse in 2038 an event to be anticipated!
Cheers
Hugh
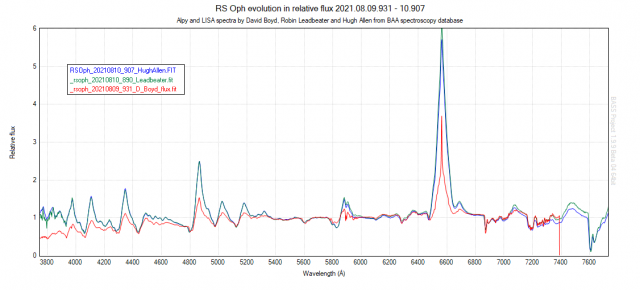
Hugh AllenParticipantAmazing to have a hat trick of bright novae, and the latest such an anticipated event. The weather here in Somerset has been poor this last few weeks but in murky conditions I was able to capture RS Oph last night, just 20 minutes after Robin’s spectrum in the BAA spectroscopy database. There is good agreement between our two spectra, both captured with an Alpy 600. Compared to David’s spectrum from the previous night (higher resolution LISA spectrum), there has been a significant increase in the relative intensity of the emission lines but is this due mostly to a decline in brightness of the nova?
Cheers
Hugh
 Hugh AllenParticipant
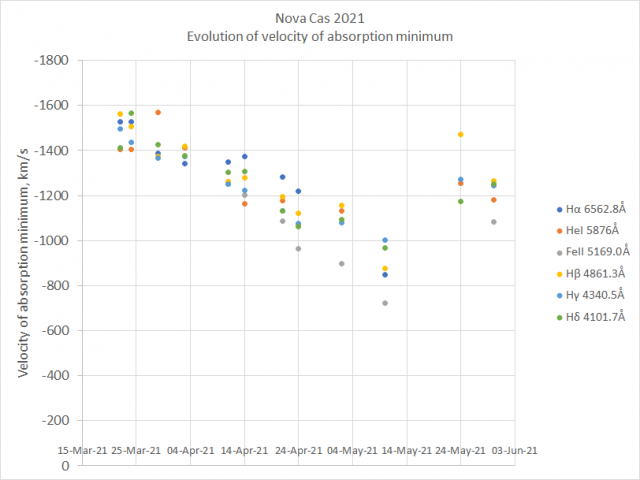
After a little sleep I’ve attempted to interpret last night’s spectrum. I estimate an explosion velocity of about 3450 km/sec based on the P Cygni profile of the Hα emission. I’ve annotated the spectrum with the rest wavelengths of the first seven H Balmer lines, where at the shortest wavelengths the P Cygni profiles are not consistently positioned based on my estimated explosion velosity. I also added couple of the HeI l lines where the positions are consistent. Using my explosion velocity, several of the deepest absorption lines appear more consistent with some specific metal P Cygni profiles. It’s certainly a fascinating spectrum

Cheers
Hugh
Hugh AllenParticipantIt’s wonderful that a ‘new star’ appears in the sky when the weather is ideal! The BAA notification system worked perfectly and I was able to observe the possible Nova Her 2021 after first capturing another spectrum of Nova Cas 2021. This is an extraordinary spectrum the like of which I haven’t seen before

Cheers
Hugh
Hugh AllenParticipantYes Mike, the HeI emission has returned amongst a few other significant changes in this wonderful nova. I’ve captured a dozen spectra since Mar 22, here’s an offset relative flux plot of a few of them showing the disappearnce and then return of the HeI emission:
I’ve also been monitoring the expansion velocity. Until May 24 it was showing a perhaps expected gradual decline, but then briefly increased in my spectrum of May 24 around the time the nova began to brighten again. My latest spectrum from last night May 30 suggests the decline in expansion velocity has resumed accompanied by a strengthening again of the P Cygni profiles:
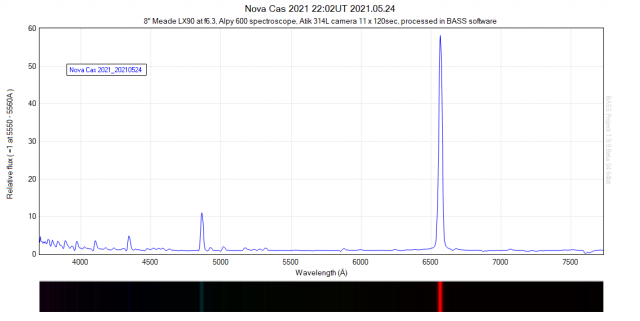
The spectrum is dominated by the overwhelming relative brightness of the H alpha emission line. Here is the spectrum from May 24:
A truly remarkable object and great fun to follow in a spectroscope!
Cheers
Hugh
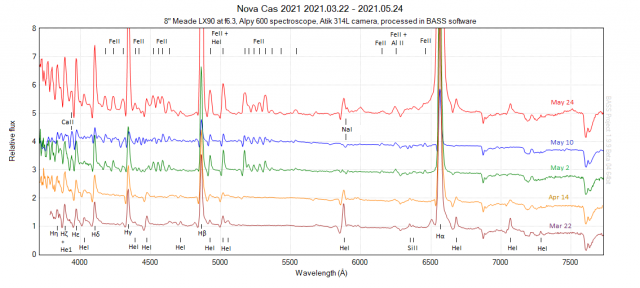
Hugh AllenParticipantAmazingly there was a hole in the weather here in Somerset last night. The nova was incredibly bright! I had to drop the camera exposure from 300 to 90sec to avoid over exposing the H alpha emission. It is now putting on a complex display of emission lines with beautiful P Cygni profiles. The H Balmer series is still prominent whilst helium emission lines have now disappeared to be replaced by a forest of singly ionised iron emission lines some of which I’ve marked. Also very striking is the pair of singly ionised calcium emission lines down in the violet, their associated blue-shifted absorption reminiscent of the solar spectrum. A wonderful spectrum!
 Hugh AllenParticipant
Hi Mike,
i hope you don’t mind. I had a go at processing your spectrum image in BASS:
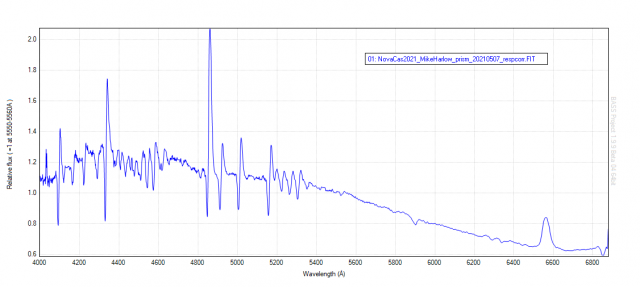
I calibrated it using the emission line wavelengths from one of my own Alpy spectra. And I made a response correction using the reference star BD +60 2540 that you highlighted in your image. I used the Pickles reference for an A5III star because there is no reference for an A5II. I think the calibration and response correction came out pretty well:
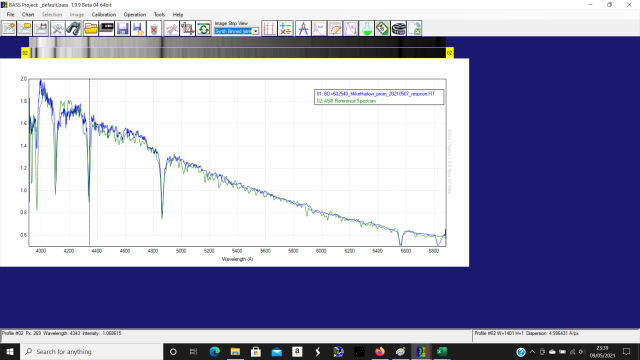
Anyway, it was a bit of fun and I think it shows the quality of your spectrum down in the green-blue end. I think the red end was maybe saturated in your image which could explain the fat, squat appearance of the Halpha emission
Cheers
Hugh
Hugh AllenParticipantHi Mike
The link to the Spectroscopy Database is in the tool bar to the right of this forum thread, back up towards the top of the page under the ‘Observations’ heading. Once inside, click on the ‘Review Spectra’ tab and all of the search fields are right there. The spectra can be plotted on the screen or dowloaded as fits files for analysis at your leisure. It’s a fabulous resource.
I put up an animation on my Member page, from the blue-green end of the spectrum. Actually I might add another one for the yellow-red end
Nice to see your prism spectra!
Cheers
Hugh
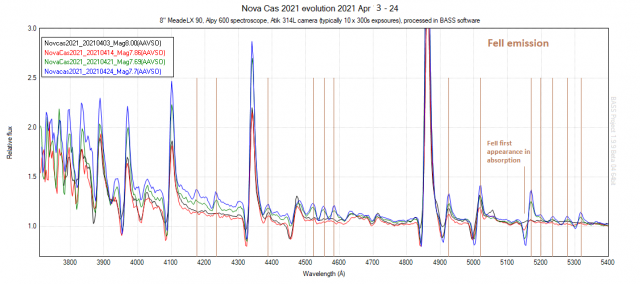
Hugh AllenParticipantConfirmation of the emergence of FeII lines after 2021 Apr 3. All spectra are in the BAA database:
 Hugh AllenParticipant
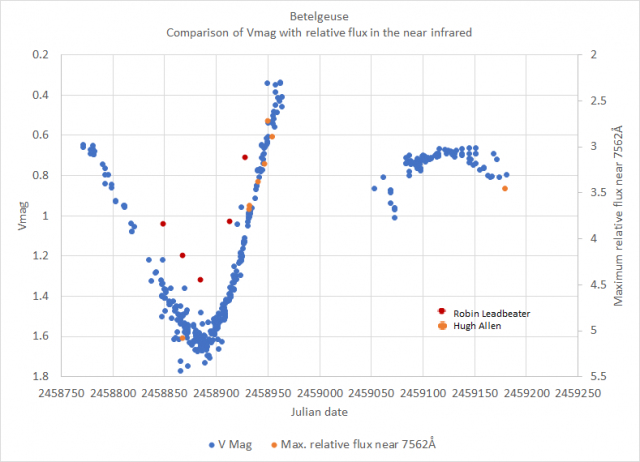
Betelgeuse is disappearing into the twilight but it’s still possible to get good spectra. I captured my latest spectrum yesterday evening with the star just 19deg above the western horizon. The relative brightness in the near infrared is continuing to increase…
 Hugh AllenParticipant
Hi Robin,
Very nice supernova spectrum as always. What is the correct way to estimate ejecta velocities along the line of sight from P Cygni profiles? Is it the emission centre to the absorption minimum or to the absorption blue edge?
Cheers
Hugh
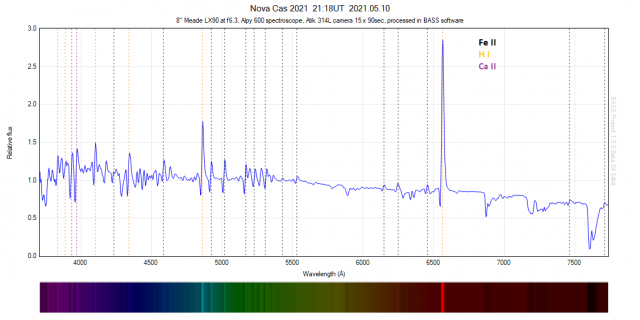
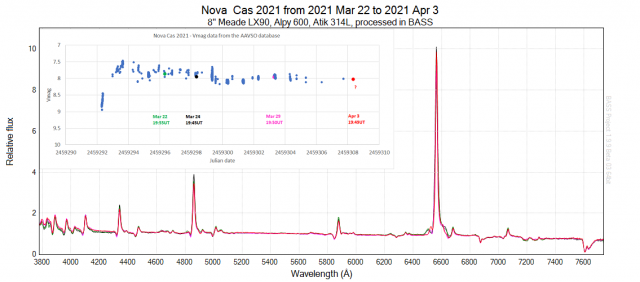
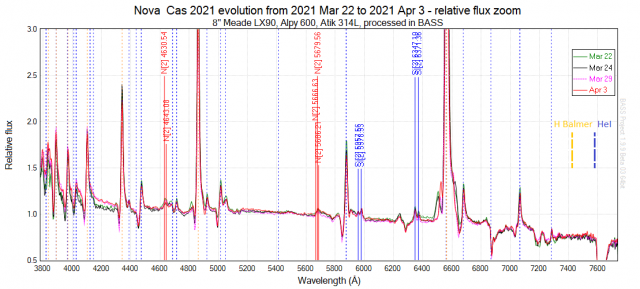
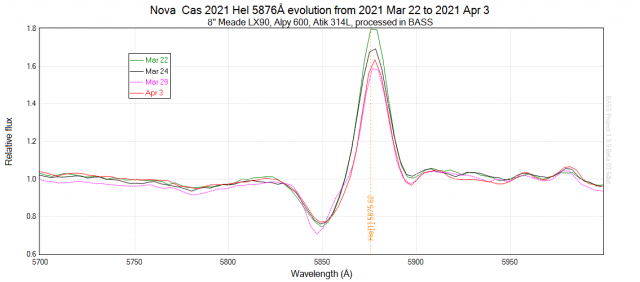
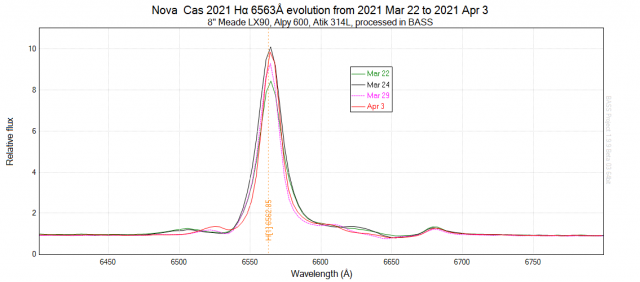
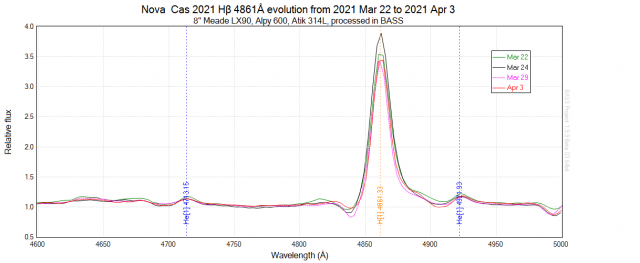
Hugh AllenParticipantIn my Alpy 600 spectroscope, the evolution of the spectrum of Nova Cas 2021 is really quite gentle over the last couple of weeks. According to Vmag data from the AAVSO databse, the visual magnitude has also changed only slightly over this time so I’ve made my comparisons in relative flux. The P Cygni profiles on the emission lines remain very strong. Apart from the forest of strong neutral Helium emission lines (HeI) and the hydrogen Balmer lines, I’m also suggesting the presence of two strong pairs of silicon emission lines and even some weaker nitrogen NII lines.
Cheers
Hugh
 Hugh AllenParticipant
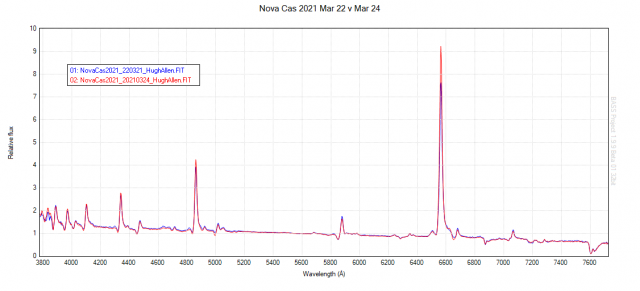
This evening’s spectrum compared to Monday night’s. An increase in Balmer emission and very slight decrease in HeI emission (assuming that the magnitude is similar between the two nights)
Hugh
Hugh AllenParticipant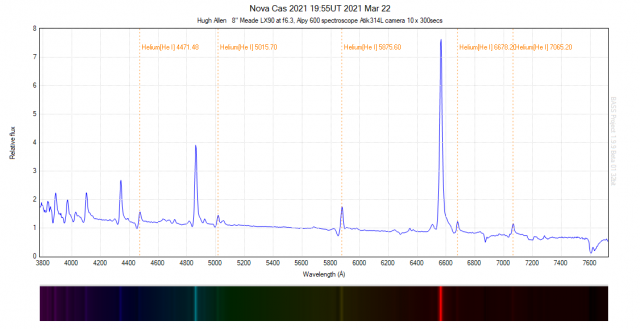 At last a slightly murky break in the clouds here in The Mendips, to allow me to record the evolving spectrum of this beautiful nova. There are many neutral helium emission lines as well as the hydrogen Balmer series, all with very striking P Cygni profiles due to Doppler shift in the expansion along our line of sight. It is always a thrill to capture the spectrum of a unique object like thisHugh AllenParticipant
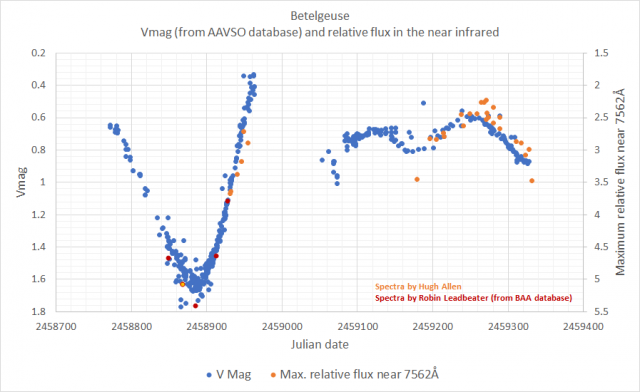
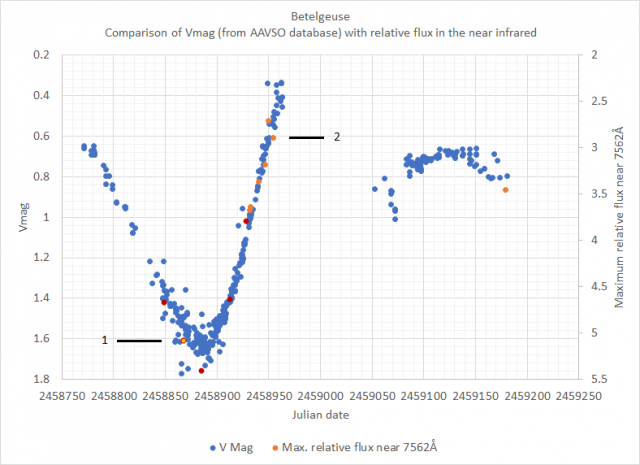
Thanks for your feedback Andrew, and Robin as well. By normalising the relative flux near the centre of the V-band filter, I wondered if the changes in the relative flux in the near IR could then be monitored in a useful way compared to changes in the observed V magnitude (essentially a way of quantifying changes in the shape of the spectrum as the visual magnitude varies). But I can see some of the dangers, not least the initial process of corrrecting the shape of the spectrum for atmospheric effects. In the BAA database, Robin has a number of Alpy 600 spectra of Betelgeuse on which I made the same analysis:
There is an offset between our two methods of atmospheric correction. However the difference should just be a constant factor which can be best estimated from our almost simultaneous observations on JD 2458867.4 (2020 Jan 18), marked as point 1 in the adjusted chart below which shows all of the points from Robin’s data adjusted by the same factor. Once adjusted both our data follows a consistent trend. Point 2 is very interesting. It was my last observation of Betelgeuse on JD 2458954.3 (2020 Apr 14) before it disappeared into twilight and shows a significant increase in the relative intensity in the near IR even though the V mag was also continuing to increase:
 Hugh AllenParticipant
Mark Kidger’s interesting article on the possibility for another deep fade of Betelgeuse coincided with my restarting spectroscopic observations (unfortunately only one break in the clouds so far here in the southwest in the last few weeks). The deep visual fade and rebrightening of Betelgeuse at the beginning of this year was accompanied by the reverse change in relative brightness in the near infrared (I think there was an earlier thread on the forum about this but I couldn’t seem to find it). This could be seen in my Alpy 600 spectra corrected for instrument response and atmospheric effects. I’ve tried to approximate this change by measuring the maximum relative flux as far into the infrared as my combination of Alpy 600 and Atik 314L camera will allow, in the region 7555 – 7565Å:
A comparative plot of the Vmag data from the AAVSO database along with this maximum relative flux in the near infrared gives the following:
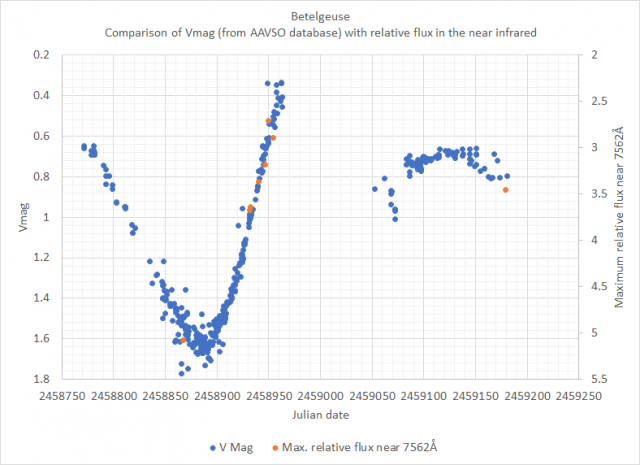
I’d be interested in any feedback on this methodology. And it will be interesting to see how the two characteristics evolve over the next few months. Could the evolution in the near infrared depend on the casue of the fade (pulsation, starspot or dust?)
-
AuthorPosts
Hugh